The Market Update is a daily newsletter written by the team at iVolatility.com. Leveraging our analytics and data we are able to update you on key developments in the volatility market. To receive the Market Update directly into your inbox, please open a free account or visit our SITE where it is published every day. |
More upside in INTC and NVDA? |
Yesterday saw US indices continue to move higher with the NDX closing up more than 2% on the day. The SPX finished 1.5% higher and the DJX closed 1% higher. |
Implied volatilities continued to drop, 30d IVX for NDX finished 1 point lower while 30d implied volatilities for the SPX and DJX were down around 1.5 points. |
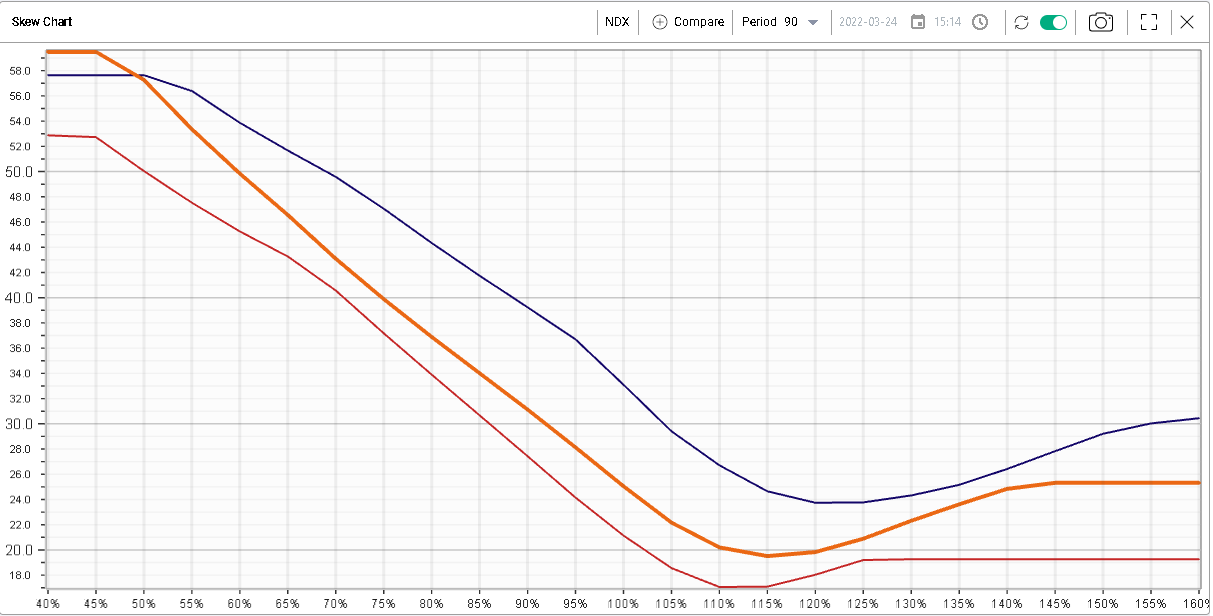
Looking at the NDX, we can see on the below skew chart for 90 days implied volatilities that while we have deflated significantly from the levels reach on the 8th of Mar’22 (blue line), the orange line showing the skew of the NDX as of the 24th Mar’22 is still trading higher than where it was at the end of last year in red. |
|
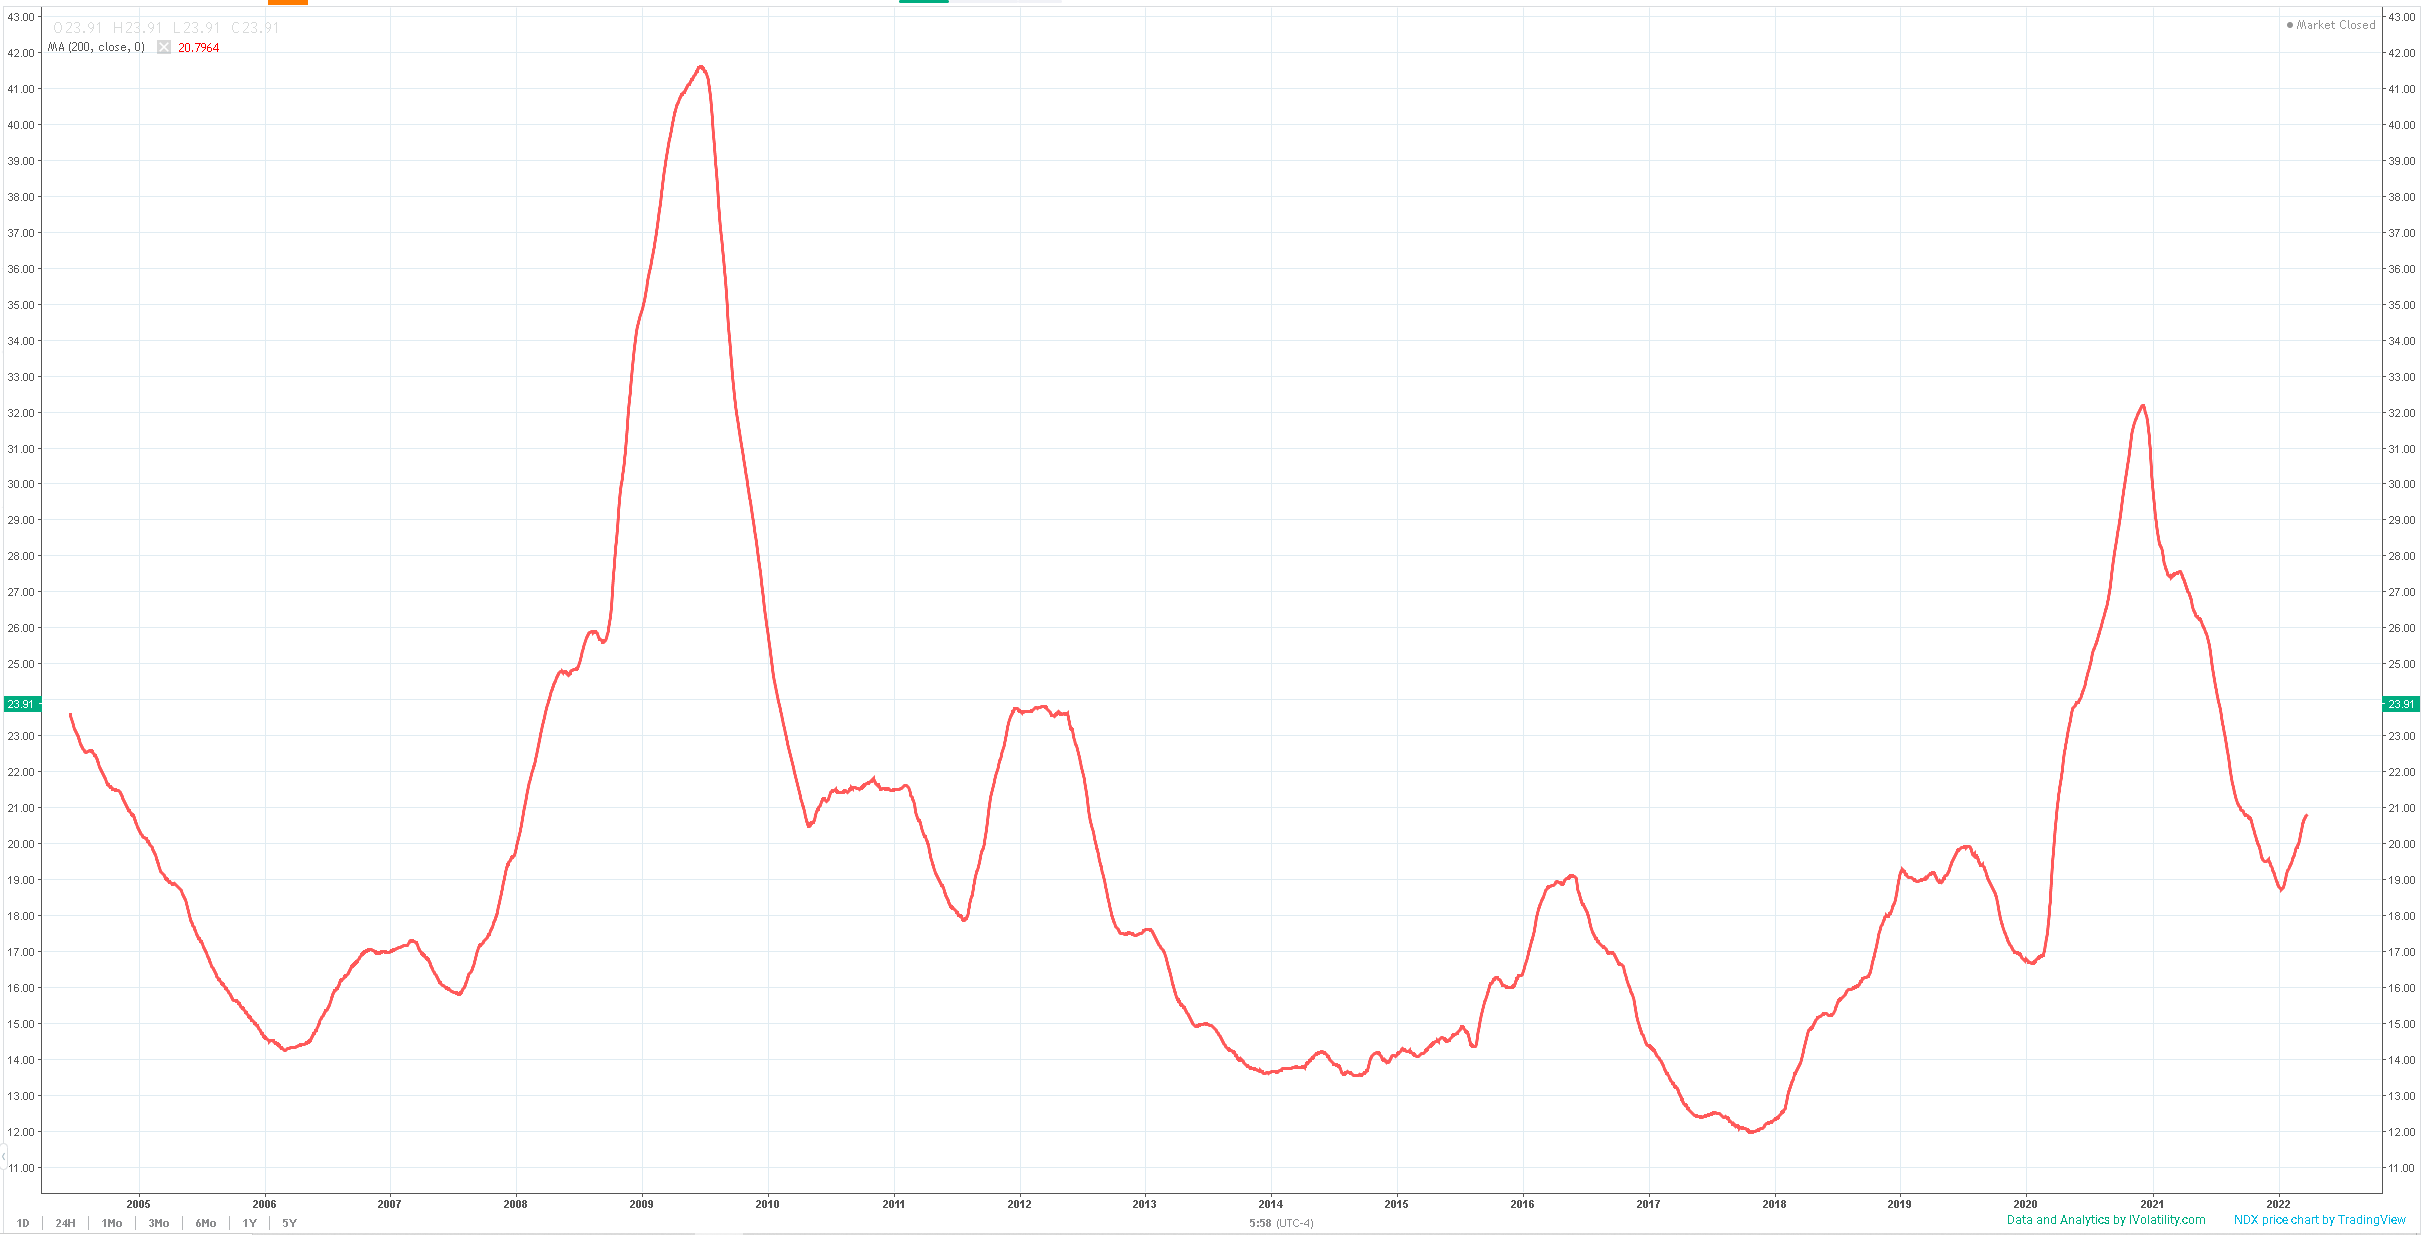
Looking at the below chart, showing the 200d moving average of our proprietary 30d IVX on NDX, it seems that we are still in the middle of a volatility expansion phase that started towards the end of 2018. |
|
This expansion phase seems to have known sub cycles and it seems that the compression phase that followed the pandemic bottomed towards the end of last year. |
It is obviously very difficult to predict what will happen going forward and this will largely depend on how the news flow will evolve but it is possible that the uncertainty in the market will continue to rise as many questions remain open for now: |
|
Many more points could be added to this list but it serves to illustrate that the amount of uncertainty at least in the short run remains elevated. |
As such options are still highly popular products to express views as they allow their buyers to strictly control their exposure and the risk they carry throughout the life of the trade by limiting the loss to the premium spent. |
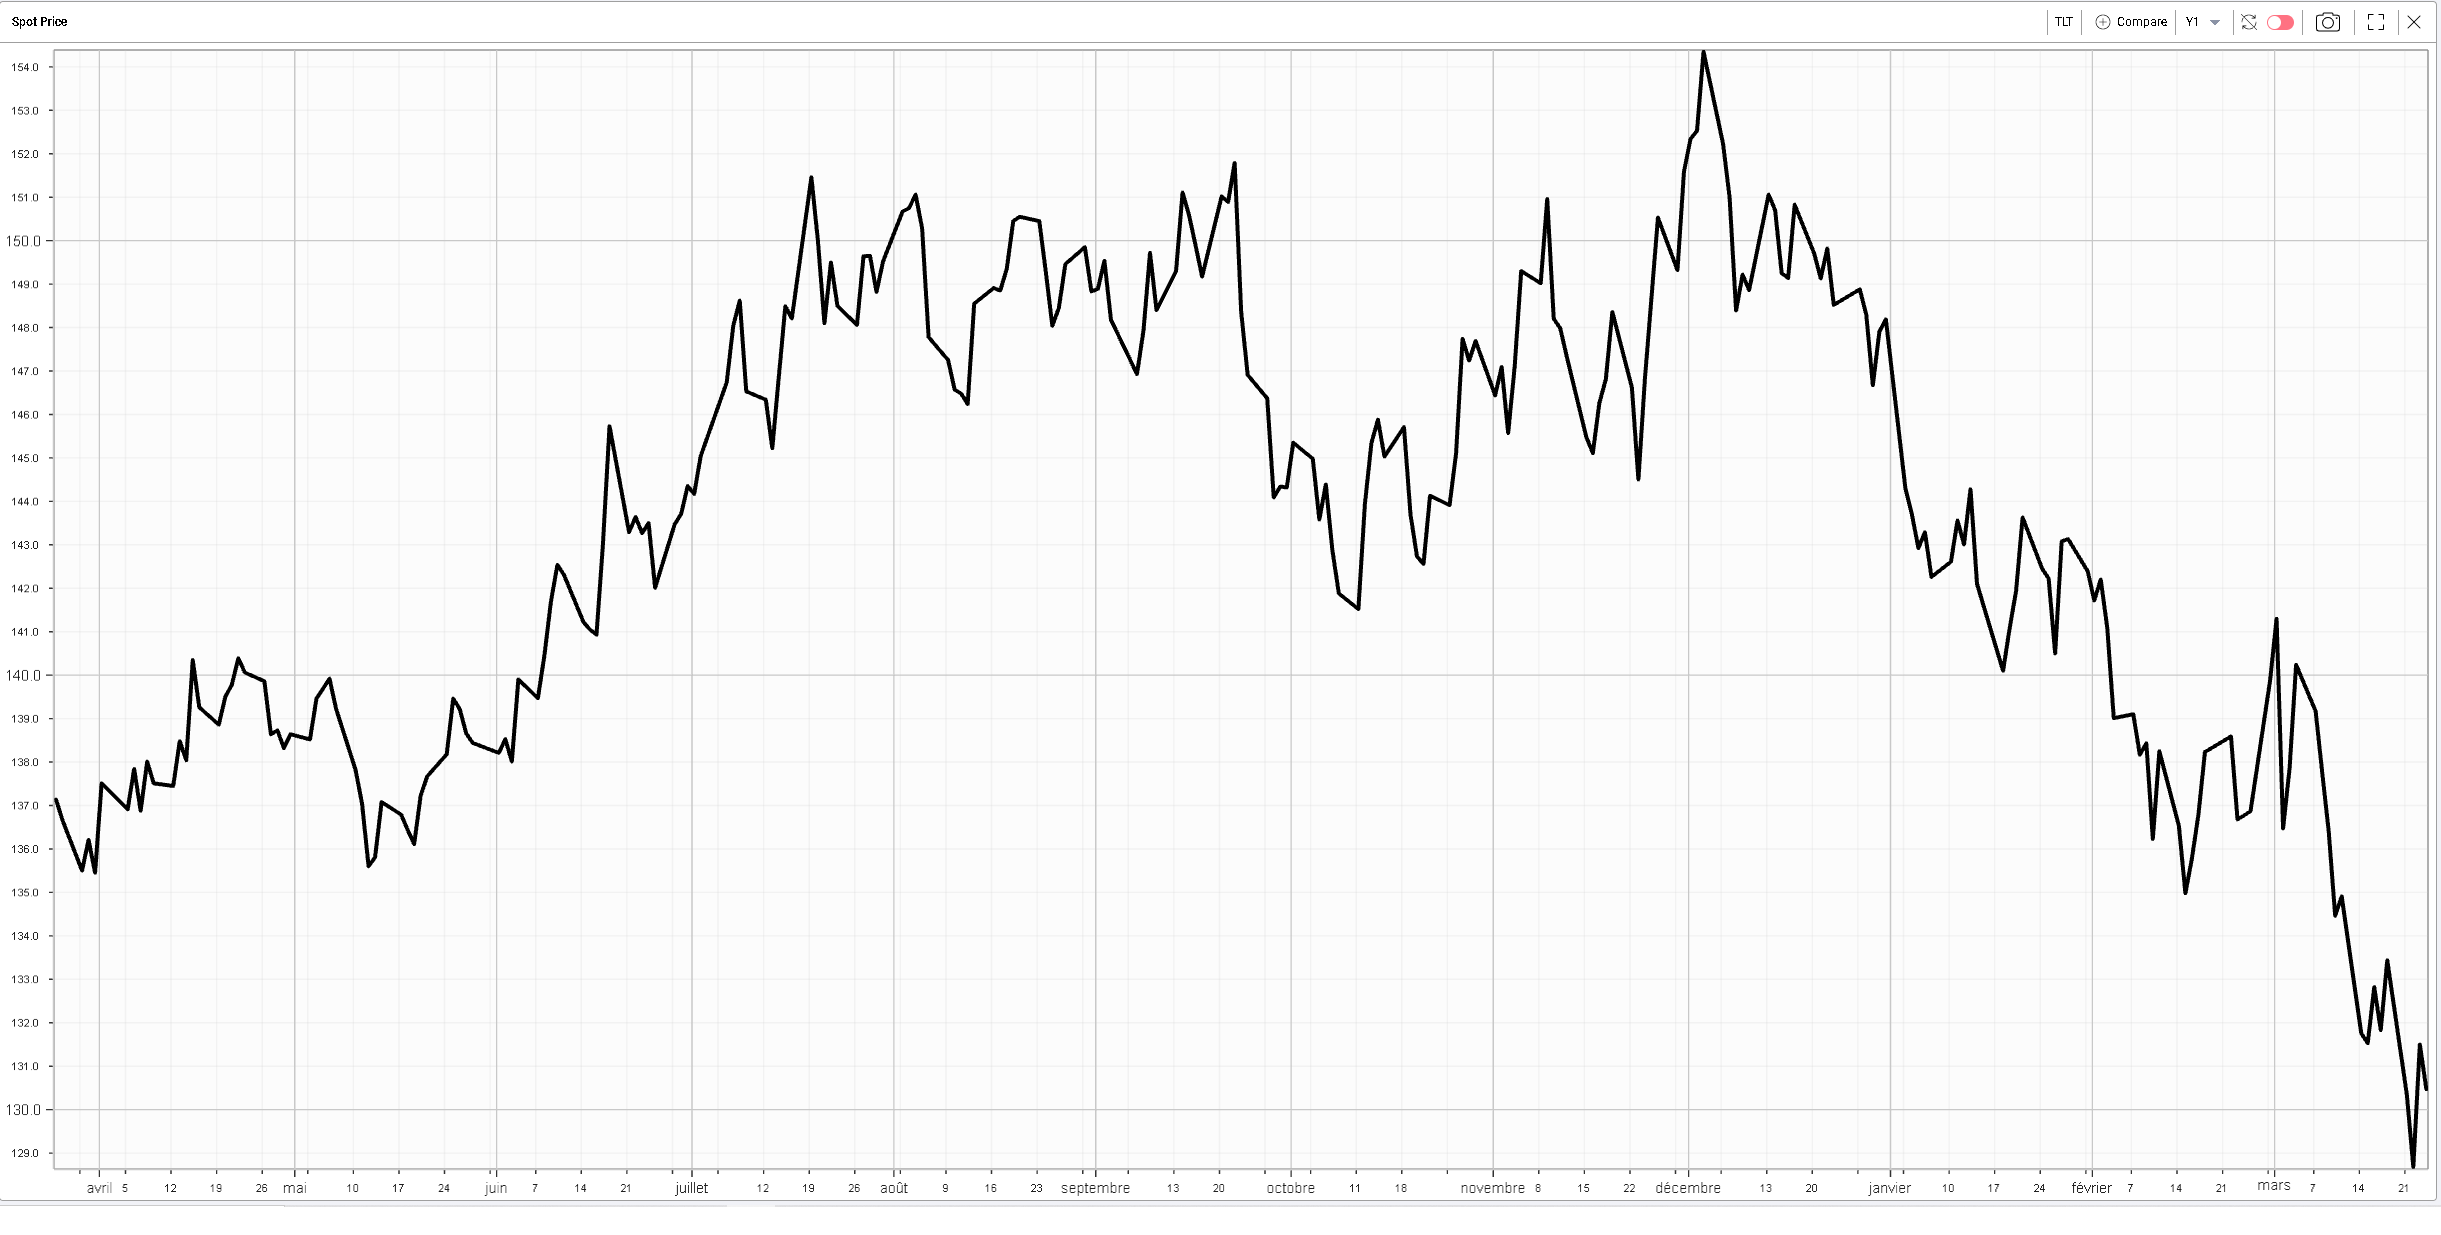
Looking at the ETF market, we can see that TLT continues to trade around its recent lows. 10 years yields are around 2.37% at the moment, a very important indicator to keep watching in the current environment. |
|
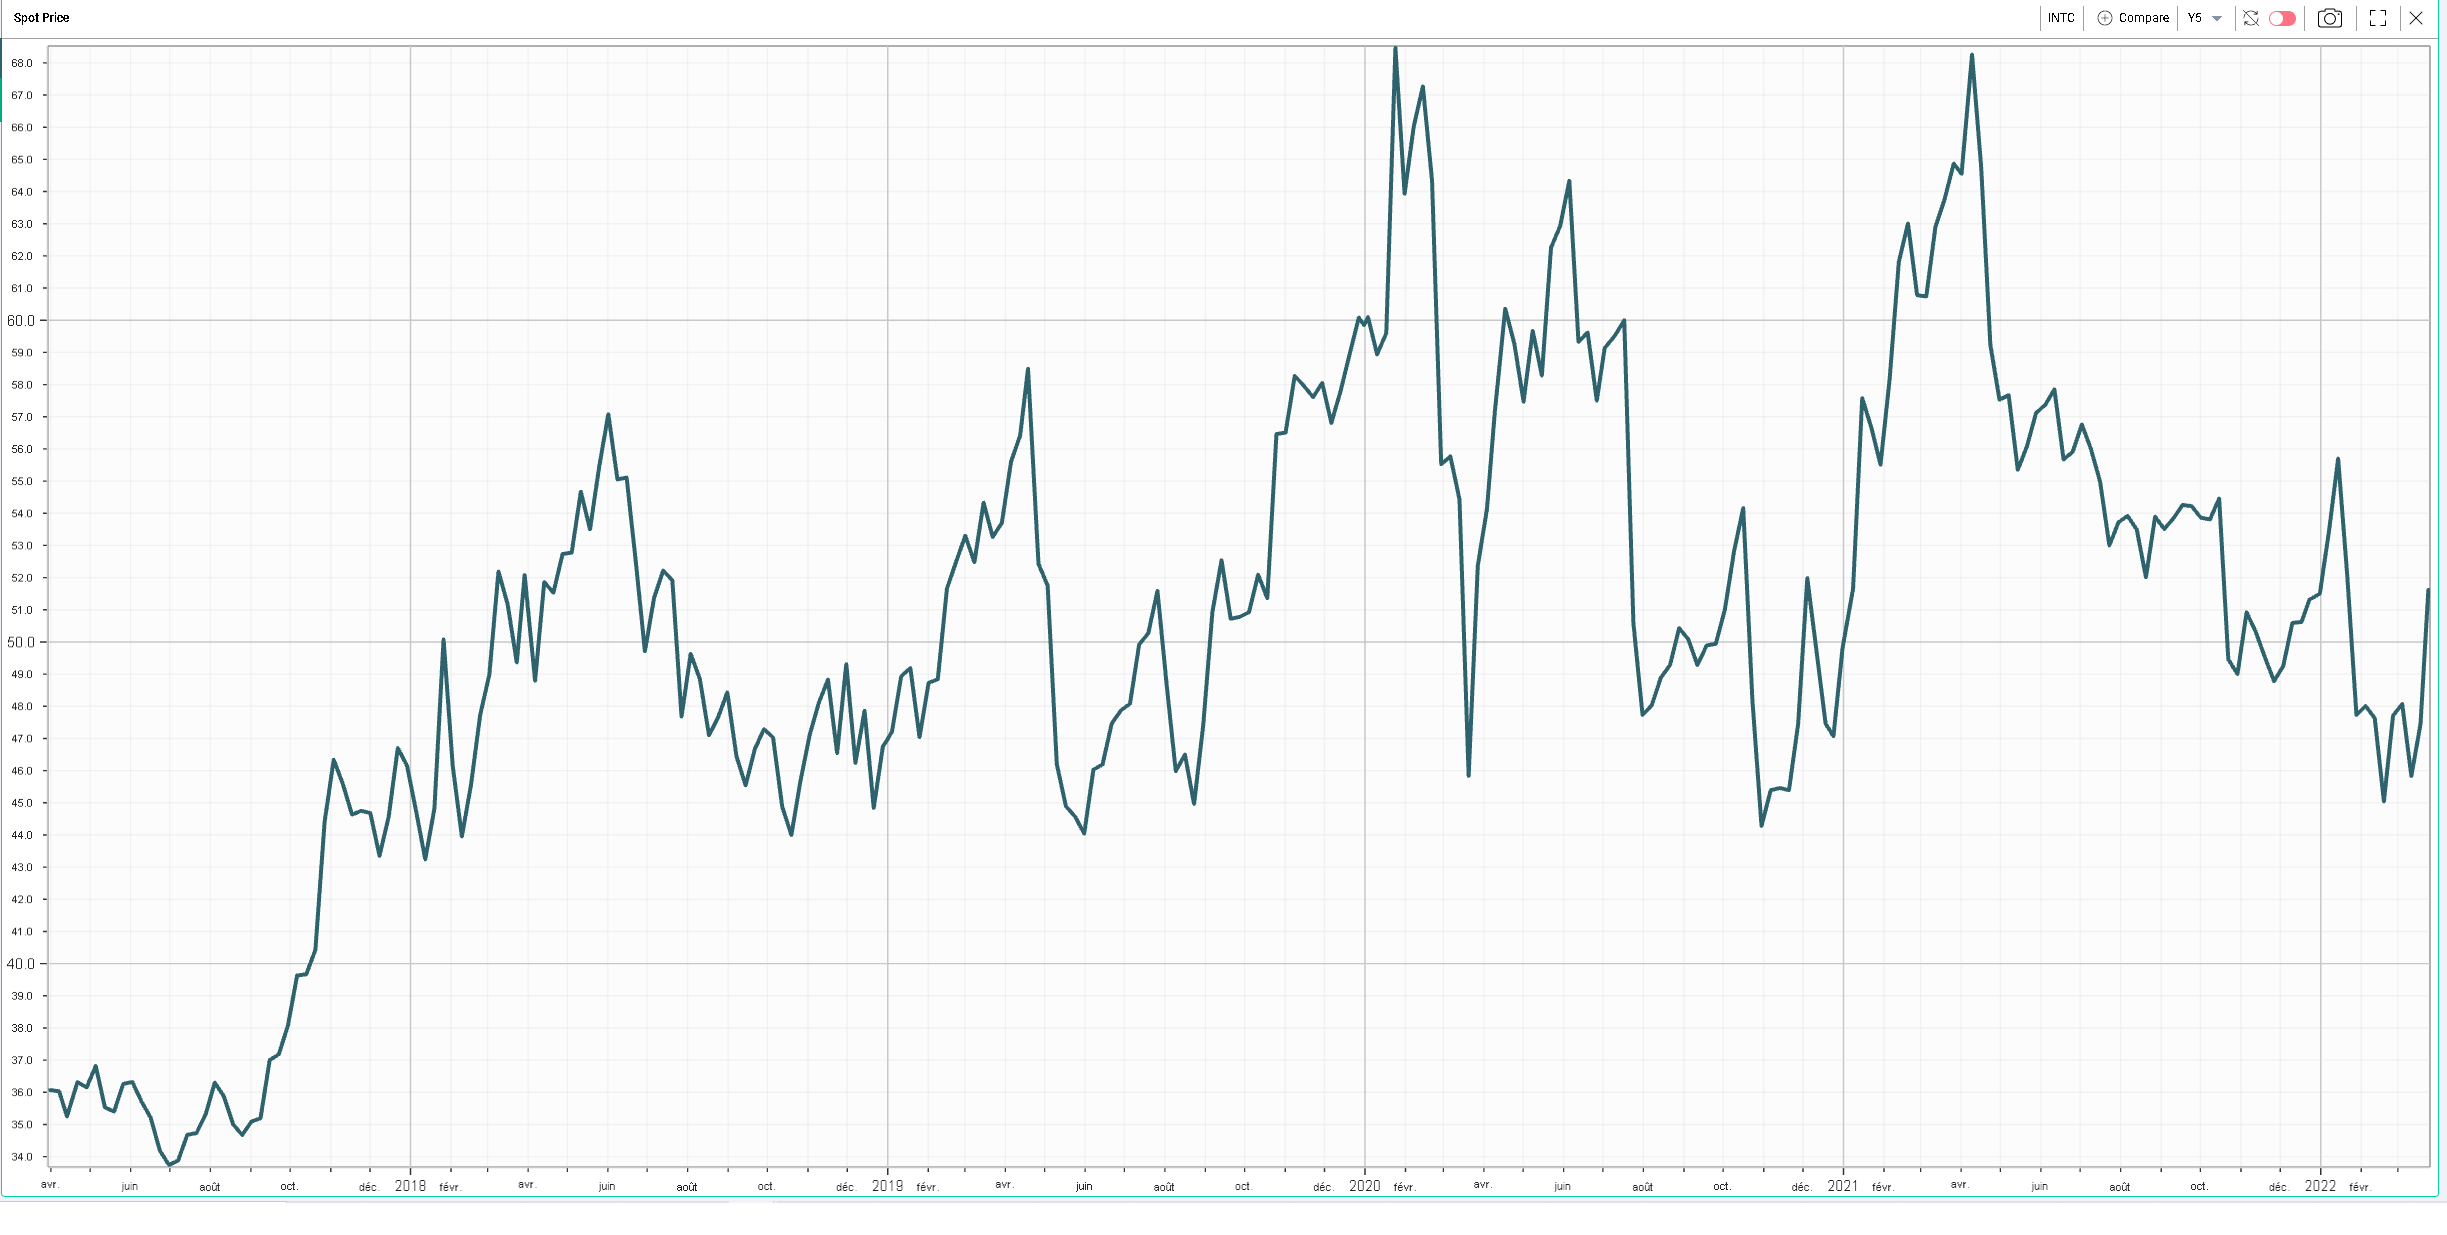
At the single stock level, INTC was the best mover within the DJX closing almost 7% higher on the day. NVDA also had a pretty strong day up almost 10%. |
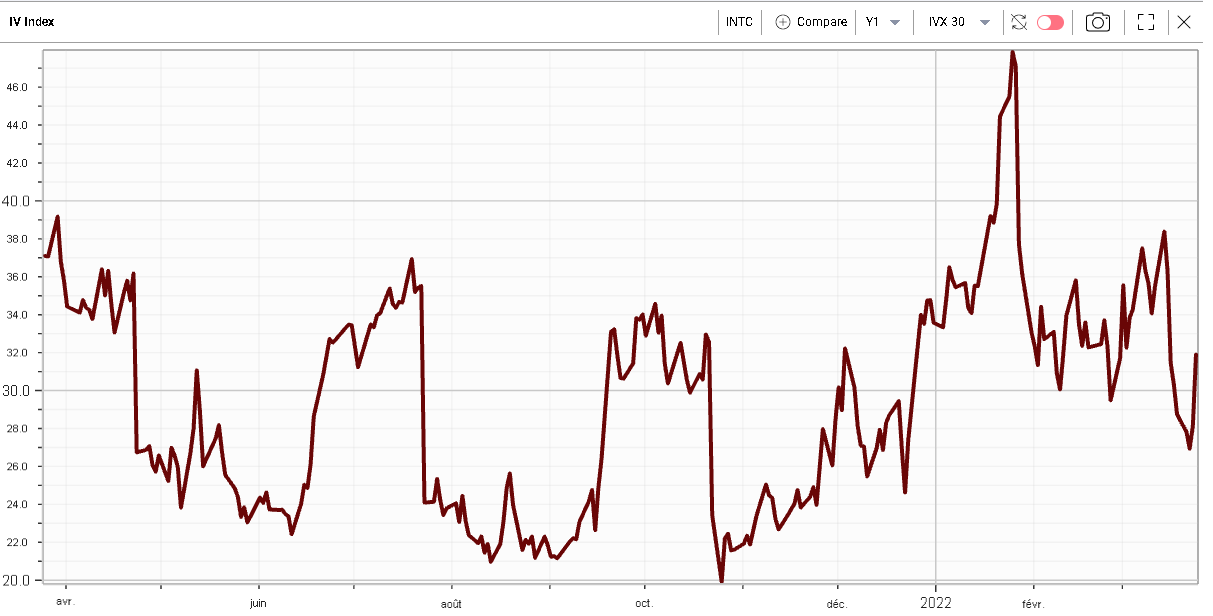
We highlighted in a recent market update that some of those names had hardly participated in the recent market bounce, as was the case for INTC. |
|
Interestingly yesterday was one of those spot up, volatility up day for INTC. |
|
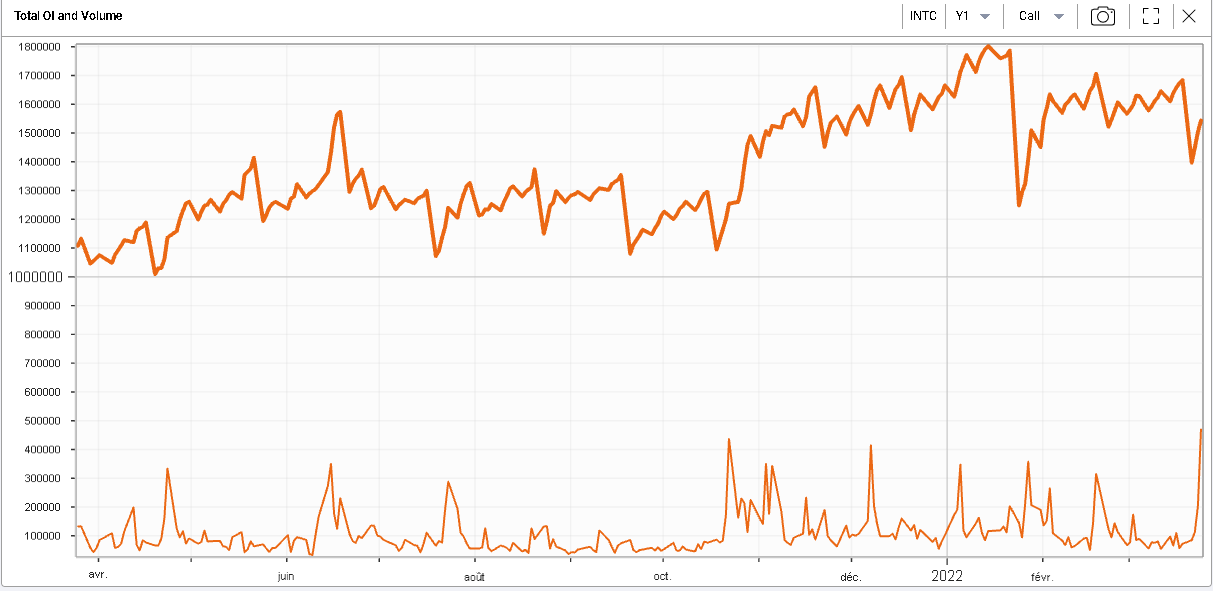
The chart below shows the open interest for INTC calls in bold over the last 12 months while the lower line shows the daily volume. The large amount of call trading that took place yesterday is quite visible on the bottom part of the chart. |
|
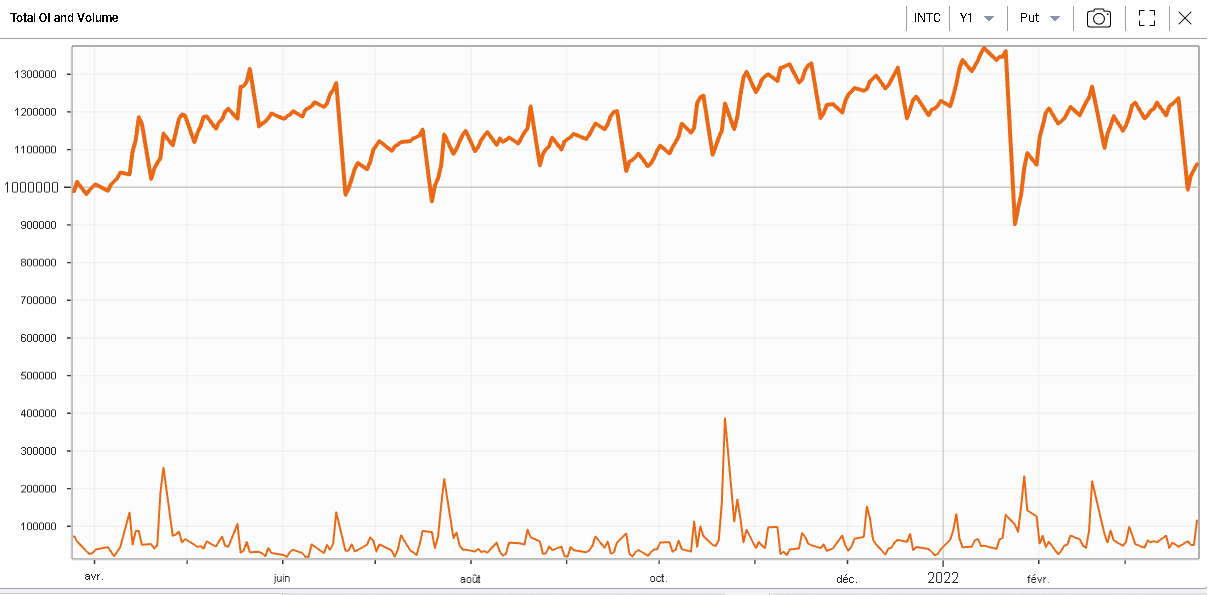
This price action is an interesting indication that traders may be gearing up for further upside in INTC by buying calls. Looking at puts on the chart below, we can see that traders were far less active in those. |
|
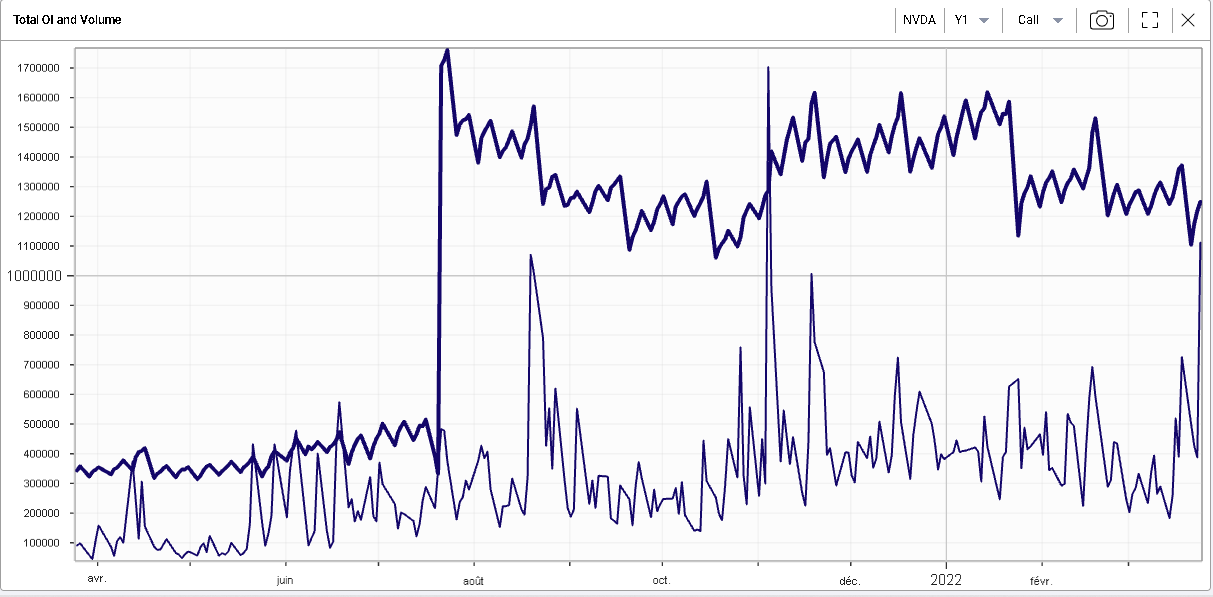
The same setup can be observed in NVDA with significant Call volume on the day yesterday. |
|
Those two names will be very interesting to watch over the next few sessions in order to assess if this move has legs or not. Watching the volume and how the open interest evolves is also highly useful to appreciate if traders seem to be adding to their positions or rather reducing them. |
Disclaimer - This information is provided for general information and marketing purposes only. The content of the presentation does not constitute investment advice or a recommendation. IVolatility.com and its partners do not guarantee that this information is error free. The data shown in this presentation are not necessarily real time data. IVolatility.com and its partners will not be liable for any loss or damage, including without limitation, any loss of profit, which may arise directly or indirectly from the use or reliance on the information. When trading, you should consider whether you can afford to take the high risk of losing your money. You should not make decisions that are only based on the information provided in this video. Please be aware that information and research based on historical data or performance do not guarantee future performance or results. Past performance is not necessarily indicative of future results, and any person acting on this information does so entirely at their own risk. |