Is inflation good or bad for stocks? |
While equity markets were relatively quiet on Friday with the SPX up 0.5% and the NDX unchanged, the Fixed Income market painted a very different story. |
In the US, the 2-year yield rose more 13bps while the 10-year yield was up about 12 bps. Those are significant moves happening after an already very quick and aggressive repricing by markets since the end of 2021. Let us take a moment to remember that towards the end of 2021, the 2-year yield was trading around 0.75% while the 10-year was at 1.5%. |
The FED initially failed to see that inflation would not be transitory and that some effects might actually last through time. The CPI print for February at 7.9% was the highest since 1982. Energy has obviously been playing a large role in the inflation increase and many professional forecasters were expecting oil prices to subside after the strong bounce seen in 2021 as the global economy recovered from the pandemic. Front-month oil Futures reached $85 in November of last year and were already contributing significantly to the higher inflation numbers seen across the world and in the US. The spike seen in 2022 on the back of the conflict in Ukraine has thus added to an already very inflationary situation for the energy sector. |
This phenomenon has been seen across many commodities. For instance, Wheat Futures were up about 40% in 2021 and have since the start of 2022 risen another 40%. |
As a result, we have quickly shifted from a scenario where policy makers were expecting some of the inflation spikes seen in 2021 to be transitory and be linked solely to the reopening of the economy to one where those effects are staying for longer and even accelerating. They had postulated that, while current inflation was above their target, they had sufficient reasons to believe that things would normalize once the excess consumption by households would slow down. |
Another key factor in 2021 that explained the input price inflation was the lack of supply for some key components. This shortage, in particular for some microchips was also expected to normalize towards the end of 2021 but the sanctions imposed on and by Russia have impacted trade routes. |
As a result, demand remains very elevated for now but supply is becoming more and more constrained. Investments are being made but will take some time before they can produce the desired effect. Basic economics dictate that price must go up and that is what we have seen over the past months. |
Against this backdrop, an important question is to understand what role the FED and other Central Banks are able to play. Central Banks primary transmission mechanism is to impact demand. When a Central Bank sees that demand is slowing, it can reduce rates in order to make it cheaper for buyers to step in and increase demand with easier financial conditions. A more recent transmission mechanism in the form of QE consists in forcing investors up the risk curve by reducing the pool of risk-free assets available. All try to aim at boosting demand. |
If in some cases the FED can play a very significant side on the demand side of the equation, it is not evident that it can impact supply by much. This observation has been raised by many market participants recently that have been asking if the only solution for the FED was not to destroy demand in order to control prices. In other words, some have argued that the FED may have to engineer a recession in order to ensure that inflation does not run out of control. |
The recent FOMC meeting as well as the verbal intervention by FED members over the past few weeks have reinforced that sentiment. Many professional forecasters are now calling for back-to-back hikes of 50bps over the next few FOMC meetings, a phenomenon that explains the significant repricing of the entire US rate curve over the past few weeks. On the 8th Mar’22 the 2-year US yield settled around 1.5%, it has since risen by ¾ of a percentage point. |
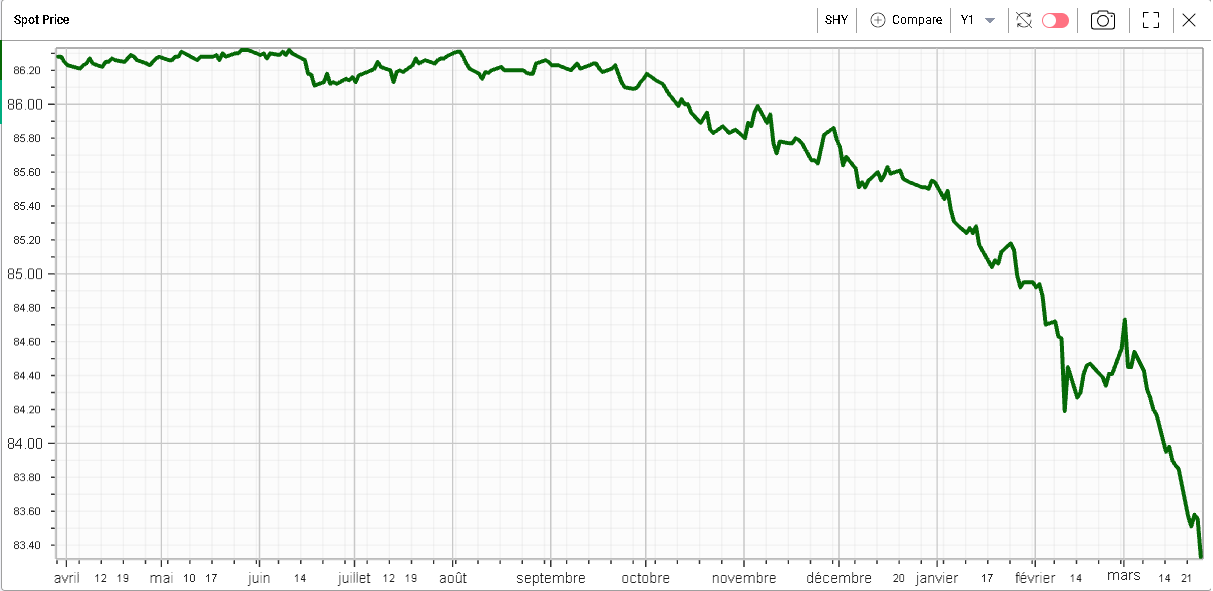
Looking at the SHY ETF (iShares 1-3 Year Treasury Bond), we can see the violent selloff that has taken place in 2022. |
|
One of the main questions that traders are asking themselves at the moment is to figure out how equities should react in such an environment. |
On the one hand, the example from the 70s is a stark reminder of how sanguine markets can be when inflation unexpectedly rises. In 1972, inflation was around 3%. It rose to 6% in 1973 and 11% in 1974. The performance of the SPX from 1972 to 1974 was about -40%. |
It is entirely possible this time around that the answer will be company specific. Some businesses will be able to weather an increase in wages and input prices and will manage to pass those onto their customers preserving margins. Others, particularly in highly competitive sectors will see their margins compress. |
As the FED continues to raise interest rates, one could also expect a divergence between companies that are able to generate significant amounts of cash that will now benefit from higher interest rates and other companies that rely on significant borrowings for their day-to-day operations will find this period very uncomfortable. |
Knowing the stocks that you trade, understanding their businesses may turn out to be more important than at any point in time over the past few years. |
|
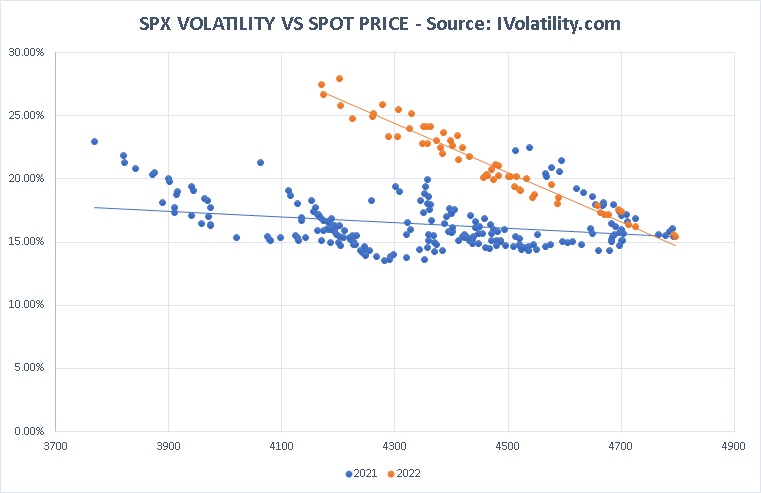
If the debate on the overall impact of the inflation spike is still open, it seems clear for now that traders agree that the uncertainty has risen meaningfully. On the chart above, we show in blue the 90-day IVX plotted against the spot level for each day. We track this data over the past 12 months. |
We can see in orange the 2022 portion of the data and in blue the 2021 portion of the data. Volatility has shifted higher pretty much for all spot prices and looking at the area from 4600 to 4800, we can see that this actually started back around December of last year. |
This greater level of uncertainty about the next few months is probably warranted but will make outright long volatility structures less attractive should the market fail to realize in line with those elevated expectations. |
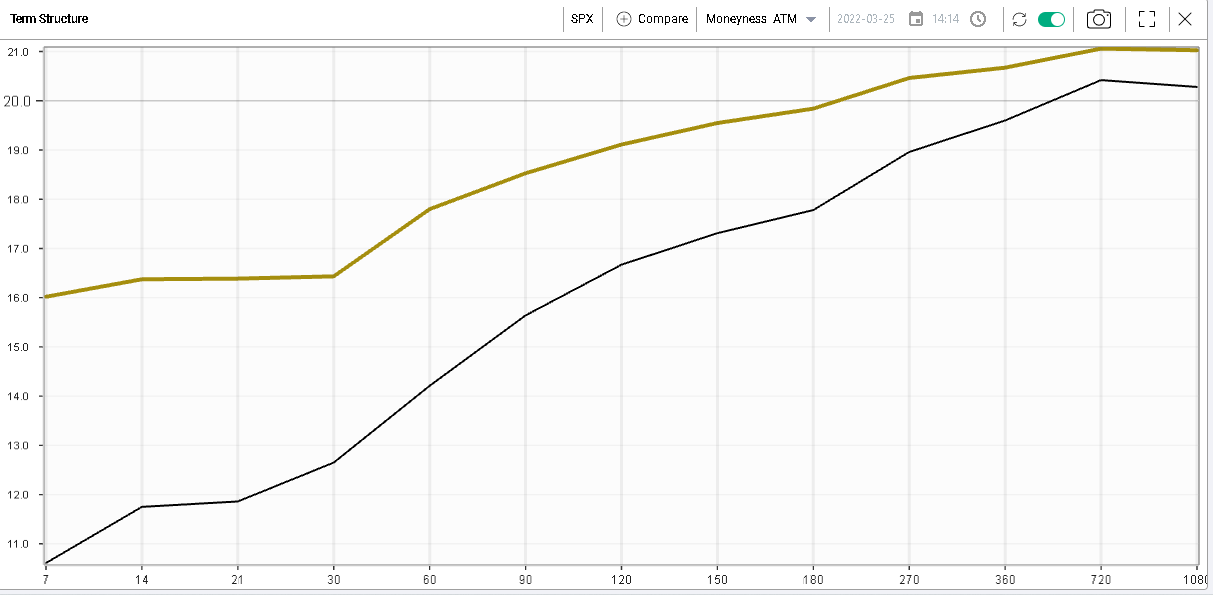
Looking at the SPX term structure and comparing Friday’s closing levels with the levels on the 31st Dec’21, we can see the parallel shift across the entire term structure with the front-end most impacted. |
|
Using tools like the RT Spread Scanner will help traders understand their exposures and scan for structures with lower risk profiles in the context of a more uncertain trading environment. |
The Market Update is a daily newsletter written by the team at iVolatility.com. Leveraging our analytics and data we are able to update you on key developments in the volatility market. To receive the Market Update directly into your inbox, please open a free account or visit our SITE where it is published every day. |
Disclaimer - This information is provided for general information and marketing purposes only. The content of the presentation does not constitute investment advice or a recommendation. IVolatility.com and its partners do not guarantee that this information is error free. The data shown in this presentation are not necessarily real time data. IVolatility.com and its partners will not be liable for any loss or damage, including without limitation, any loss of profit, which may arise directly or indirectly from the use or reliance on the information. When trading, you should consider whether you can afford to take the high risk of losing your money. You should not make decisions that are only based on the information provided in this video. Please be aware that information and research based on historical data or performance do not guarantee future performance or results. Past performance is not necessarily indicative of future results, and any person acting on this information does so entirely at their own risk. |