Analyzing an options potential trade on TSLA |
The NDX continued its advance yesterday with TSLA closing about 8% higher. The move was said to be driven by the announcement that the company was seeking to perform a stock split making it potentially accessible to more retail investors. |
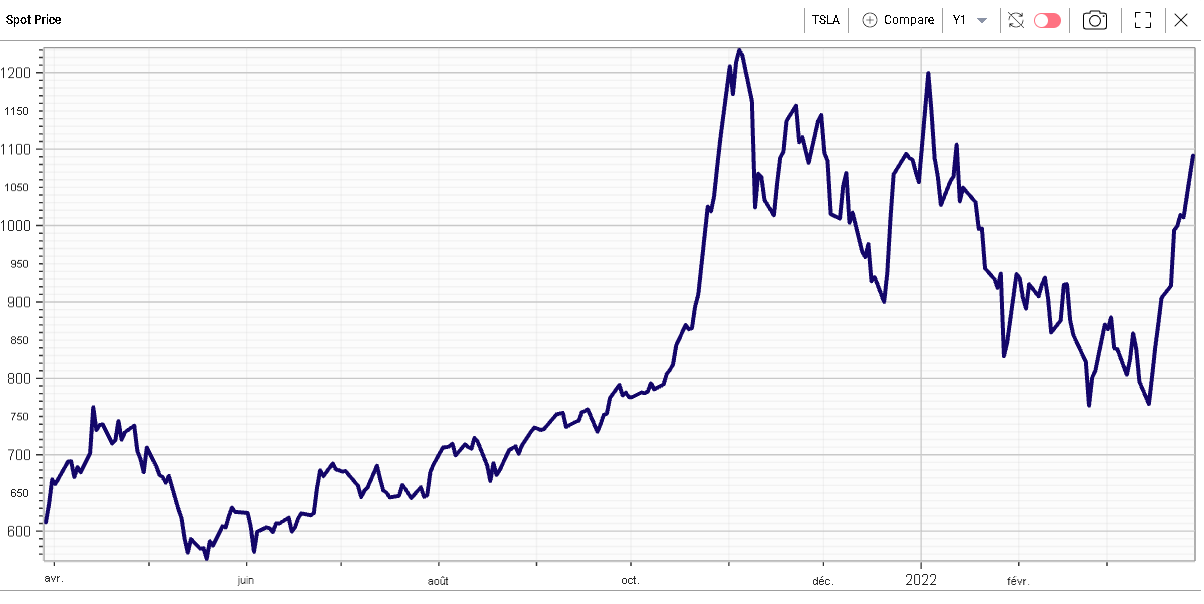
Whilst the stock is fast approaching its 12 months highs around $1,230, the activity on the call side looks very muted in relation to what was previously seen in the name. |
TSLA Stock Price – Last 12 months |
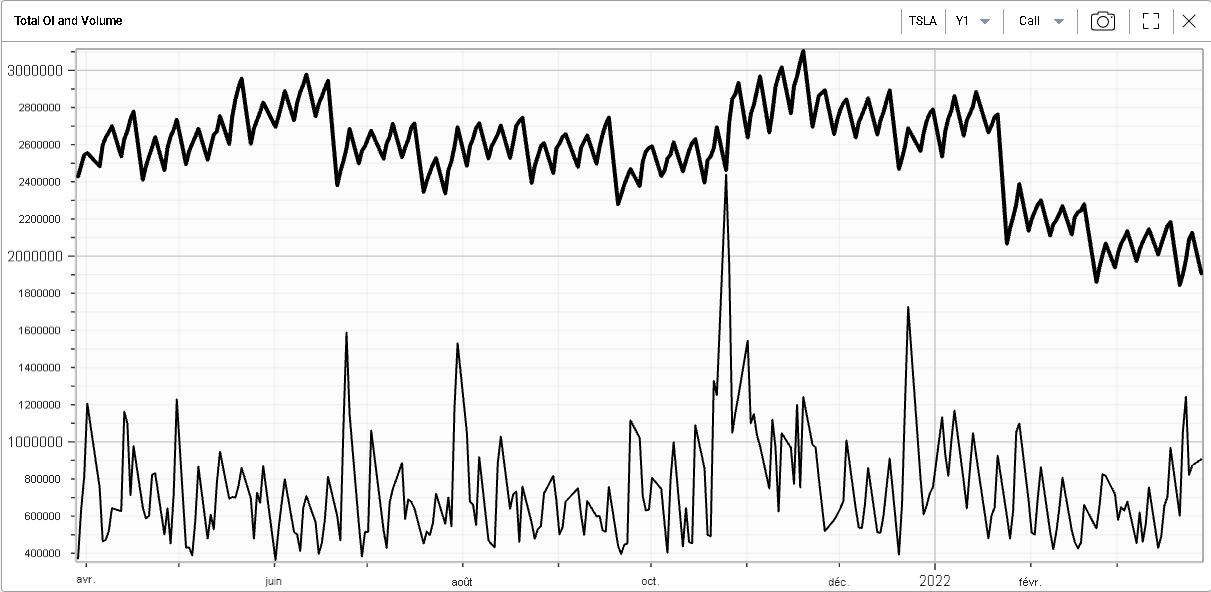
The bold line below shows the outstanding call open interest in TSLA being around its 12 months lows. |
TSLA Call Open Interest – Last 12 months |
Volumes have indeed picked up slightly but a decent portion of those seem linked to at least some form of profit taking. |
Could this mean that traders who are long this name are keener to take profits now having sustained a 37% drop from its previous highs. This is very plausible. It is also possible that traders have stopped using options and focus more on shares. |
In that case, it may also be interesting to look at structures that reduce the overall risk carried by traders and allow them to lock some profits as their prediction start to materialize. |
Vertical Spreads can fit into that category as they give an initial exposure in the desired direction but also automatically reduce that exposure as the upper strike is approached. |
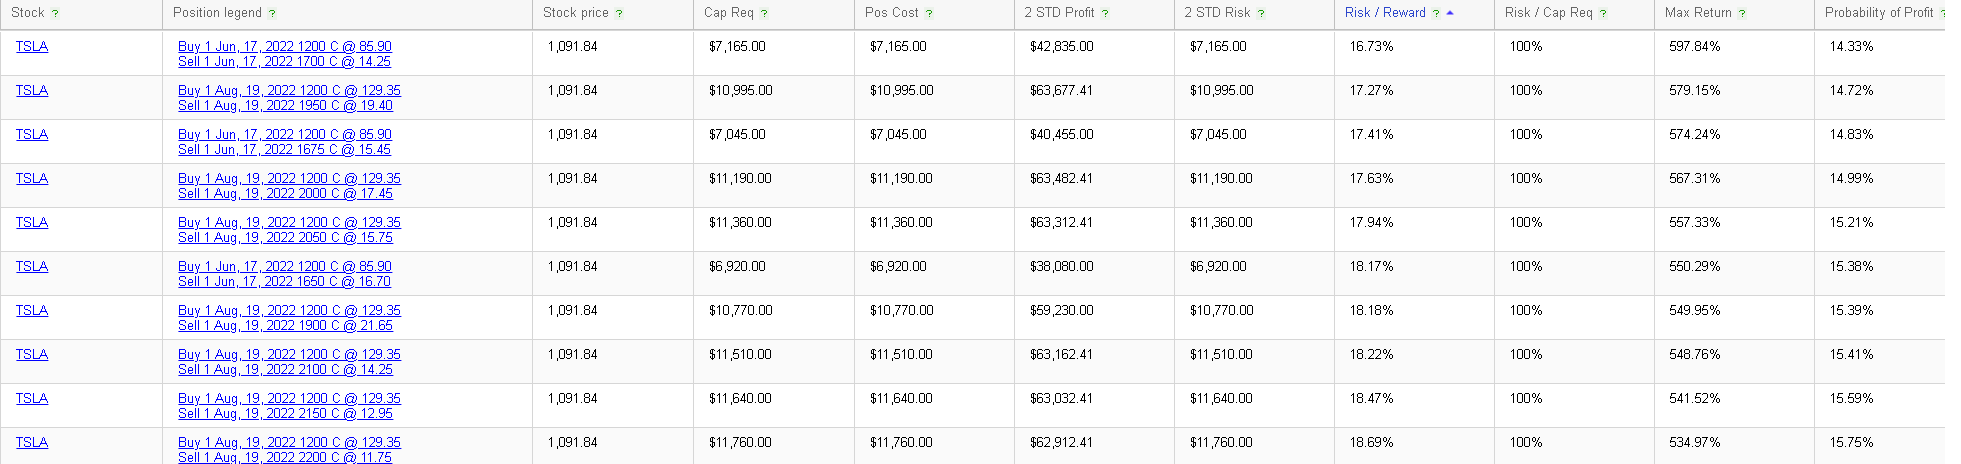
Using the RT Spread Scanner, we can look for the most attractive bull spreads (from a risk/reward perspective) in TSLA. We are looking for mid-term investments (from Jun’22 to Aug’22) with a long strike that is no further than 10% from the current spot level. |
|
Looking at the first structure, the Jun’22 1200/1700 Bull vertical spread, we can see that the total cost of the structure is $7,165 and the 2 standard deviation profit is $42,835. This gives a Risk to Reward ratio of around 17%. In other words, the trader stands to lose 17c for each $1 of gain he can potentially make based on the above calculations. |
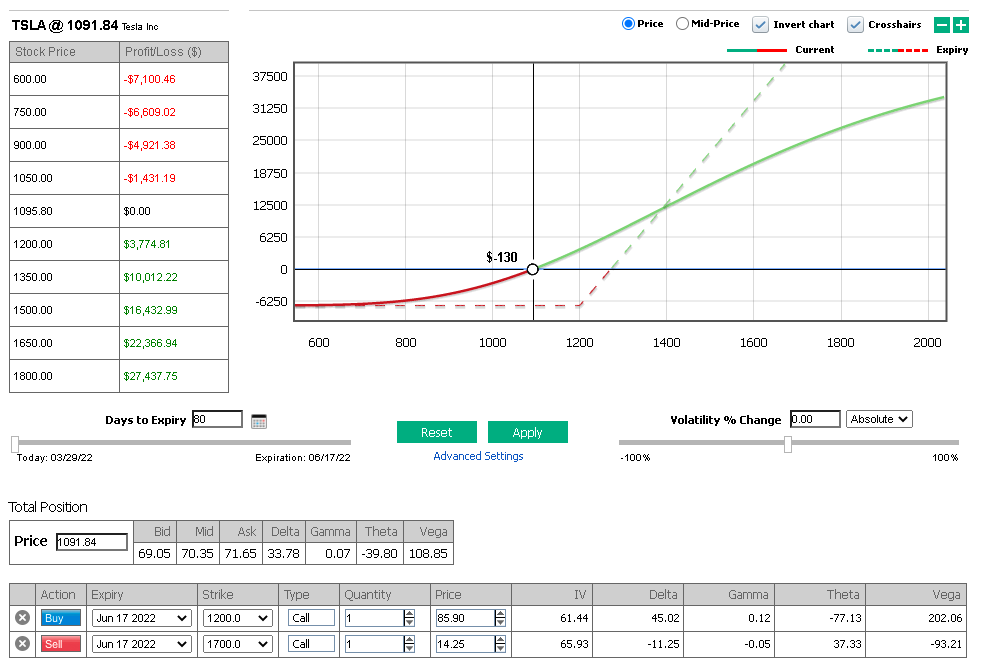
In order to better understand how this structure will behave, we can use the PnL Calculator, a tool designed to simulate the changes in value of our structure for various assumptions. This is one of the best tools available for traders looking to perform their what-if scenario analysis. |
|
Looking at the structure in more details, we can see that at inception it has a delta of 33.78, in other words, owning that structure is equivalent to owning almost 34 shares. |
Let us imagine that a trader wants to own 100 shares of TSLA. He could either buy 3 of those structures or buy 100 shares. Buying 3x the structure would cost 3 x $7,165 = $21,495. This is equivalent to a move of around $215 on the 100 shares that act as its benchmark. |
In essence, if the trader buys the 3 bull vertical spreads and the stock goes down more than $215 by expiry, it will have proved to be more attractive to own than owning the outright shares (assuming he held and did nothing between today and the expiration). |
If the stock stays unchanged, then the shares would have been far more interesting as the trader would lose the entire premium. |
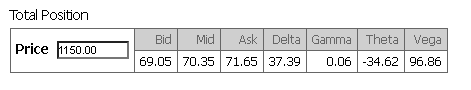
If the shares were to go higher, then the delta of the trader would increase. For instance, if the shares went up to $1,150, the delta would increase to 37.39. |
|
Embedded within that option structure, there are two mechanisms that would allow the trader to reduce its exposure as the stock starts to move in his direction. |
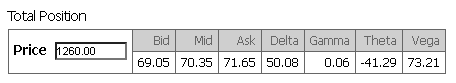
First, the increase in delta would allow him after some upside has been realized to reduce its overall position. For instance, let us imagine that in a month, the stock has reached $1,260 and everything else has remained constant. |
Using the spot change simulator, we find the below exposure for the structure: |
|
The structure’s delta has gone from its initial 33.78 to 50.08. This means that the trader, having bought 3x the structure now carries the equivalent of 150 shares. As he benchmarked himself against a long 100 shares, he can reduce its position by the equivalent of 50 shares or 1 spread. |
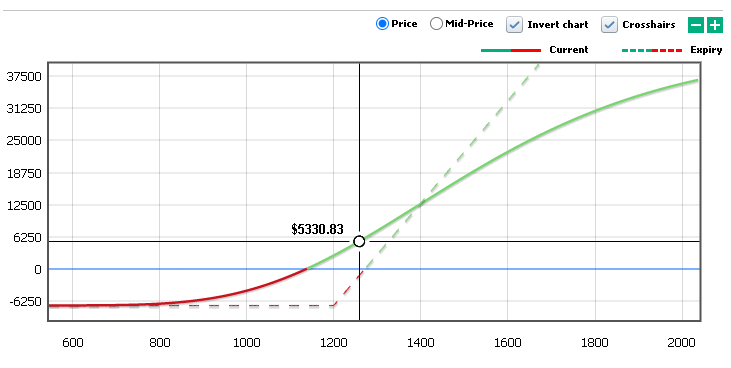
The trader is allowed to take some chips off the table while keeping the same initial exposure. |
Looking at the new chart generated, we can see that the trader would have realized a profit of $5,330.83 over that move. In other words, his total premium would now become $21,495 + 3 x $5330.83 = $37,488 or about $12,496 per structure. Selling out one of those bull vertical spreads, allows the trader to reduce the maximum loss to $37488-$12496= $24992. |
|
The second effect by which the trader’s position will automatically be reduced is the presence of a short strike on the upside, specifically the $1,700 call here. |
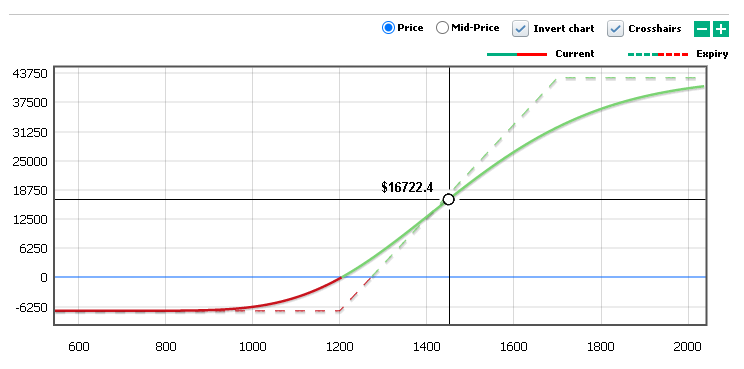
Looking at the structure with 20 days to expiration and a spot price of $1,450, we can find the below graph from the PnL Calculator: |
|
If we focus on the dotted line which represents the profit and loss at expiration, we can see that as the strike gets to the upper strike at $1,700, we no longer participate in the upside. Above that level, the long and short call neutralize themselves and the position acts as flat. |
For traders who have developed strong technical analysis skills, they will undoubtably be able to locate levels where they think the stocks’ advance will stall. Those levels will make for good candidates for upside strikes to sell against a long call position in order to reduce automatically their exposure once they reach that level and reduce the overall cost of the structure. |
This example serves to highlight that it is possible with options to fine tune the position that you carry to your specific view. This is one of the advantages of the product and the PnL Calculator is here to help you understand the risks you are taking for each of your positions and compare them with alternative positions such as outright calls or even buying stocks. |
The Market Update is a daily newsletter written by the team at iVolatility.com. Leveraging our analytics and data we are able to update you on key developments in the volatility market. To receive the Market Update directly into your inbox, please open a free account or visit our SITE where it is published every day. |
Disclaimer - This information is provided for general information and marketing purposes only. The content of the presentation does not constitute investment advice or a recommendation. IVolatility.com and its partners do not guarantee that this information is error free. The data shown in this presentation are not necessarily real time data. IVolatility.com and its partners will not be liable for any loss or damage, including without limitation, any loss of profit, which may arise directly or indirectly from the use or reliance on the information. When trading, you should consider whether you can afford to take the high risk of losing your money. You should not make decisions that are only based on the information provided in this video. Please be aware that information and research based on historical data or performance do not guarantee future performance or results. Past performance is not necessarily indicative of future results, and any person acting on this information does so entirely at their own risk. |