What is going on in GameStop? |
At the beginning of 2021, GameStop jumped from around $20 to $325 during January in one of the most spectacular moves seen in the market. Options in the name were already difficult to trade and priced at around 100% implied volatility towards the end of 2020 but the sudden spike in spot saw traders scramble to build option positions pushing the implied volatility above 500%. |
After the initial collapse from the highs, the stock hovered between $150 and $300 for the best part of 2021 before breaking lower in 2022. Since the middle of March, the stock has started to move aggressively higher rising by more than 100% in 7 trading session. |
This has remained relatively quiet for now outside of the communities that are heavily invested in the name and we will use today’s market update to look at the moves we are currently seeing in light of what was seen back in January 2021. |
First, let us recap yesterday’s trading session. Major US indices finished the day lower, with the SPX closing 0.6% lower, the NDX finishing down 1.1% and the DJIA closing 0.2% lower. |
Implied volatilities moved higher and our 30d IVX measure was 1 point higher for the SPX and the NDX and pretty much unchanged for the DJIA. |
Stocks performance was pretty muted with all DJIA components finishing between -3% (CRM / HD) and +2% (UNH / WMT). At the sector level, energy and utilities were bought while consumer discretionary and technology were sold. |
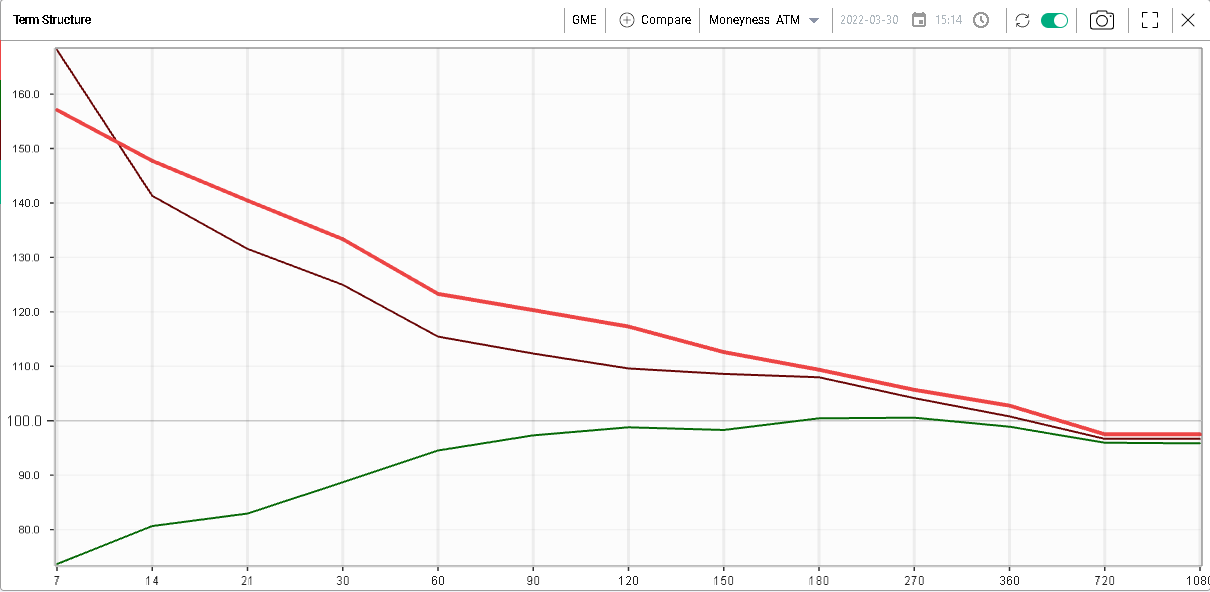
Back to GME and let us first look at the current implied volatility for the name. As shown below, the term structure remains inverted today. The bold red line shows the term structure for IVX as of yesterday’s close, the purple line shows the same term structure as of the recent lows in the market reached on the 14th Mar’22 and the green line shows the term structure at the end of 2021. |
|
Implied volatility at the same level as where it was back on the 14th Mar’22 could be a sign that market makers are expecting the more elevated vol regime that has prevailed recently to continue. |
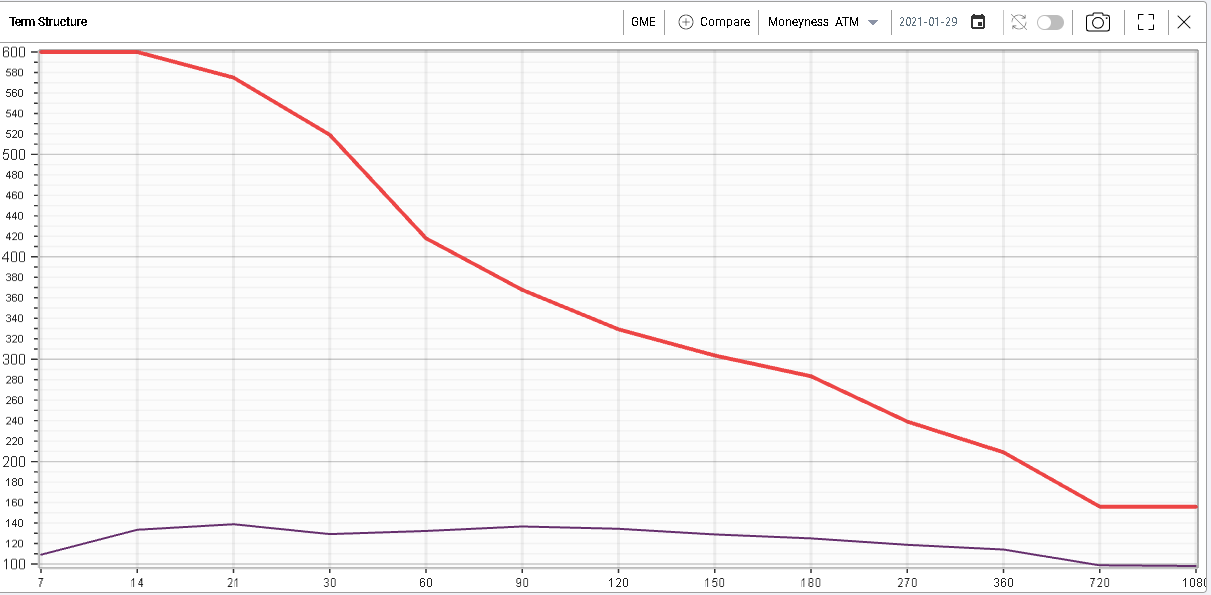
Looking at the shape of the curve at the end of 2020 and as of the 29th Jan’21 which was the highest close in the stock, we can see that the shape was showing the same inversion as today but the levels were far greater. |
|
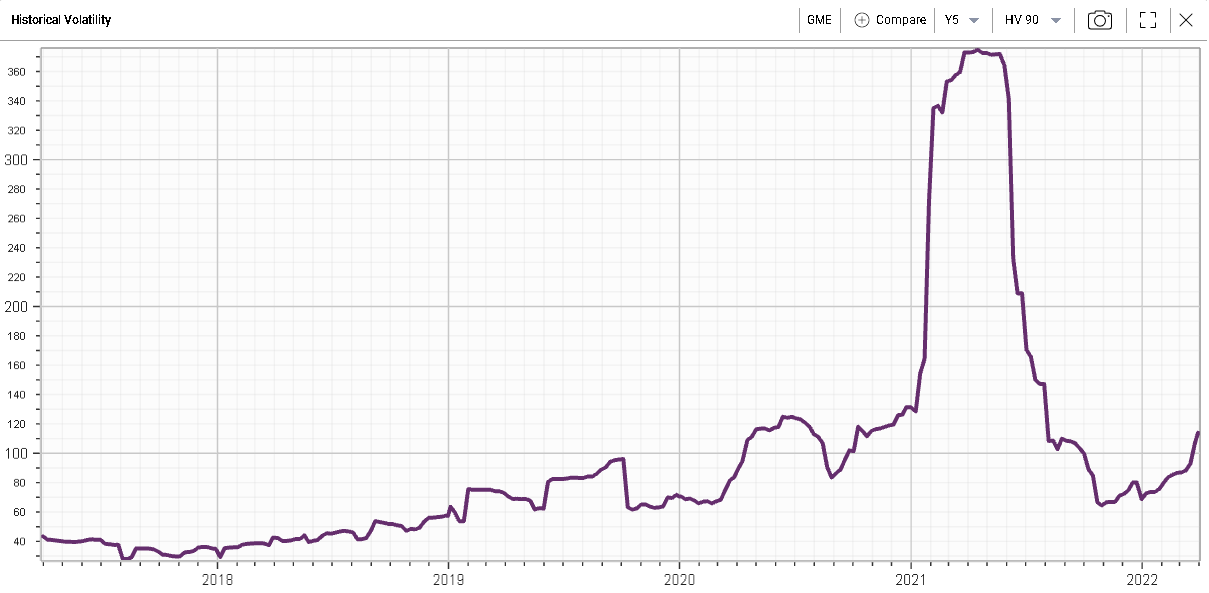
Looking at 90 days realized volatility, it has dropped significantly from the highs reached above 360% annualized and is now printing around 115%. After the initial spike up in volatility, realized vols reached a bottom towards the end of 2021 before starting to expand again. Note that after the spike in Q1-2021, the 90d HV never printed below 65%. |
|
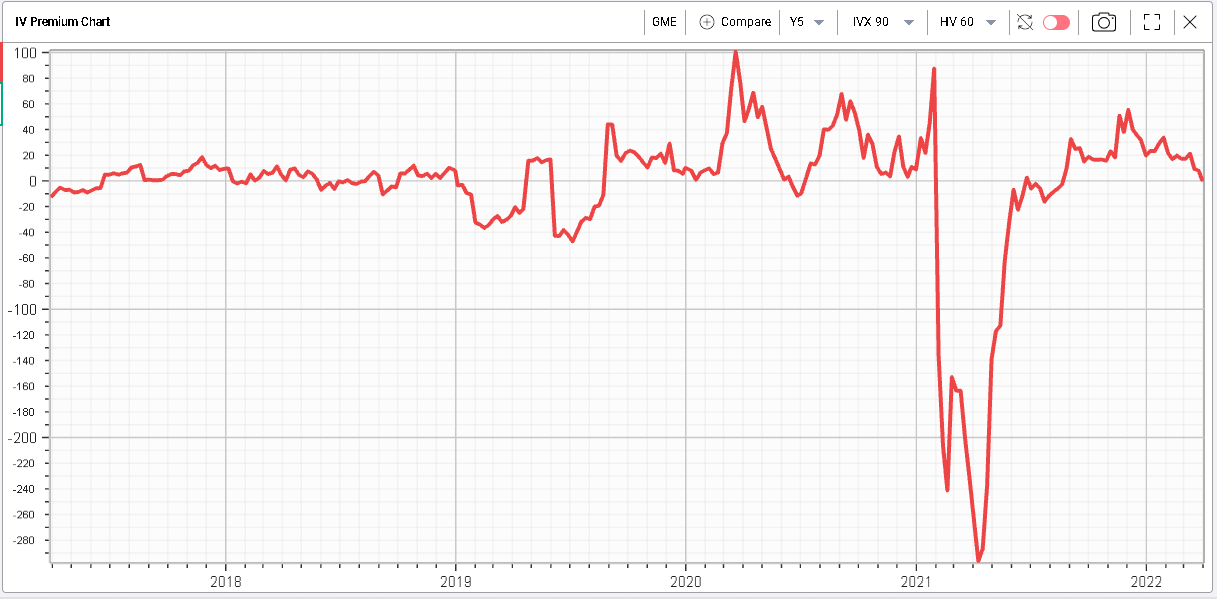
What does this mean for the real expensiveness of implied volatility in GME? Using the IV Premium chart over the past 5 years comparing IVX 90 with HV60 we get the following: |
|
In other words, the 90 days implied volatility is trading around flat to the realized volatility over the last 60 days. This could be seen as a sign that the pressure from volatility buyers for now is not very elevated and not impacting the curves that much. |
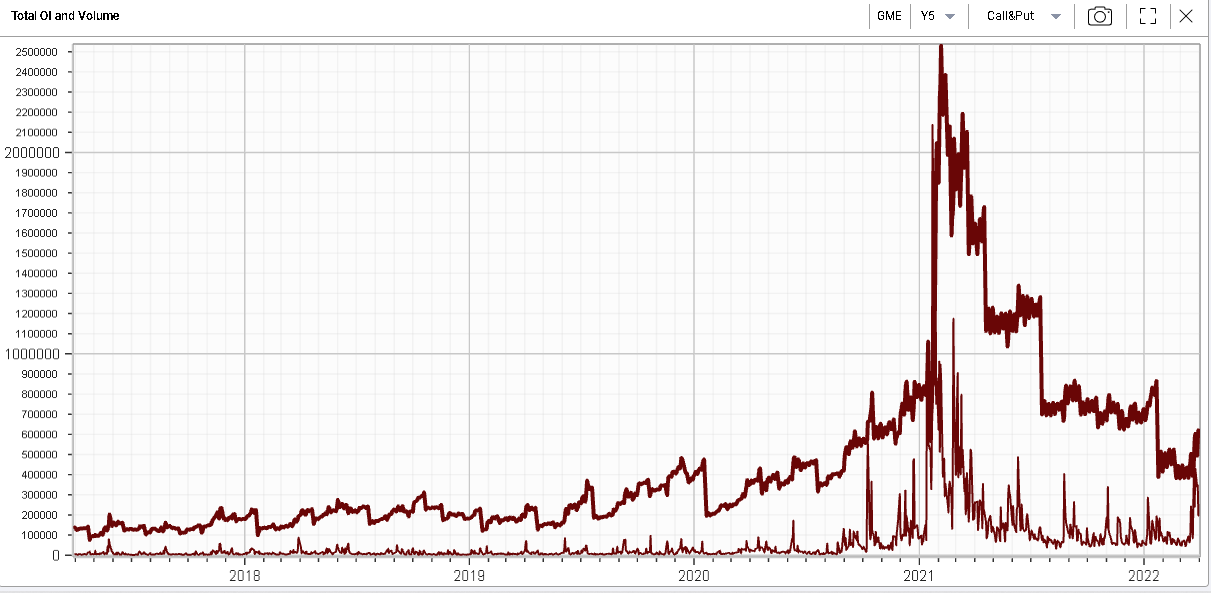
One important factor during the initial squeeze in GME was the extraordinary elevated level of calls that were being bought in the name. That mechanism allowed traders to achieve (initially) great levels of leverage to express their bullish sentiment. |
The chart below shows the 5 years Total Open Interest in bold and the Options volume underneath. |
|
This is probably the most telling chart when it comes to comparing the current move with what happened historically. Volumes have increased recently and the open interest has started to move higher. For traders who think a repeat of January 2021 is possible this chart will provide a lot of timely information around the build-up of positions. We can see how the open interest started to move higher in GME throughout the entire of 2020, way before the 2021 spike happened. |
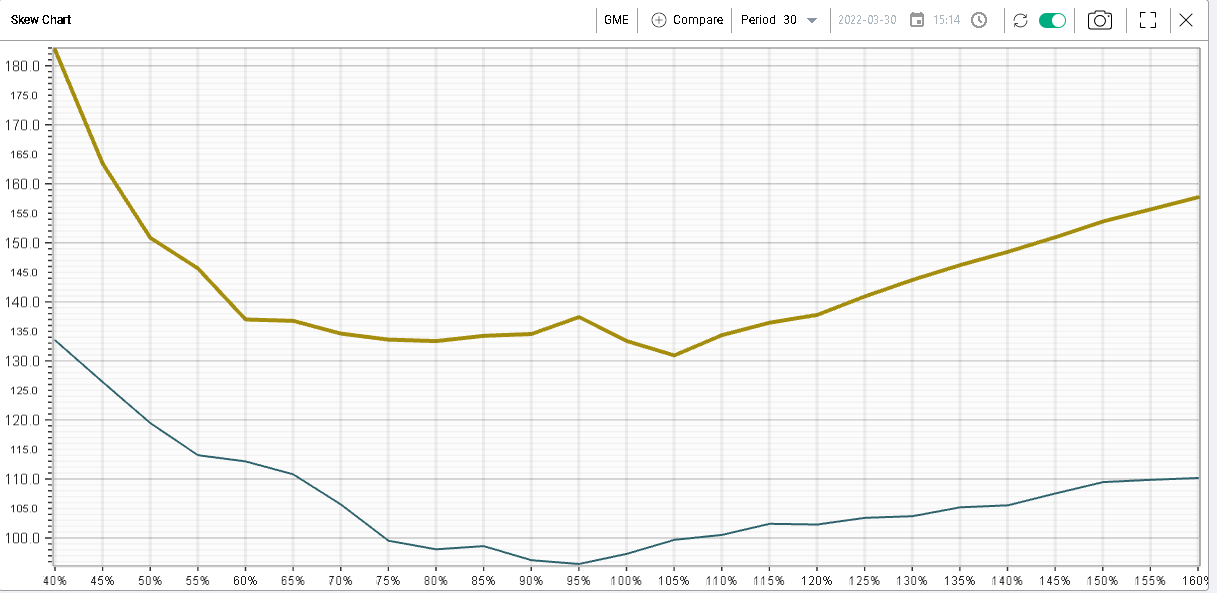
Looking at the skew in GME, we can see that it has shifted higher in a parallel fashion from the end of 2021 in blue to yesterday’s skew curve in yellow. |
|
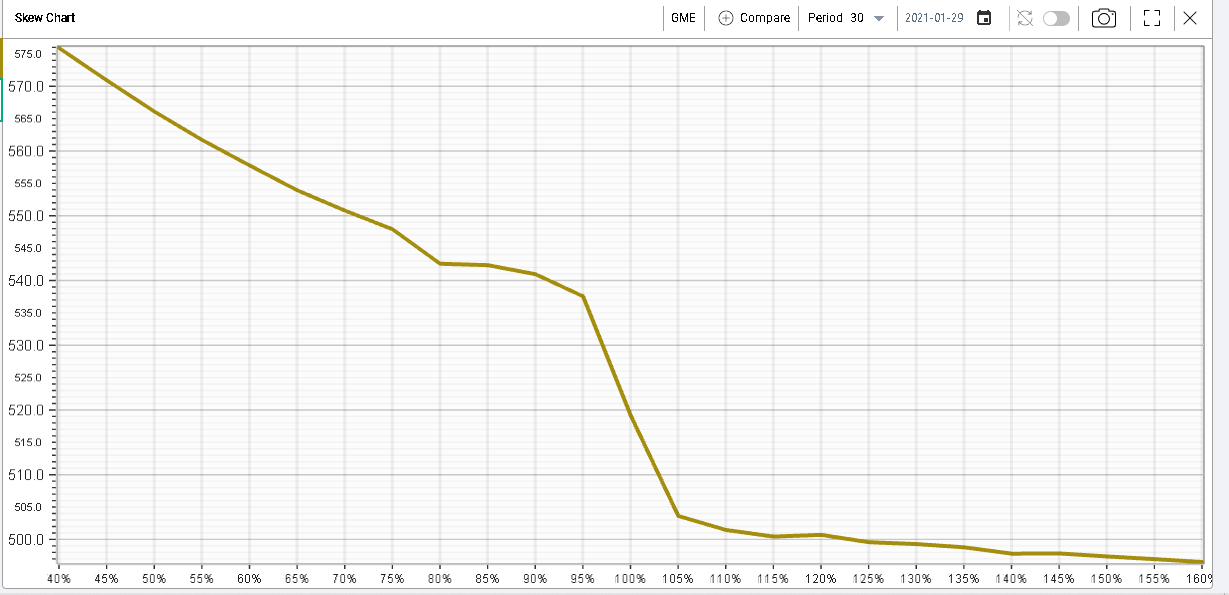
Below we show the curve as of the 29th January 2021. The kink in the curve between the 95% strike and the 105% that was extremely steep in January 2021 is starting to appear again although in a much more modest fashion here. |
|
It is also interesting to note how implied volatility is rising for strikes above 110% while it is quite flat for strikes between the 55% and 105% strike. |
All in all, the story is still being written but it is clear that the volumes and the build-up in positions visible via the open interest are nowhere near the levels that were seen in early 2021. |
Disclaimer - This information is provided for general information and marketing purposes only. The content of the presentation does not constitute investment advice or a recommendation. IVolatility.com and its partners do not guarantee that this information is error free. The data shown in this presentation are not necessarily real time data. IVolatility.com and its partners will not be liable for any loss or damage, including without limitation, any loss of profit, which may arise directly or indirectly from the use or reliance on the information. When trading, you should consider whether you can afford to take the high risk of losing your money. You should not make decisions that are only based on the information provided in this video. Please be aware that information and research based on historical data or performance do not guarantee future performance or results. Past performance is not necessarily indicative of future results, and any person acting on this information does so entirely at their own risk. |