Things to know before JPM reports earnings |
The payroll report on Friday came pretty much in line with expectations and markets were fairly steady overall. Headline indices did trade lower intraday but managed to climb back into positive territory by the close and the SPX finished 0.34% higher. |
Next week will act as a transition week as the market will probably shift from focusing on macro themes to start looking into the earnings stories that will matter over the next few weeks with the earnings season kicking off around the 13th April with JPM set to report amongst other large caps. |
It will be interesting to use the upcoming earnings season as an excuse to dig more into the specifics of some of the companies that will be reporting, from a fundamental, spot and volatility perspective. |
Let us start with JPM which is often amongst the first mega cap to report earnings. |
Fundamentals |
It will come as no surprise that JPM is a large company. With a market capitalization as of Friday’s close of around $400bln it is the 12th largest company in the S&P500 with an estimated weight of around 1% and it is the second largest listed financial institution in the US, just behind Berkshire Hathaway. |
Looking at JPM’s market capitalization does not even come close to describing how gigantic the company is. Looking at its balance sheet as disclosed by the company during its Q4-2021 earnings release, we can see that total assets held at JPM were about $3.74 trillion. In comparison the total assets of the Federal Reserve amount to around $8.9 trillion. |
The firm also employs around 271,025 people across the globe including 169,090 in North America. |
From those assets, the company was able to generate around $125.3bln of revenues in 2021which then translated into around $48.3bln of net income. That works out at about 38.5% net margin and on a per share basis, the reported earnings per share for 2021 was $15.36. |
Looking at the growth of the business, in 2020 revenues were $122.9bln for a net income of $29.1 (net margin around 23.6% so some pretty significant difference). One of the key differences between 2020 and 2021 was the reserves that were built by all banks as a precaution during the pandemic that were subsequently released as things turned out to be not as bad as initially feared. |
In order to better understand JPM’s business, we can look at the 4 business segments that are: |
|
Out of those 4 business lines, the first one is a consumer oriented business while the other three are wholesale businesses. |
The Consumer & Community Banking business can itself be split into three sub-categories: |
|
In 2021, the CCB business line had revenues of around $50bln for a net income of $20.9bln. Consumer/Business Banking was about 48% of revenues, home lending was around $10.5% of revenues and Card/Autos made up about 41.5% of revenues. |
The Corporate & Investment Bank is split in two: |
|
The banking business focuses on solutions such as capital-raising, corporate strategy/structure advisory while the Markets/Securities Services business acts as a market-maker in many cash and derivatives markets. Revenues for CIB in 2021 were about $51.8bln for a net income of around $21.1bln. |
Commercial Banking covers the financial solutions offered to companies. Those services can be payment solutions, lending and more. Total revenue for this segment were $10bln in 2021 for a net income of $5.25bln |
Finally, the Asset & Wealth Management manages around $4.3 trillion of assets for customers. It generated revenues of $16.96bln for a net income of $4.7bln. |
Spot Price |
Over the past 5 years, the stock has grown about 57%. It has also paid around 19.3% of its value 5 years ago in dividends. |
|
It is currently trading around 22% from its highs reached at the end of last year. |
Volatility |
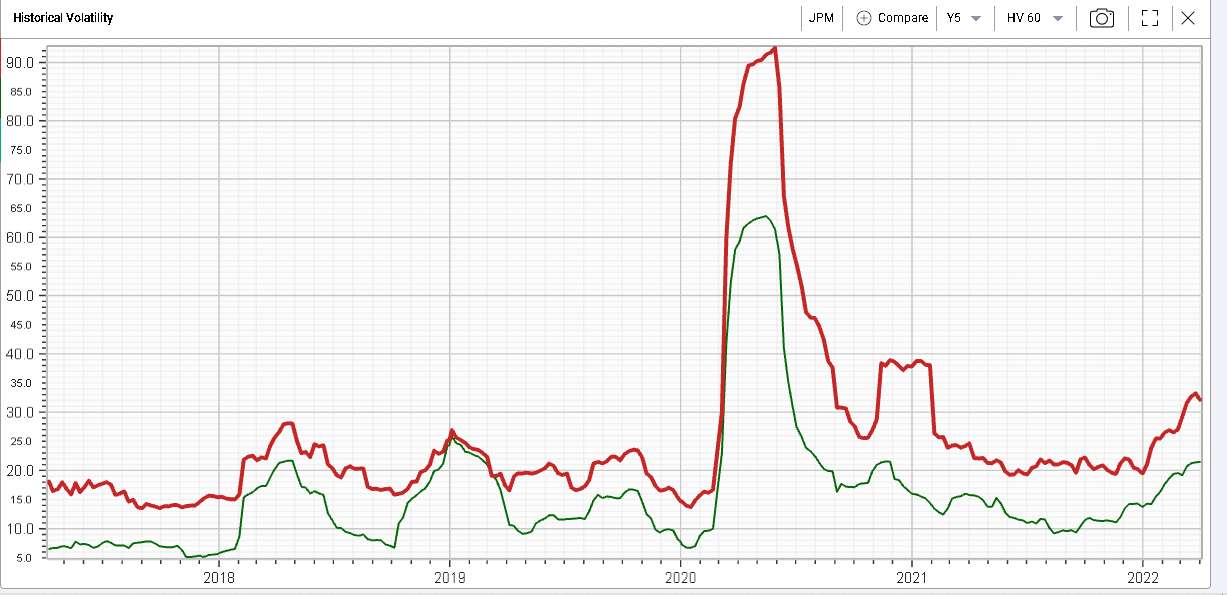
In the chart below, we show in red the 20 days realized volatility of JPM compared with the 20 days realized volatility of the SPX in green over the past 5 years. |
|
JPM realizes slightly more than the SPX, but remains overall very correlated with the index. Since the pandemic, the realized volatility for JPM seems to have been floored around 20%. |
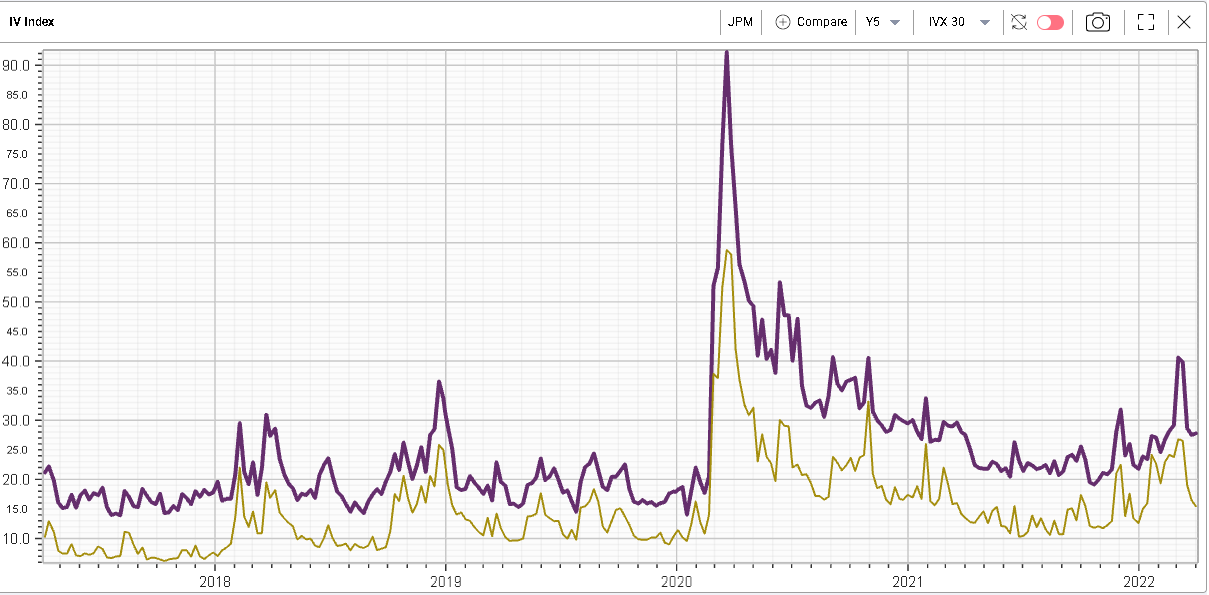
Unsurprisingly we see a similar phenomenon in the name for 30d IVX over the last 5 years with the implied volatility trading at a premium to that of the SPX. |
|
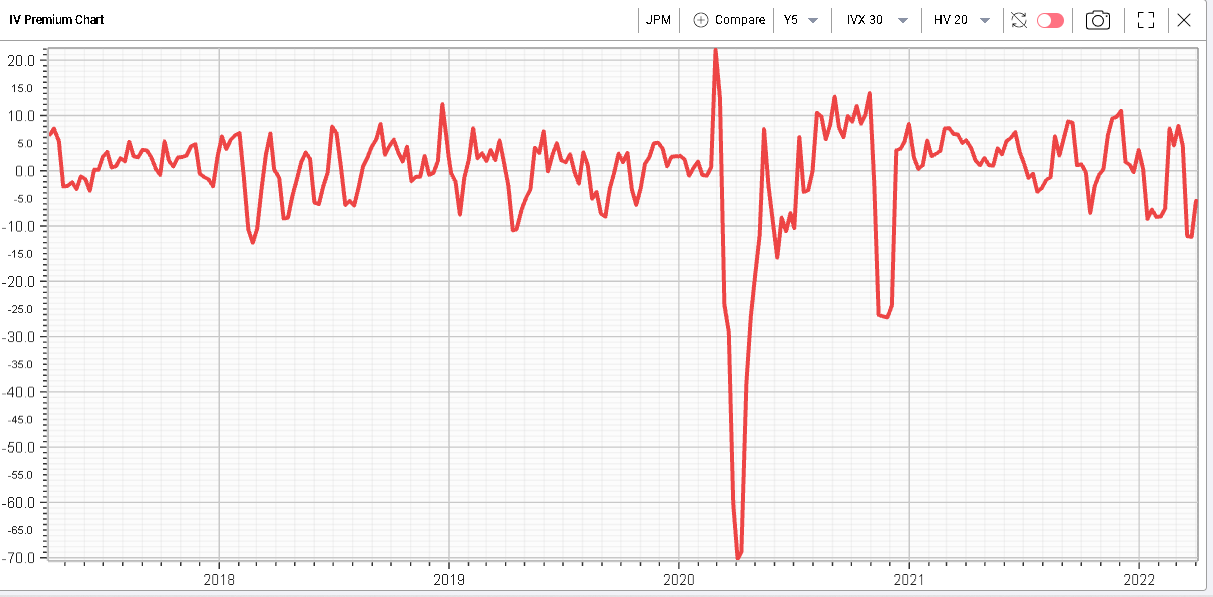
Looking at the IV Premium chart and comparing 30d IVX with 20d Realized Volatility, we get the following: |
|
IV generally trades at a small premium to realized volatility. We can also see that following large increases in realized volatility, the implied volatility will occasionally trade at a discount to realized as market makers anticipate a reduction in future realized volatility. |
Trading |
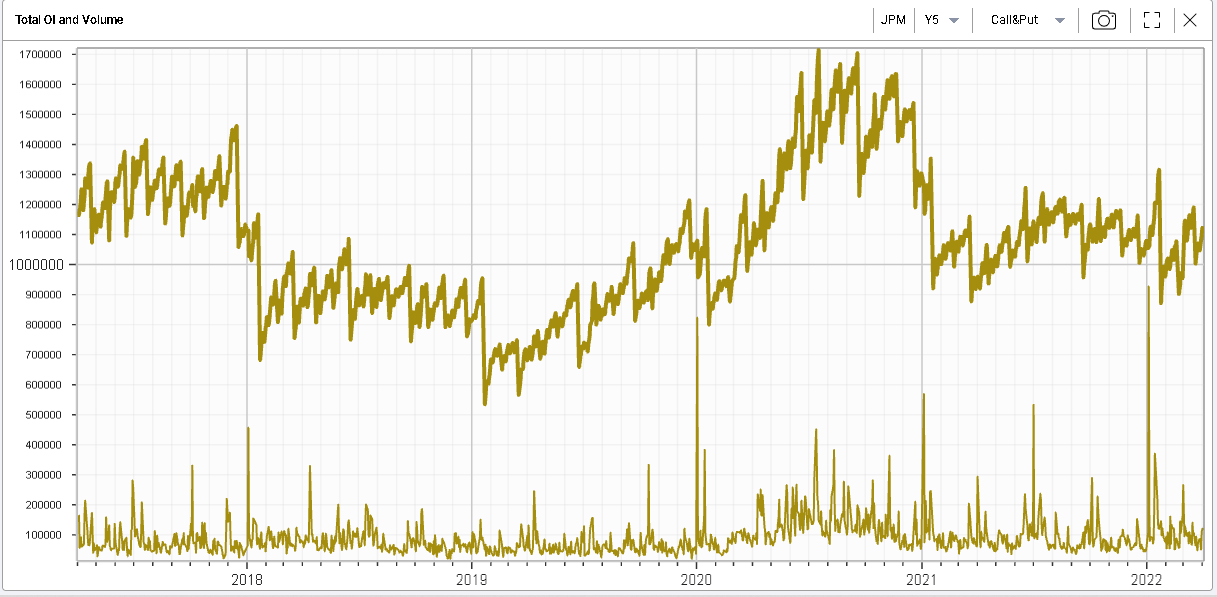
Looking at the activity in the name, we show below the open interest for options positions as well as the volume (lower chart). |
|
2020 saw a large build-up of options positions in the name which reached a peak of around $17bln of open positions across the name in July 2020. |
With around 1.1 million contracts currently open in the name the open interest sits around the middle of its range seen over the last 5 years. |
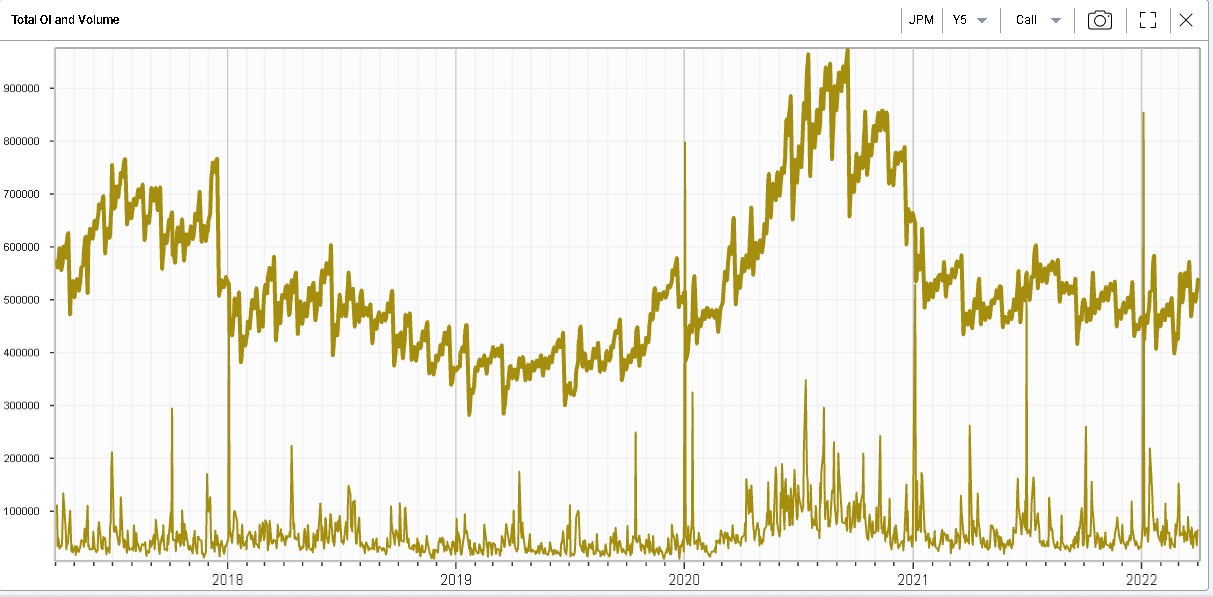
Zooming in on calls, we get the following 5-year chart showing here again the very large build-up of call positions in 2020 as the stock traded below $100. |
|
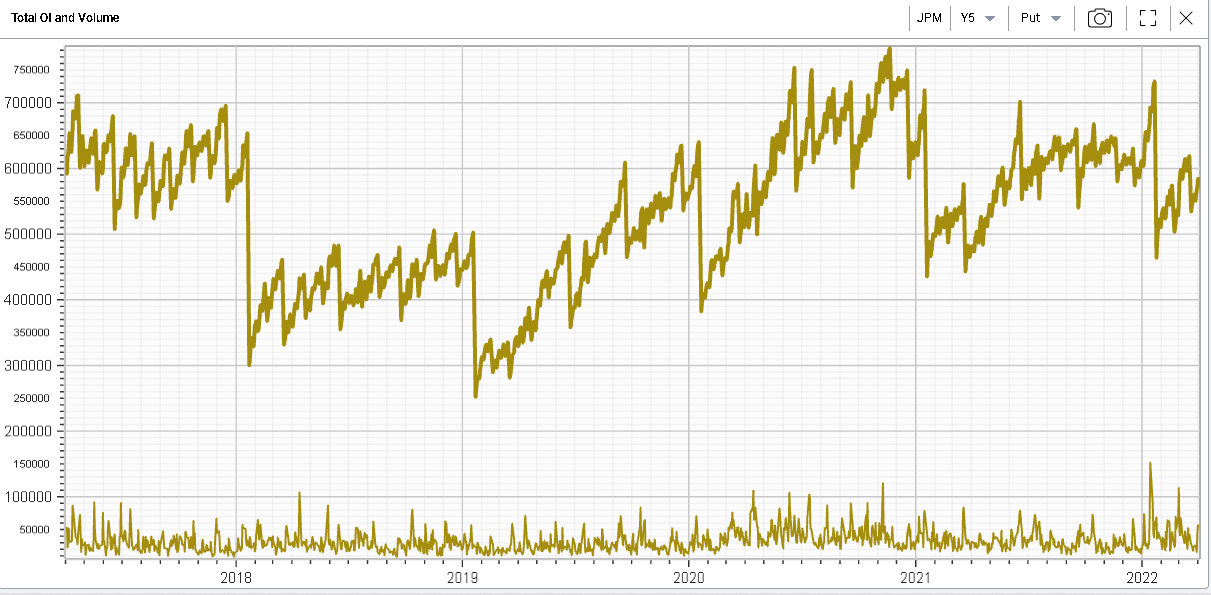
A fairly similar picture appears on the put side although interestingly it looks like some very large positions do expire on the name at the beginning of each year as can be seen by the large drop in OI at the start of 2018/2019/2020/2021 and 2022. |
|
Disclaimer - This information is provided for general information and marketing purposes only. The content of the presentation does not constitute investment advice or a recommendation. IVolatility.com and its partners do not guarantee that this information is error free. The data shown in this presentation are not necessarily real time data. IVolatility.com and its partners will not be liable for any loss or damage, including without limitation, any loss of profit, which may arise directly or indirectly from the use or reliance on the information. When trading, you should consider whether you can afford to take the high risk of losing your money. You should not make decisions that are only based on the information provided in this video. Please be aware that information and research based on historical data or performance do not guarantee future performance or results. Past performance is not necessarily indicative of future results, and any person acting on this information does so entirely at their own risk. |