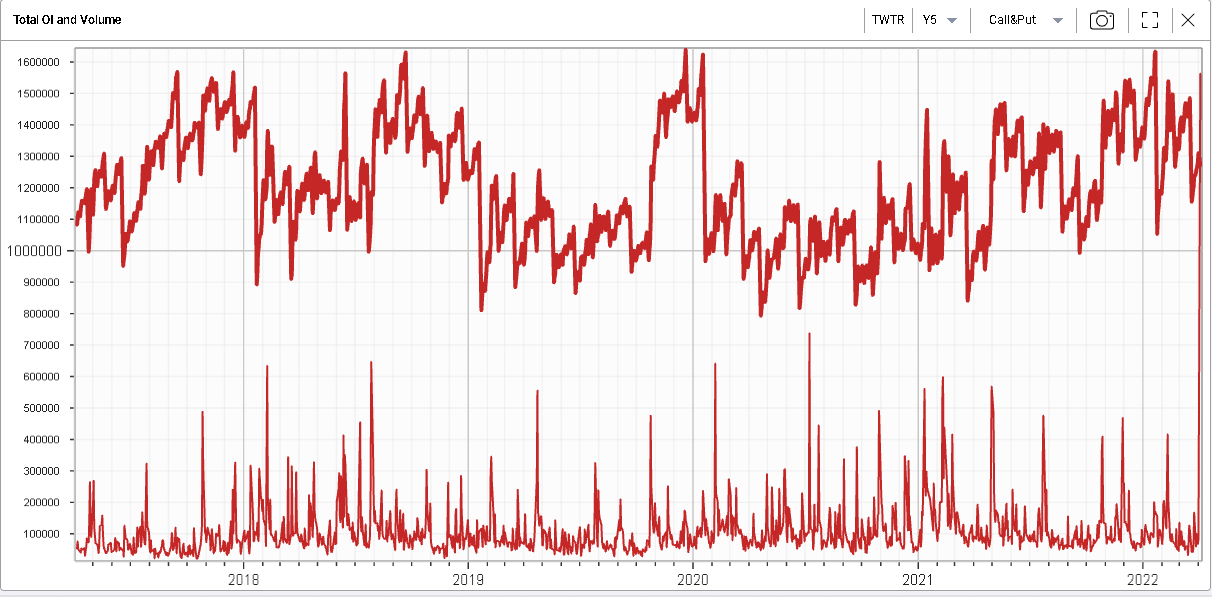
What traders are doing in TWTR |
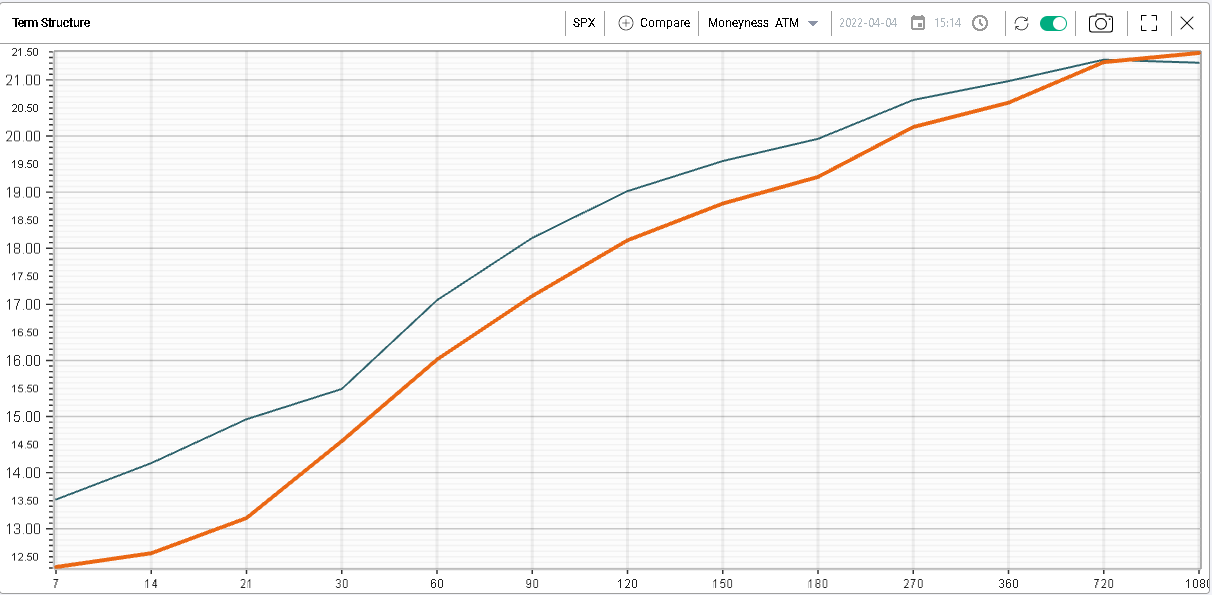
The new week started with an overall quiet session. European indices, the DJIA and the SPX were up about 0.5% on the day. The NDX had a better performance up 2% on the day. Implied volatilities were slightly lower with the SPX term structure parallel shifting lower. |
|
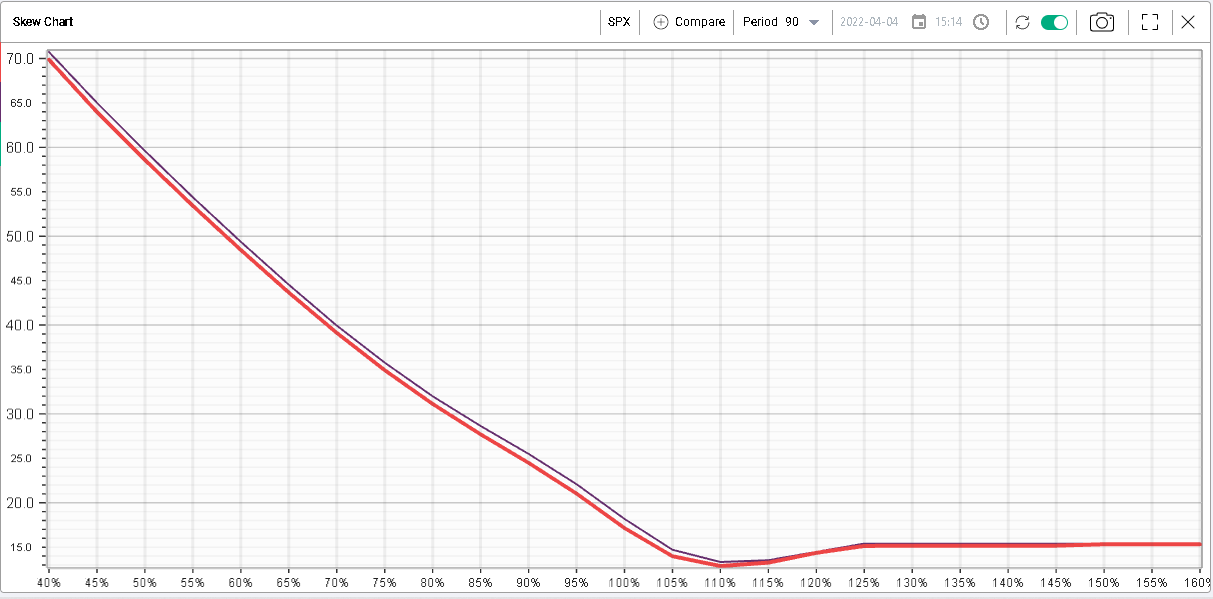
Looking at the 90d day skew, we see that the downside was slightly offered while the upside remained unchanged. |
|
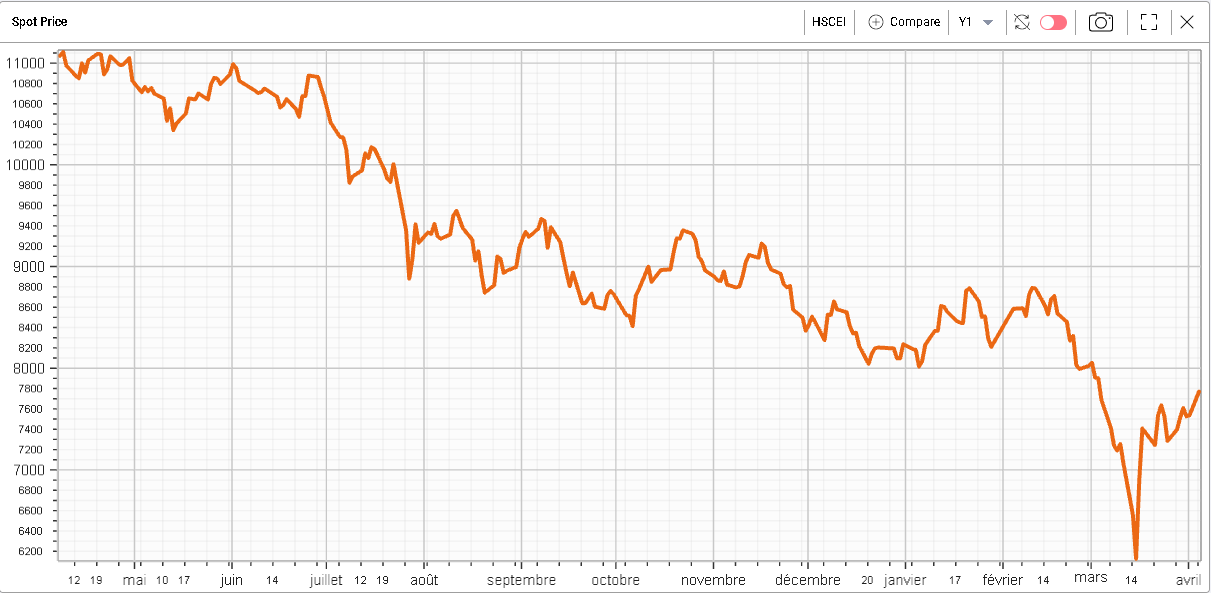
Although the overall noise around Chinese equities has been relatively muted off late, they have continued to push higher with another gain of 3% yesterday for the HSCEI. |
|
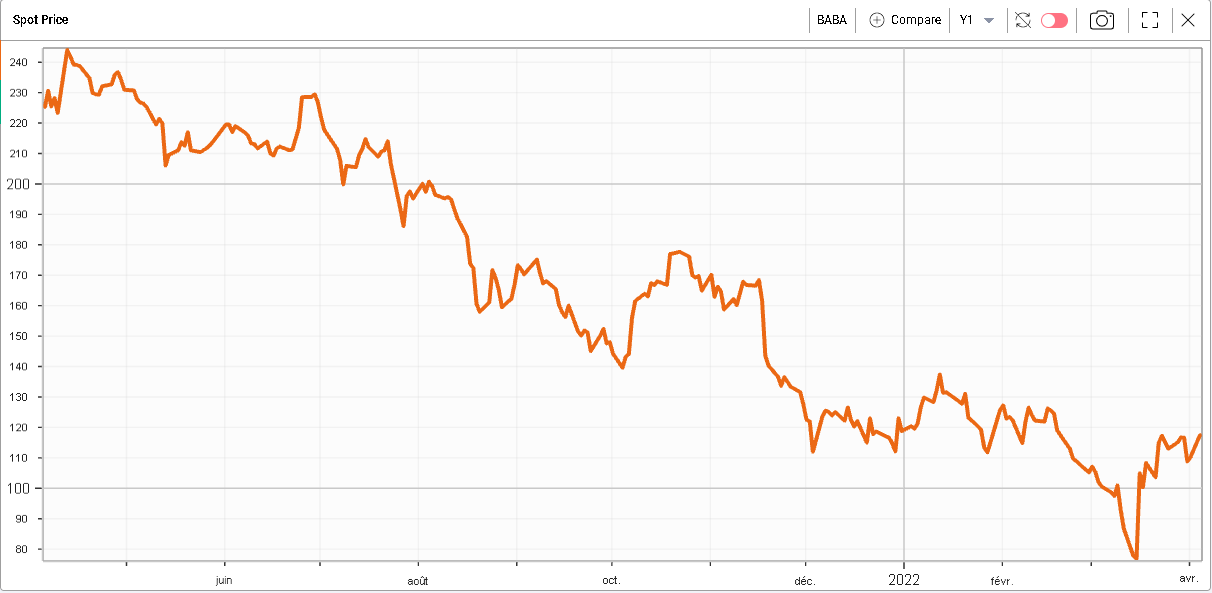
This slightly improved sentiment continues to support Chinese ADRs listed on the Nasdaq. For instance, BABA yesterday managed to gain 6.6%. |
|
JD.com gained 7.14%, NTES gained 2.4%, PDD gained 15.6% and NIO closed 8.7% higher. |
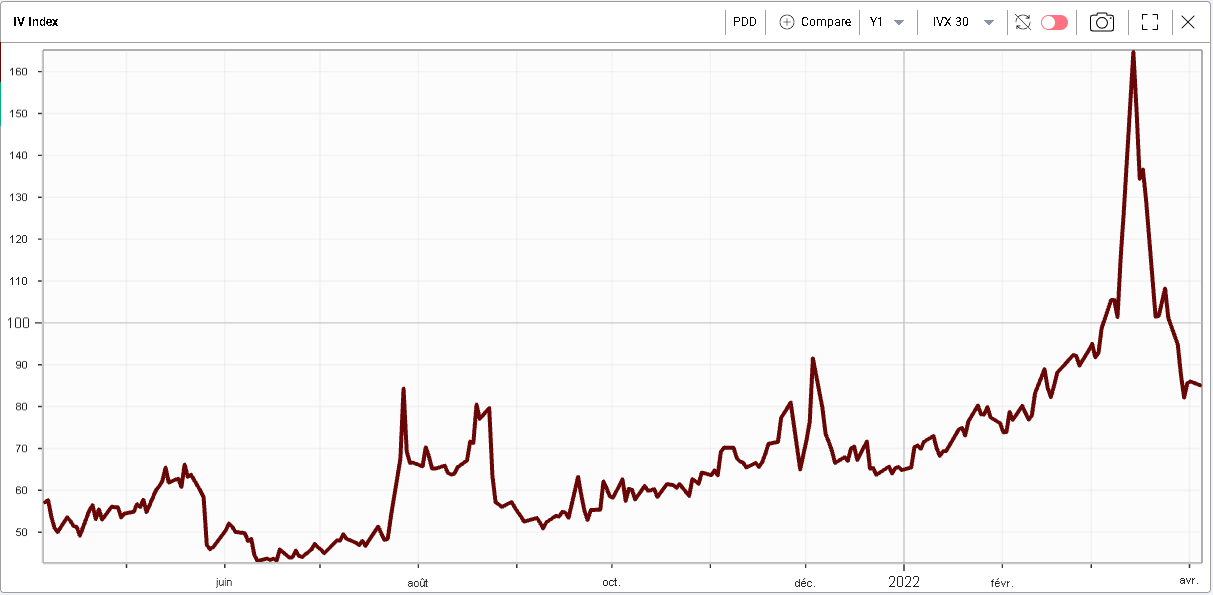
Looking at implied volatilities in those names, those have deflated from the highs reached early March but remain elevated historically. For instance, below the 30d IVX for PDD over the last 12 months. |
|
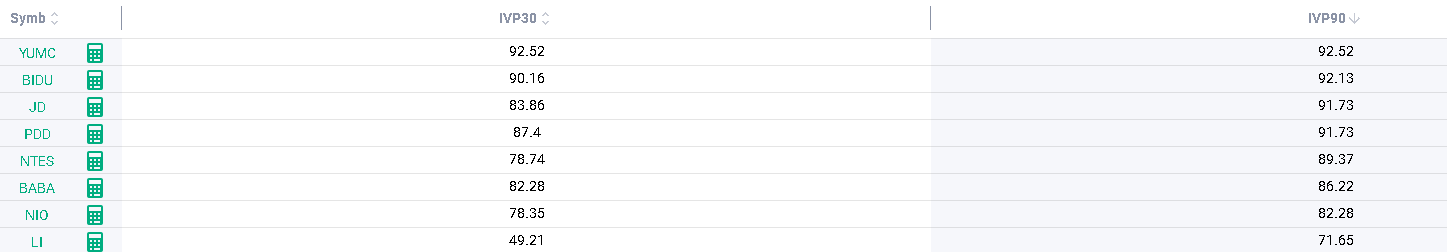
Looking at the stock monitor, we can see that implied volatility for Chinese equities remain relatively elevated compared to the past 12 months with implied volatility percentiles ranging from 71st to 92nd for 90d IVX and 49th to 92nd for 30d IVX. |
|
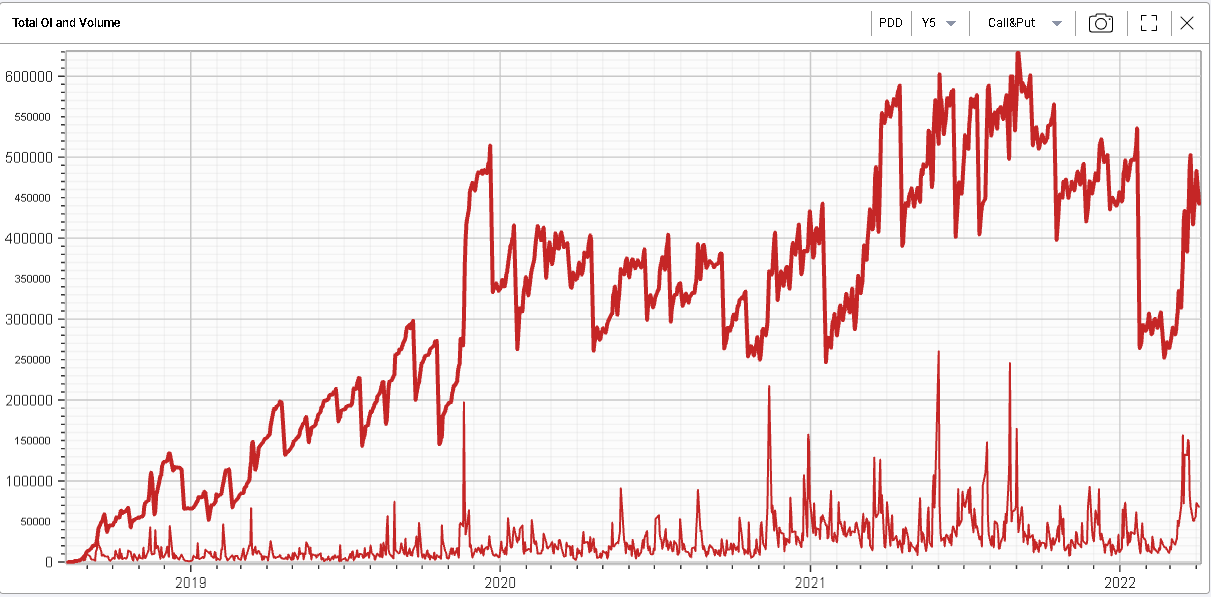
Looking at the trading in those names, volumes have picked up since the beginning of March. The split has been fairly homogenous between calls and puts across most of the names. |
|
US sectors yesterday were actually quite dispersed. In fact, three segments of the market managed to make decent gains while the rest was fairly subdued. |
First, the consumer discretionary space was up 2.25% helped by stocks like AMZN which gained 3% and TSLA which moved 5.6% higher. |
Second, the tech sector was up 1.9% led by AAPL up 2.4% and MSFT up 1.8%. NVDA also gained 2.4% on the day. |
Third, the communications sector was the best performing sector up 2.76%. META gained 4%, GOOG gained 2.1% and NFLX was up almost 5%. |
The main story in that space was obviously TWTR which gained more than 27% as Elon Musk declared a significant stake in the company. |
On the other hand of the spectrum, the Healthcare space finished about 0.8% lower. The selling happened across most of the stocks of the space with ABBV down 0.5%, JNJ -0.9% and UNH -0.5%. |
Utilities also saw some profit taking yesterday and finished about 0.77% lower while the rest of the sectors were largely unchanged. |
The overall action in TWTR is quite interesting with daily volumes greater than the total open interest in the name. |
|
Overall, around 1.56 million contracts exchanged hands yesterday for a total notional of around $7.8bln the largest options volume day off the last 5 years by a very comfortable margin. 464k puts and 1.1 million calls traded overall. |
Looking at the options chain, we can see that volumes were extremely front-loaded with the vast majority of the action happening on short-dated strikes. |
|
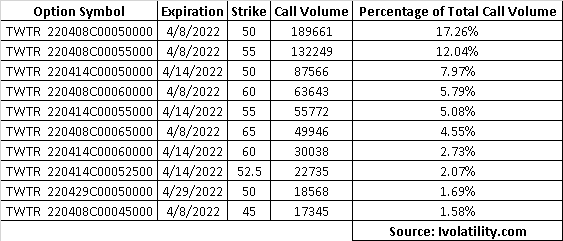
In fact, the 10 most active calls all expire sometime in April (most actually expire on the 8th) and collectively make up 60% of the total volume in TWTR calls yesterday. |
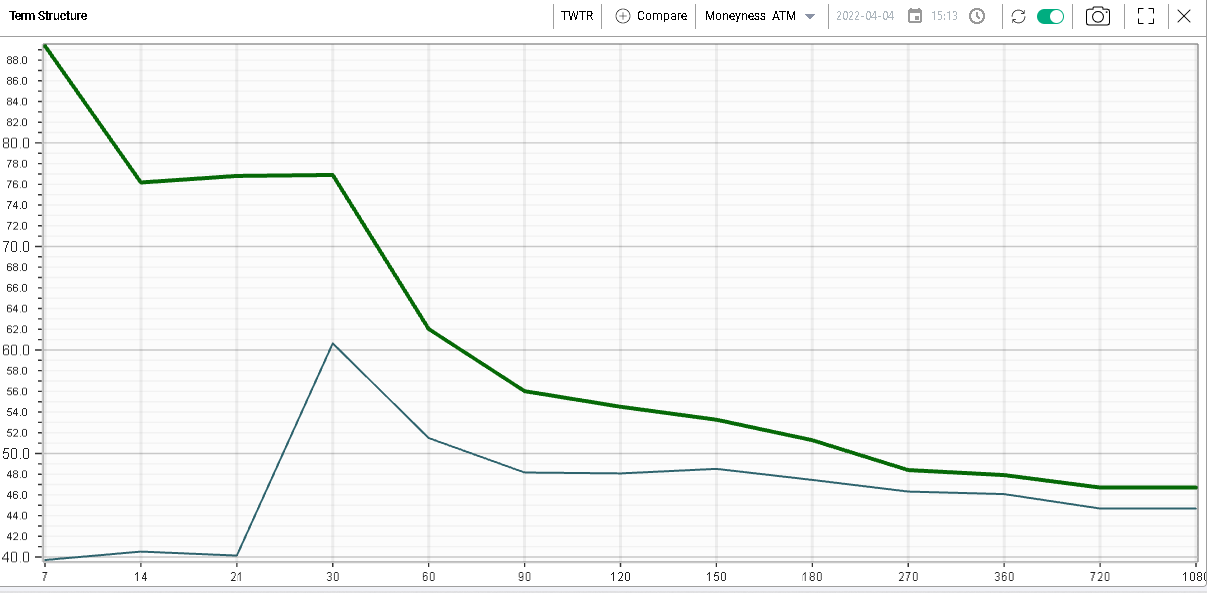
This could create a very difficult situation for market makers who could find themselves very short options with short dated expirations which explains the dramatic inversion of the term structure in the name yesterday with the IV for front-month options doubling in the process. |
|
Volumes in the stock were also far greater than usually seen with almost 270 million shares trading compared to a standard average of around 20 million shares. |
The stock will thus be very interesting to watch over the next few days as most of the volume yesterday also happened on options relatively close to the current spot price in the name. |
Disclaimer - This information is provided for general information and marketing purposes only. The content of the presentation does not constitute investment advice or a recommendation. IVolatility.com and its partners do not guarantee that this information is error free. The data shown in this presentation are not necessarily real time data. IVolatility.com and its partners will not be liable for any loss or damage, including without limitation, any loss of profit, which may arise directly or indirectly from the use or reliance on the information. When trading, you should consider whether you can afford to take the high risk of losing your money. You should not make decisions that are only based on the information provided in this video. Please be aware that information and research based on historical data or performance do not guarantee future performance or results. Past performance is not necessarily indicative of future results, and any person acting on this information does so entirely at their own risk. |