Should you look at defensive stocks? |
The resilience of the equity market at the same time as interest rates are going up has been the subject of many conversations over the past few weeks. |
Since the financial crisis, traders have been used to an environment where a more accommodative Federal Reserve resulted in higher Equity prices. As the FED was expanding its balance sheet, liquidity seemed to flow directly into the equity market pushing stock prices up almost mechanically. |
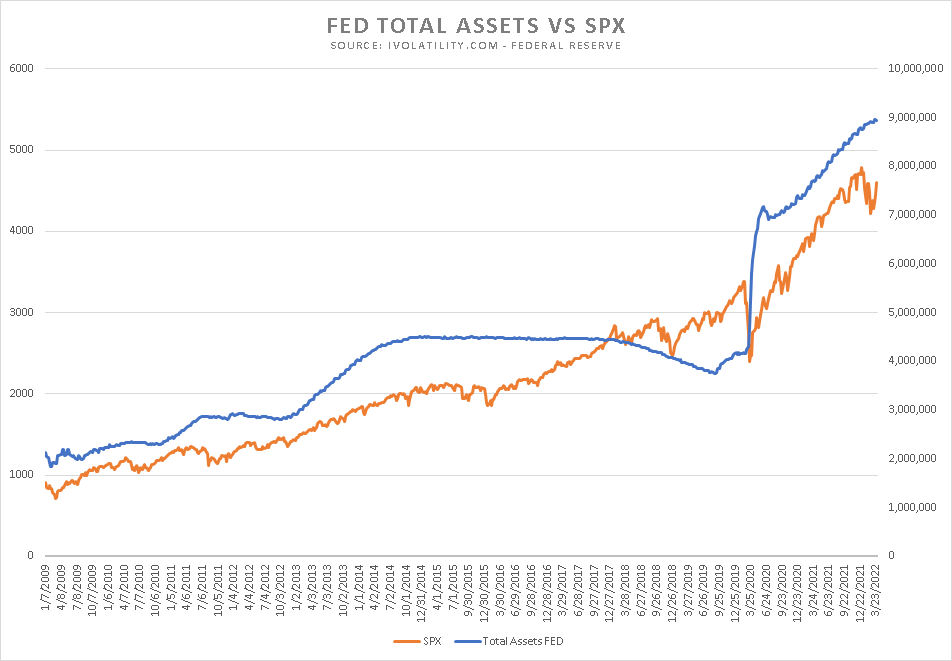
The chart below shows the level of the SPX in orange (left hand scale) while the orange line shows the level of total assets held at the FED (right hand scale). |
|
That is a level correlation of around 92.2% since 2009…not bad! |
Judging from that angle, the resilience of the market could possibly be explained by the fact that for now, assets held at the FED have continued to increase despite interest rates starting to move higher. |
Fixed income traders have so far gone to great lengths to try and reflect a possible rate hike cycle into US rate curves. On the other hand, the notion that the FED would tighten or even unwind its balance sheet remains quite vague for now. |
That is why, yesterday’s speech by Lael Brainard was very important and caught the attention of traders across all asset classes |
Not only was the Balance Sheet reduction explicitly mentioned but she added that the pace would be much faster than seen in the previous recovery when the FED’s approach was to let $50bln a month roll-off while continuing to reinvest the rest of maturing assets. |
This speech caught the market by surprise and added to the worries leading to a correction in equity indices as well as a further selloff in Treasuries. |
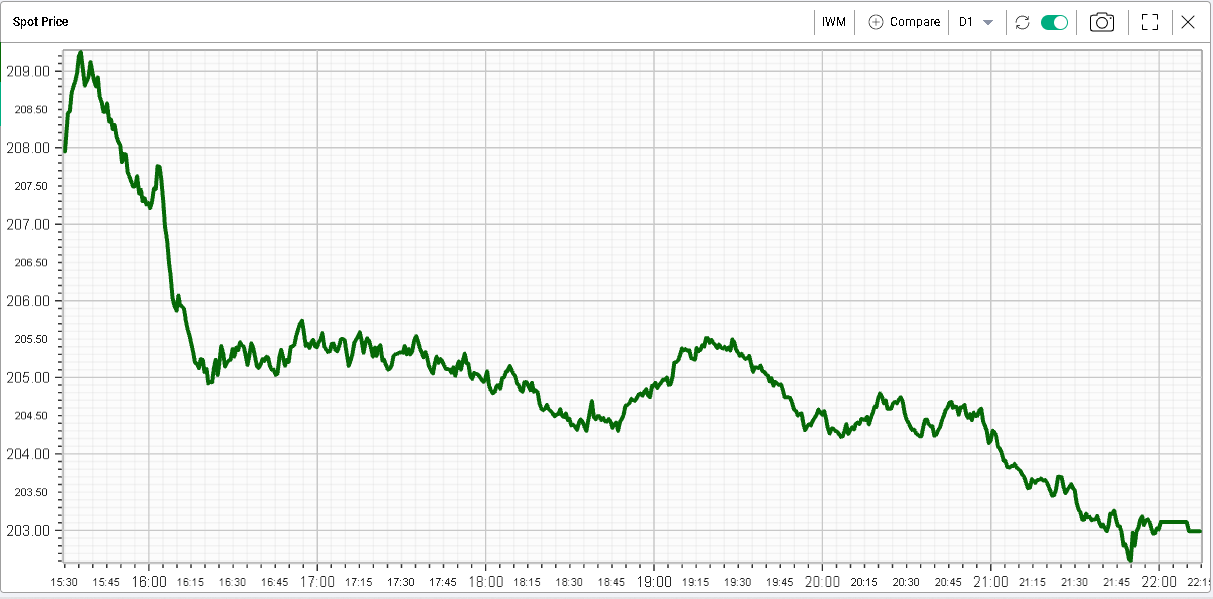
The NDX completely reversed its performance from the prior session and closed about 2.24% lower. The SPX finished 1.2% and the DJX was down 0.9%. Small caps and tech were sold most aggressively with the RTY finished 2.4% lower. |
IWM Russell 2000 ETF – Yesterday’s trading session |
Implied volatilities increased with 30d IVX up 3 points for the NDX, 2.5 points for the SPX and 1.5 points for the DJX. |
Sector wise, defensives outperformed while tech and consumer discretionary sold off most. Interestingly Financials continue to trade poorly despite interest rates moving higher. |
Within the DOW Jones components, UNH was the best performing stock reversing the move from the previous session. The stock finished up 1.5%. |
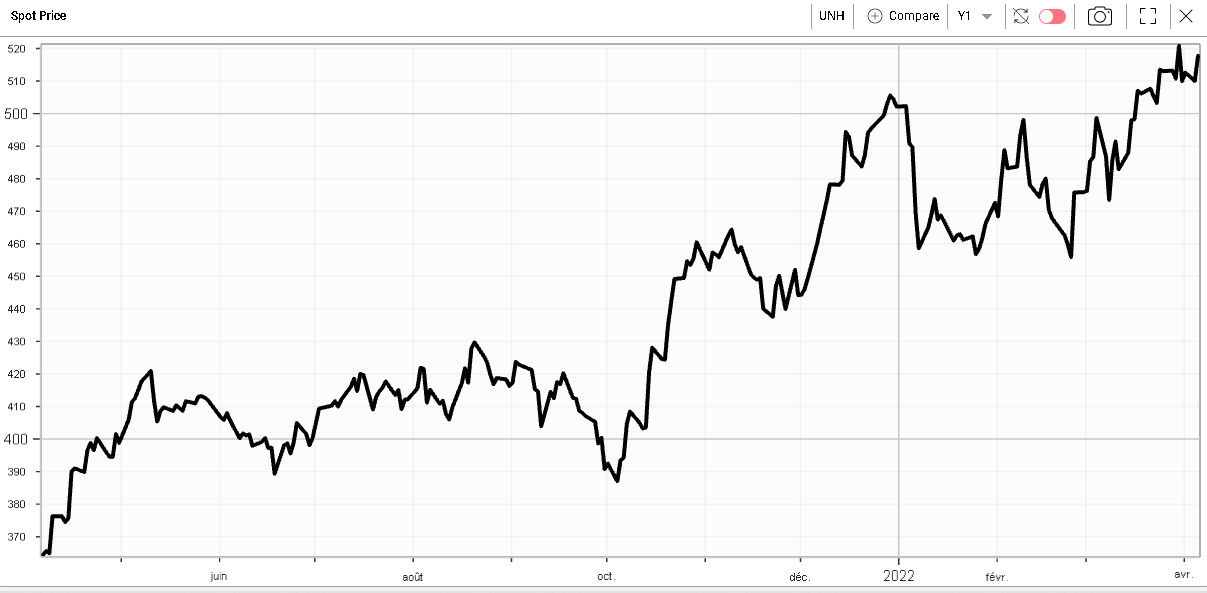
The stock has had a relatively steady performance over the last 12 months with relatively limited volatility overall. The low volatility is a factor that investors tend to like at times of uncertainty and that may explain part of the strong performance of the name over the last 12 months. |
UNH – 12 months spot price |
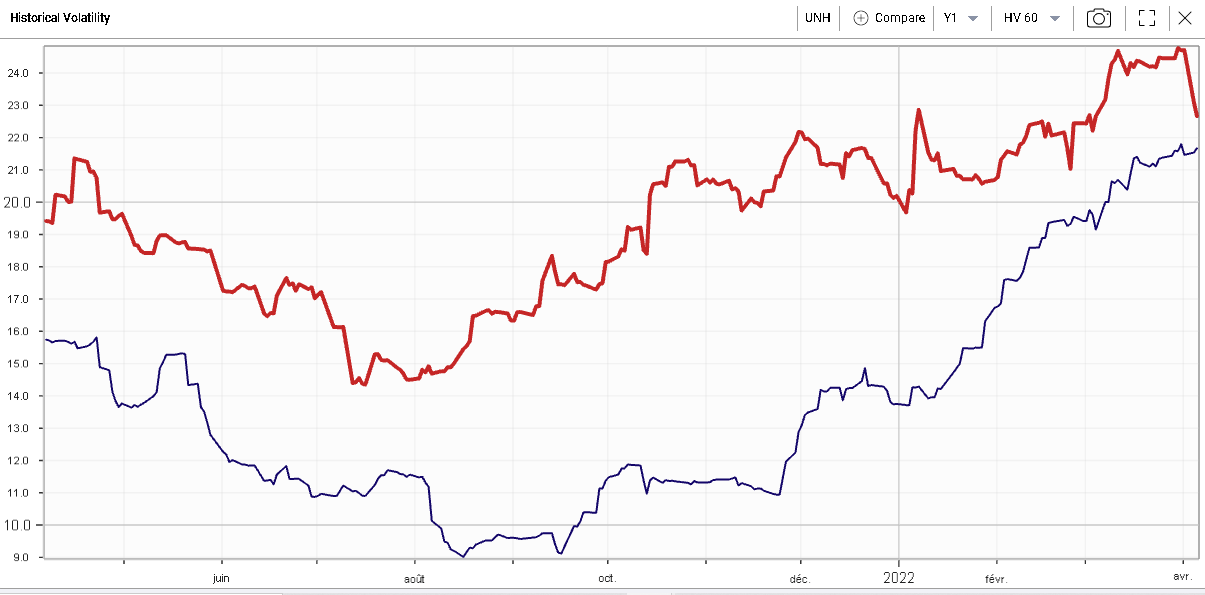
UNH in Red, 60d Realized volatility, SPX in blue, 60d HV |
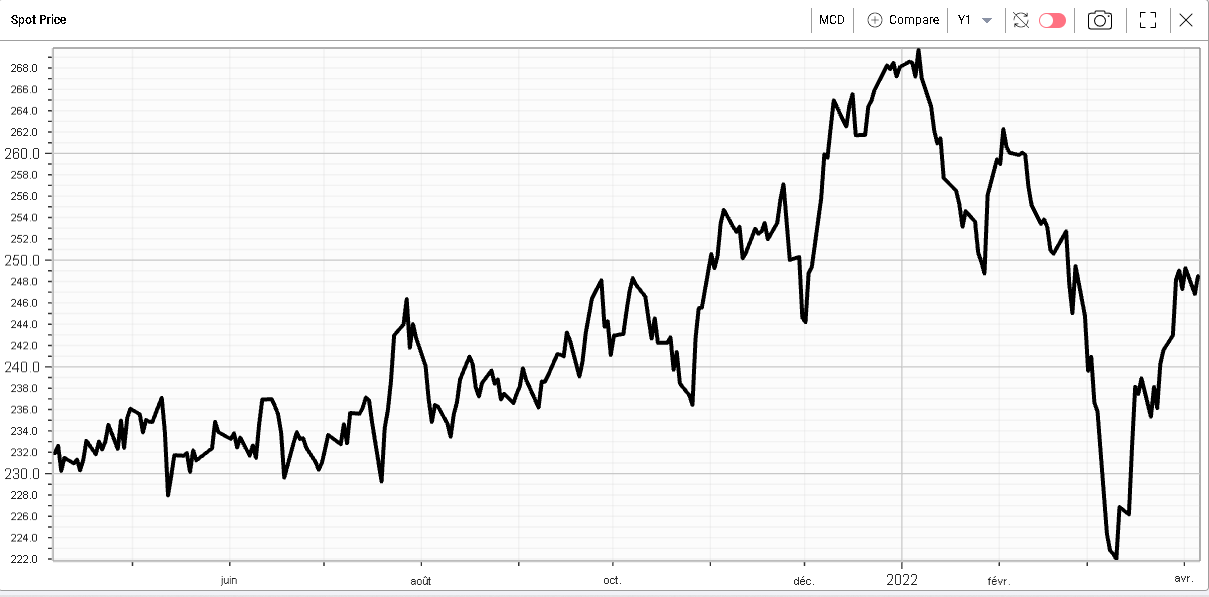
MCD was also one of the top performers yesterday gaining 0.7% on the day despite a very heavy market overall. The name was under significant selling pressure as the conflict between Ukraine and Russia broke out but has bounced back significantly since then. |
MCD – 12 months spot price |
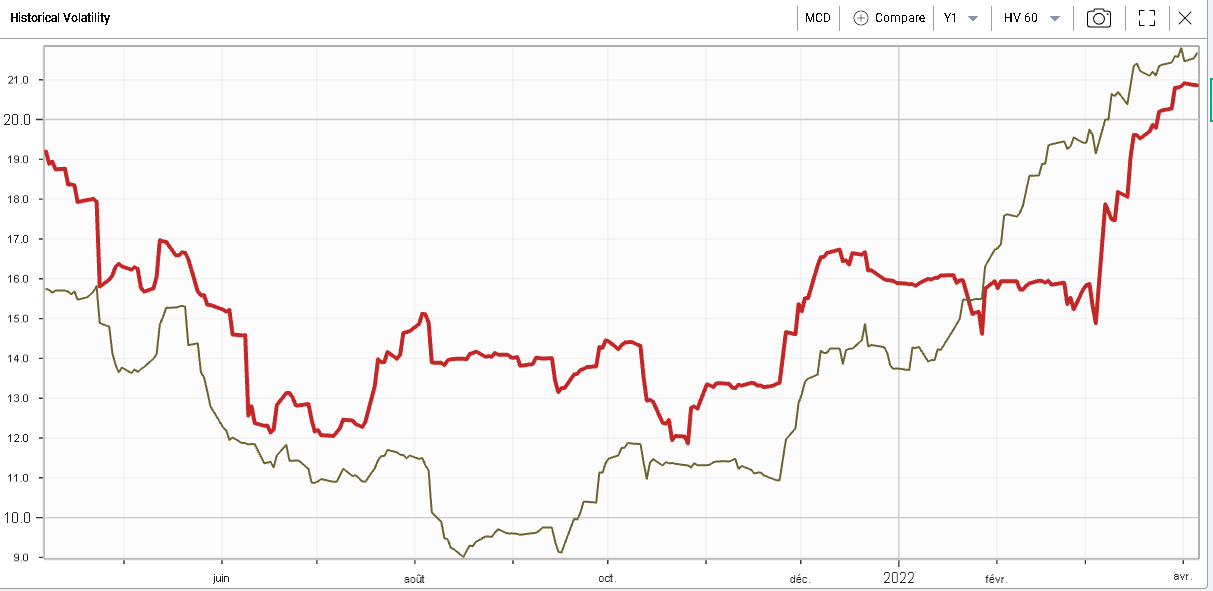
Looking at realized volatility, we can see that although volatility has increased for MCD (in red below), it has been moving less than the SPX since the beginning of March. |
|
The way those defensive stocks behave is an important signal. Investors rarely go from being fully invested to having no chips on the table. Instead, they tend to shift their exposure along the risk curve depending on what opportunities they perceive in the market. Looking at stocks for their intrinsic characteristics is also an interesting way to understand what is happening under the surface. |
Disclaimer - This information is provided for general information and marketing purposes only. The content of the presentation does not constitute investment advice or a recommendation. IVolatility.com and its partners do not guarantee that this information is error free. The data shown in this presentation are not necessarily real time data. IVolatility.com and its partners will not be liable for any loss or damage, including without limitation, any loss of profit, which may arise directly or indirectly from the use or reliance on the information. When trading, you should consider whether you can afford to take the high risk of losing your money. You should not make decisions that are only based on the information provided in this video. Please be aware that information and research based on historical data or performance do not guarantee future performance or results. Past performance is not necessarily indicative of future results, and any person acting on this information does so entirely at their own risk. |