Is cash king for Equity investors? |
The performance of US indices continues to be very dispersed with the DJIA finishing up 0.4% while the NDX closed 1.4% lower on the day. The SPX sits in the middle and finished 0.3% lower. In Europe, indices performed well with the German DAX closing about 1.5% higher. |
Looking at sectors the technology space underperformed over the day down around 1.4% while energy outperformed up 2.75%. Financials also caught a bid and finished up about 1% on Friday. |
Yields continue to increase with the 2-year sitting at 2.57% while the 10-year is at 2.76%. |
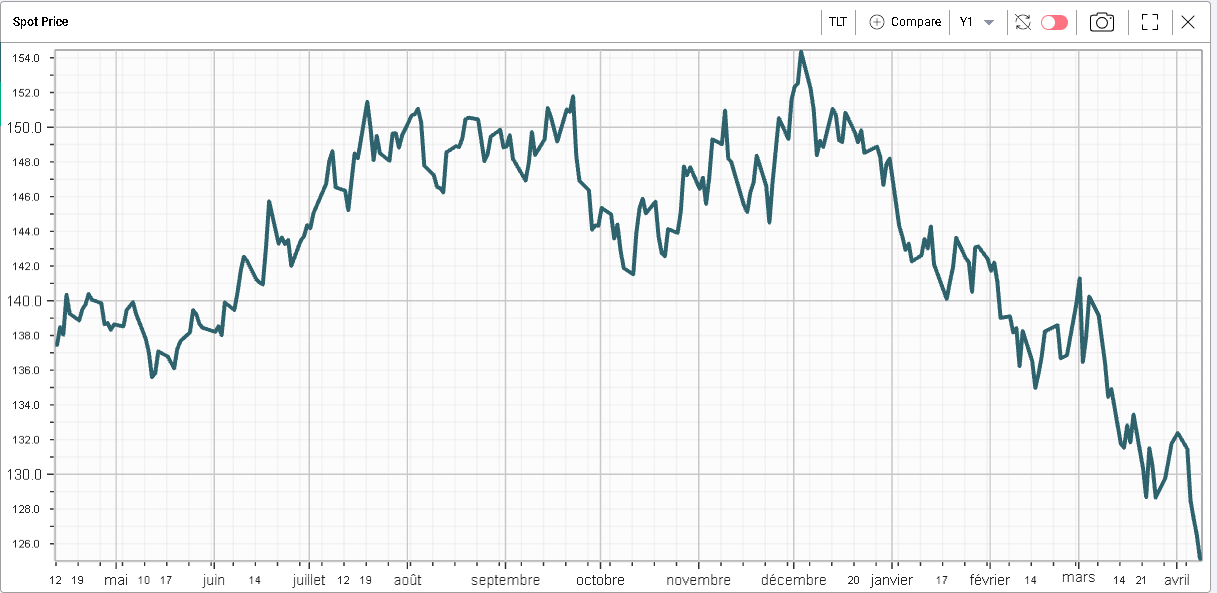
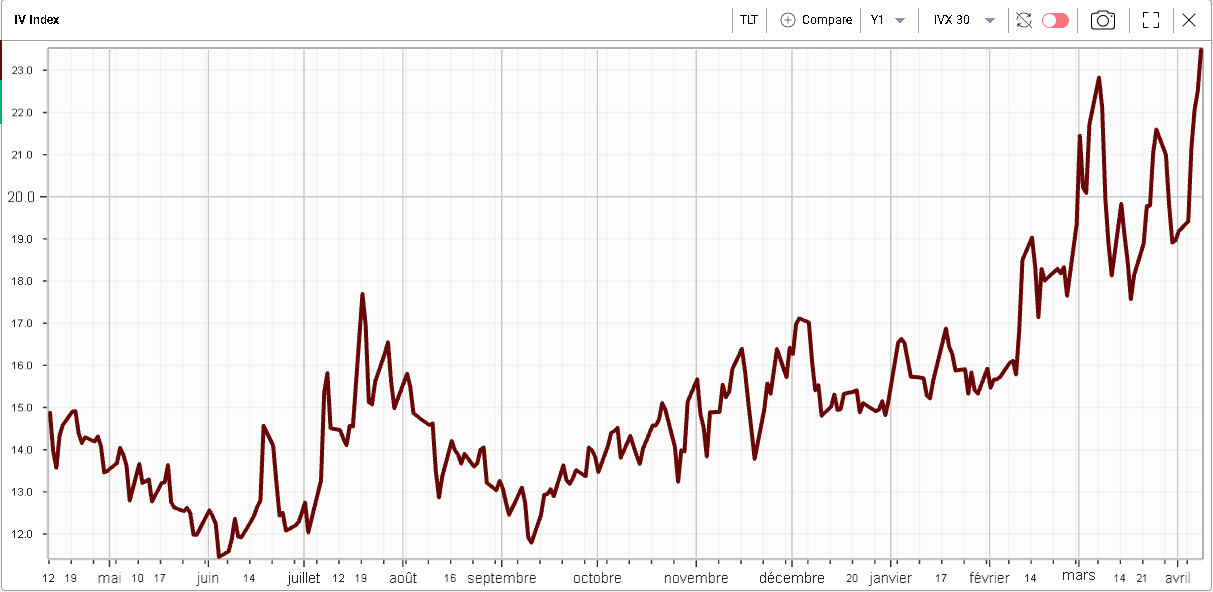
TLT continue to slide while its implied volatility is at the highest level in 12 months. |
Spot Price – TLT – Last 12 months |
30d IVX – TLT – Last 12 months |
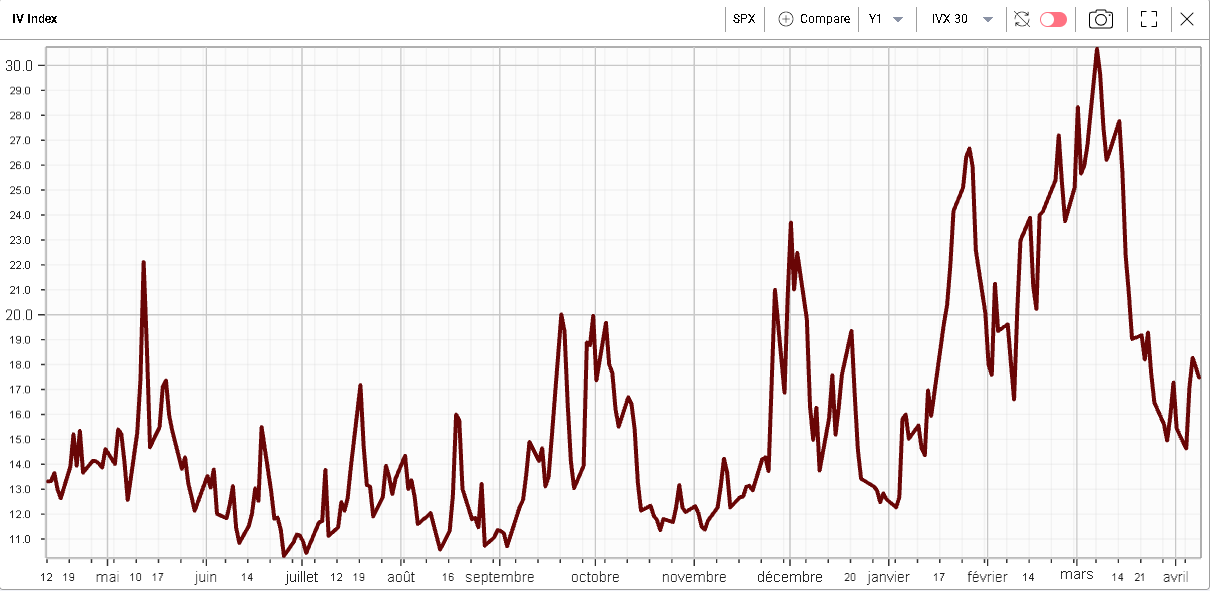
At the same time as implied volatility for Fixed Income is at very elevated levels, the implied volatility for US indices remains subdued. Looking at the 30d IVX on SPX for the past 12 months, it has corrected significantly since the highs of early March. |
30d IVX – SPX – Last 12 months |
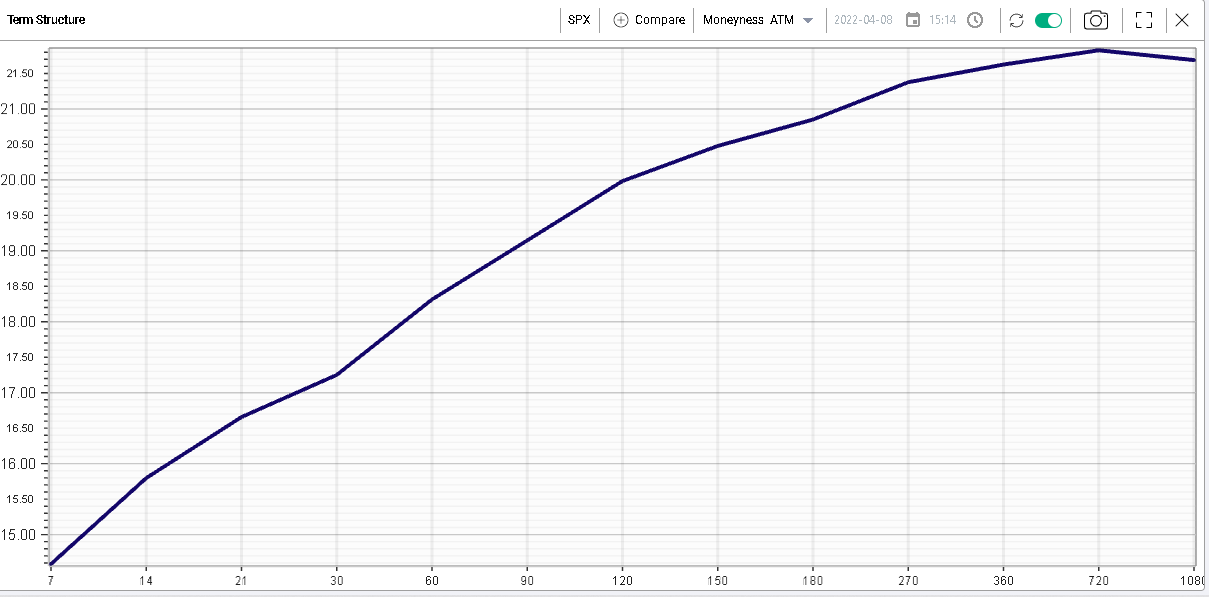
In fact, the term structure for the SPX is upward slopping, a sign that very little worries the market at the moment. |
Term structure – SPX |
This difference in pricing between Fixed Income assets and Equities shows that the impact of a possible rate hike cycle by the FED is seen as limited by Equity investors. More specifically, it is probably expected to impact individual stocks in a different manner with some set to gain and benefit while others will struggle. |
Considering that interest rates are expected to grow over the next 12 months, one possible avenue to explore would be to consider if companies that are able to generate excess cash have benefited from the recent repricing in US stocks, while also checking if those that need cash to finance their current operations have been under pressure. |
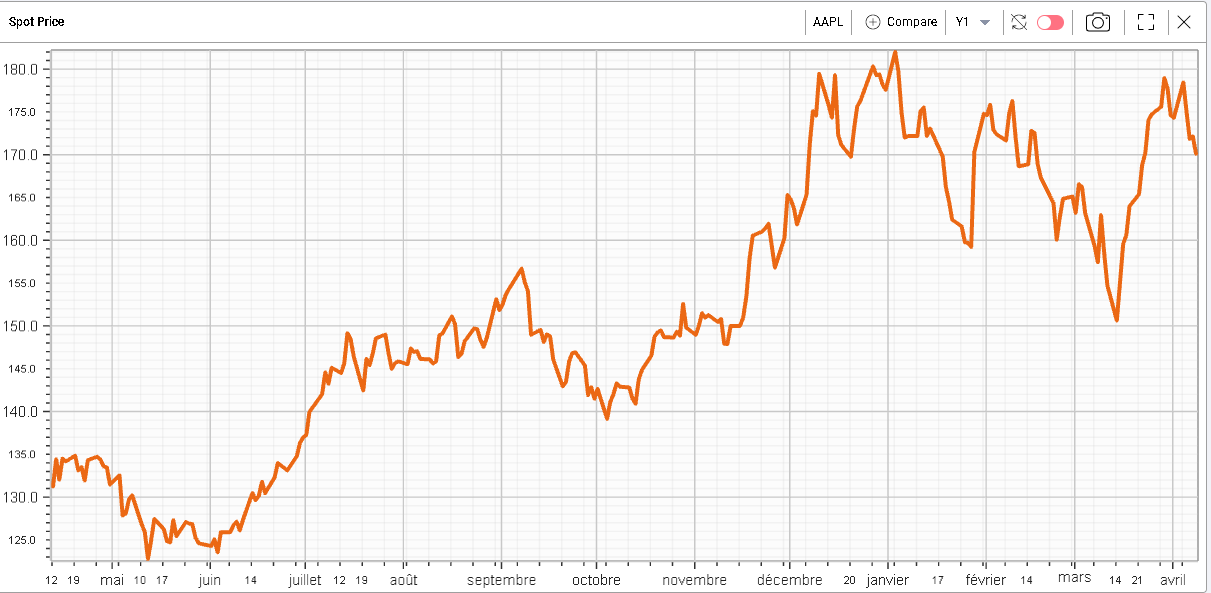
Apple for instance is a company known to generate significant amounts of free cash flow. In 2021, Apple managed to generate $92.95bln of Free Cash Flow. |
Looking at the performance of Apple so far this year, it has outperformed the NDX by 6.63%. |
Apple stock price – Last 12 months |
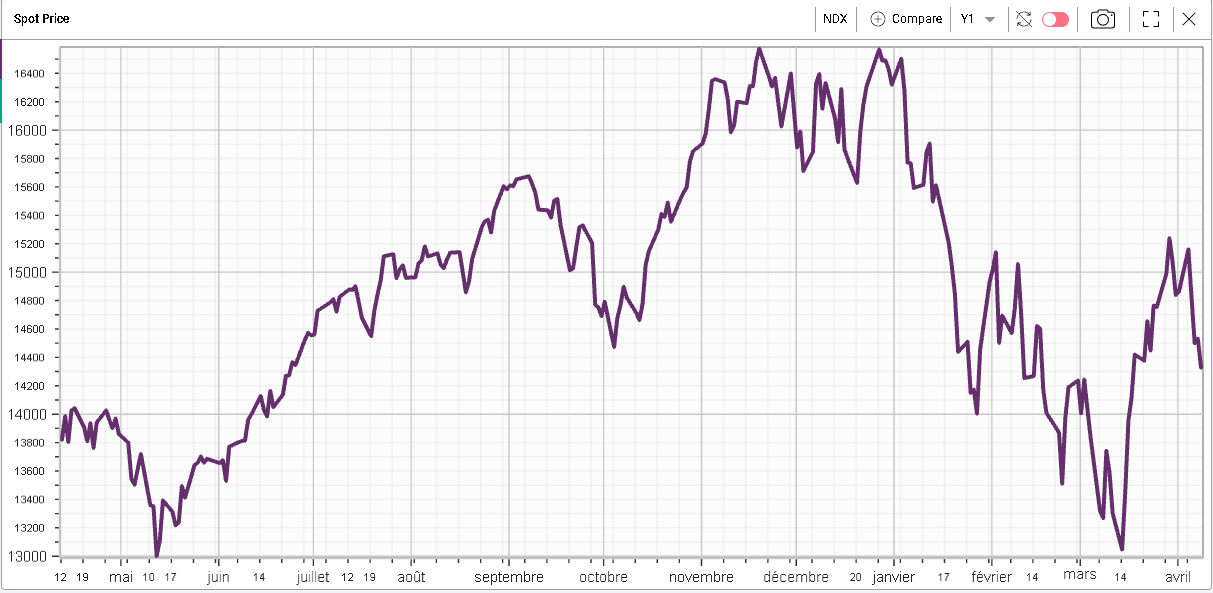
NDX spot – Last 12 months |
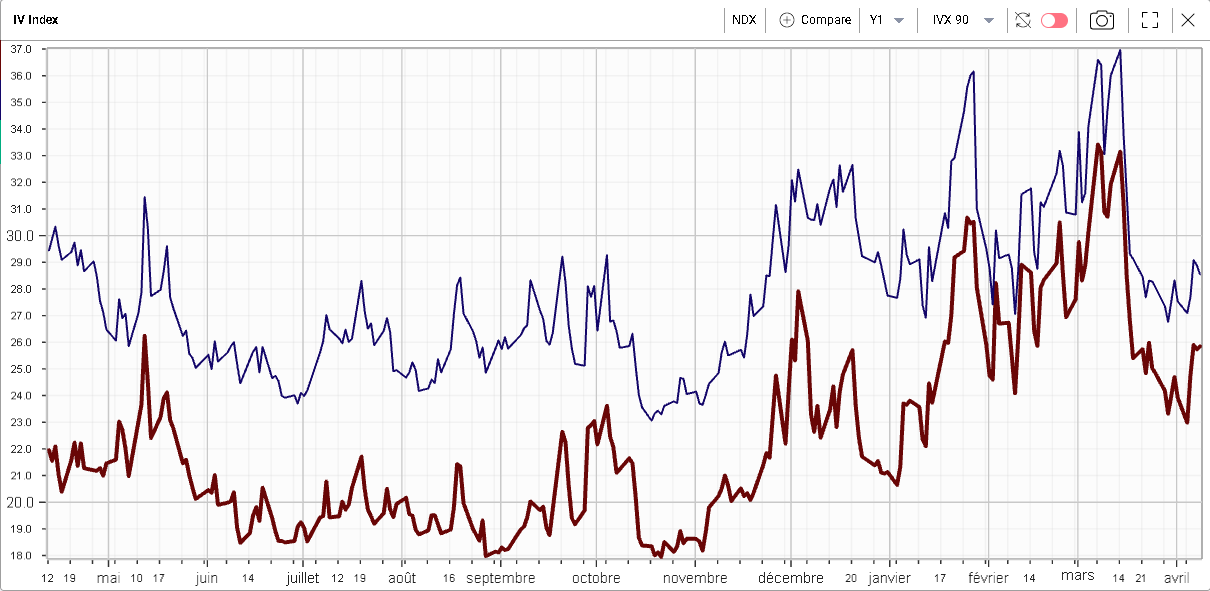
Looking at the 90d IVX, we can also see that the risk premium of Apple (blue line) over the NDX (brown line) has dropped over the past few months. Apple 90d IVX is currently about 3 points higher than the NDX while it was around 6 points for most of 2021. |
AAPL 90d IVX vs NDX 90d IVX – Last 12 months |
On the other hand, we could postulate that companies that are unable to generate cash will see the cost of borrowing increase as the hiking cycle goes underway and they may be underperforming for that reason. |
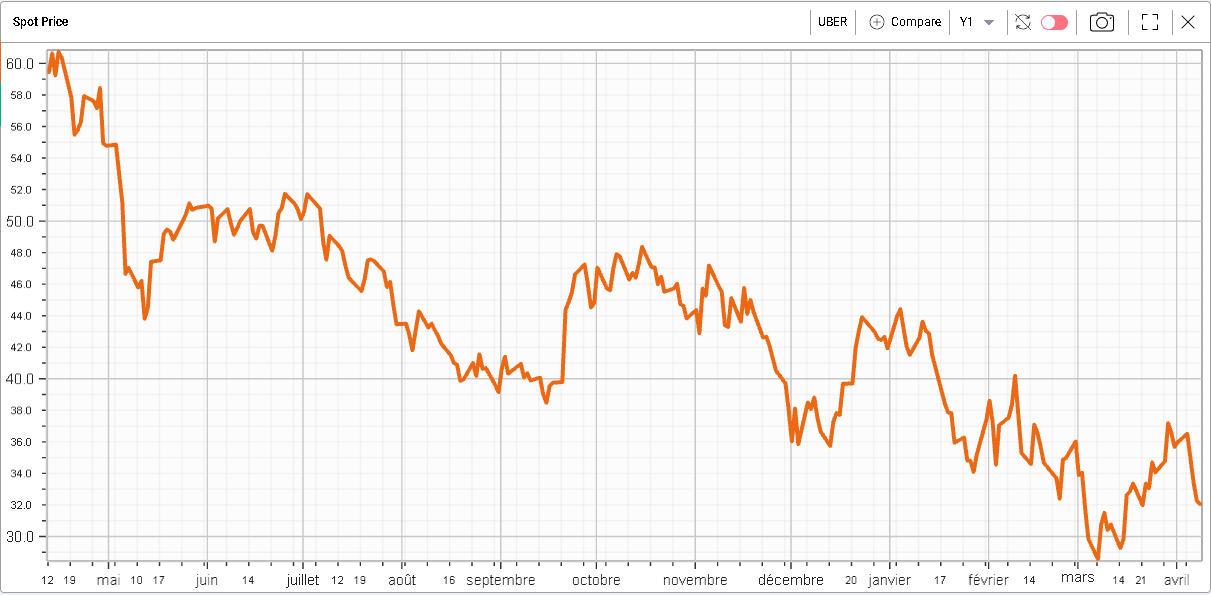
One example is Uber which has generated negative free cash flows for the past 4 years. Looking at the stock performance year to date, it has underperformed the NDX by 13.9%. |
Uber stock price – Last 12 months |
It is also important to recognize that the market is acutely aware of this fact as evidenced by the underperformance of Uber against Apple. The trader should have an understanding of the companies he trades and be able to recognize if the current discount offers sufficient or insufficient value to trade it one way or another. |
Disclaimer - This information is provided for general information and marketing purposes only. The content of the presentation does not constitute investment advice or a recommendation. IVolatility.com and its partners do not guarantee that this information is error free. The data shown in this presentation are not necessarily real time data. IVolatility.com and its partners will not be liable for any loss or damage, including without limitation, any loss of profit, which may arise directly or indirectly from the use or reliance on the information. When trading, you should consider whether you can afford to take the high risk of losing your money. You should not make decisions that are only based on the information provided in this video. Please be aware that information and research based on historical data or performance do not guarantee future performance or results. Past performance is not necessarily indicative of future results, and any person acting on this information does so entirely at their own risk. |