Puts and Calls with best Risk/Reward on NVDA |
US and Chinese markets sold off while European and Japanese markets managed to stay relatively flat. The NDX continues to be the most sold and finished down 2.35%. SPX finished 1.7% lower while the DJIA finished down 1.2%. |
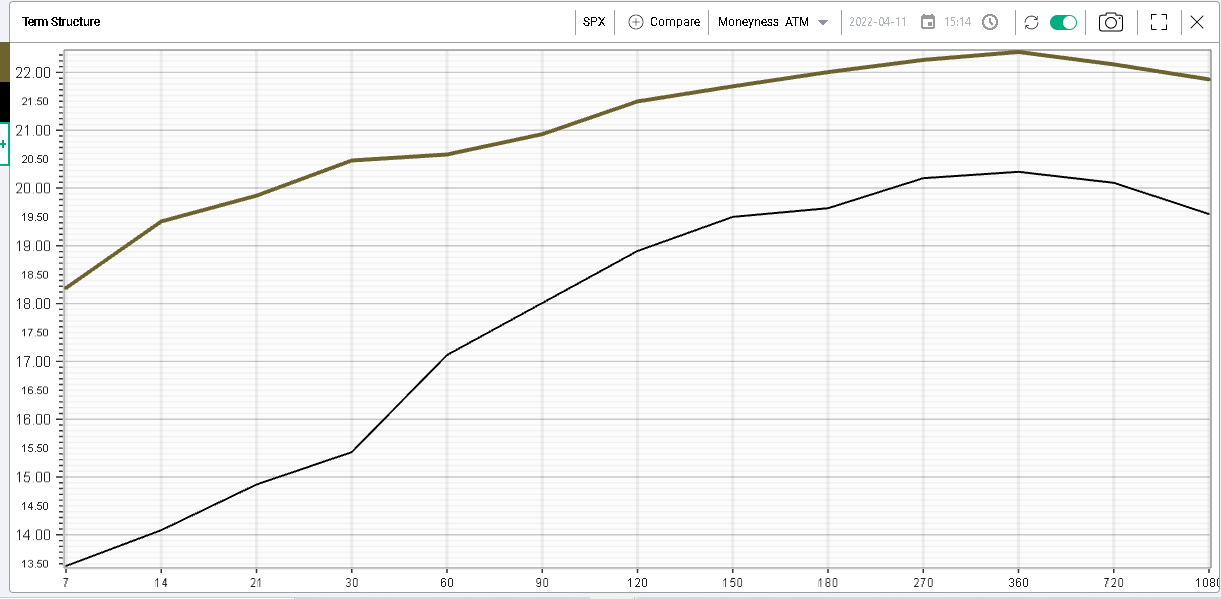
Looking at implied volatilities, they have started to react and move higher led by the front-end. It is interesting to note that the SPX curve remains upward slopping for now. |
Term Structure for the SPX, yellow is 2022-04-11 vs 2022-04-01 |
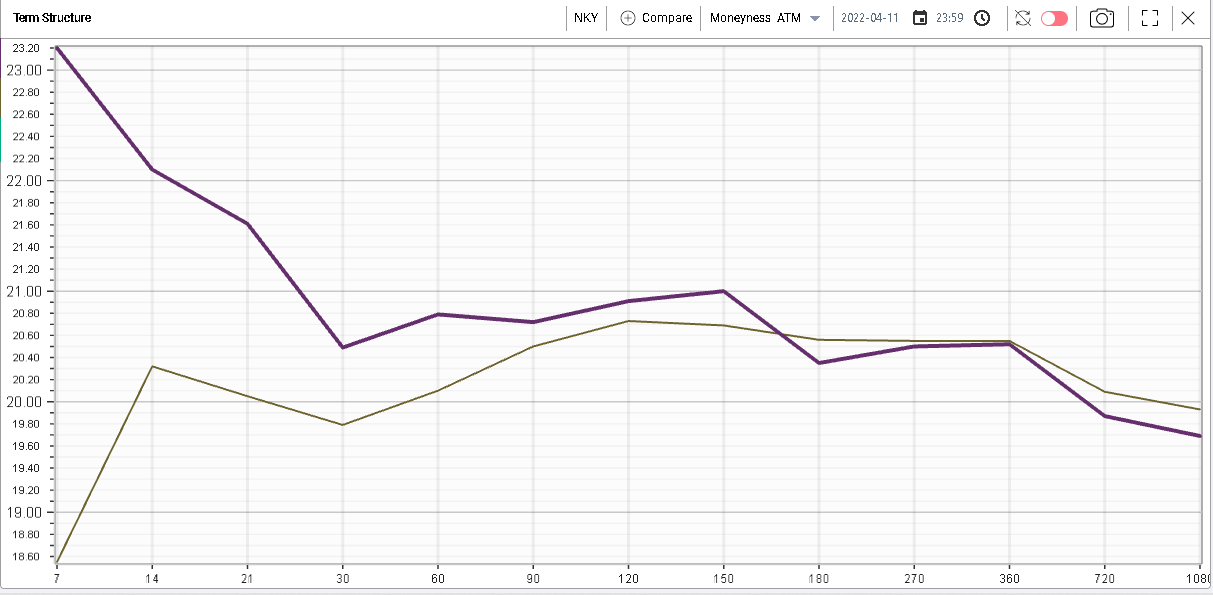
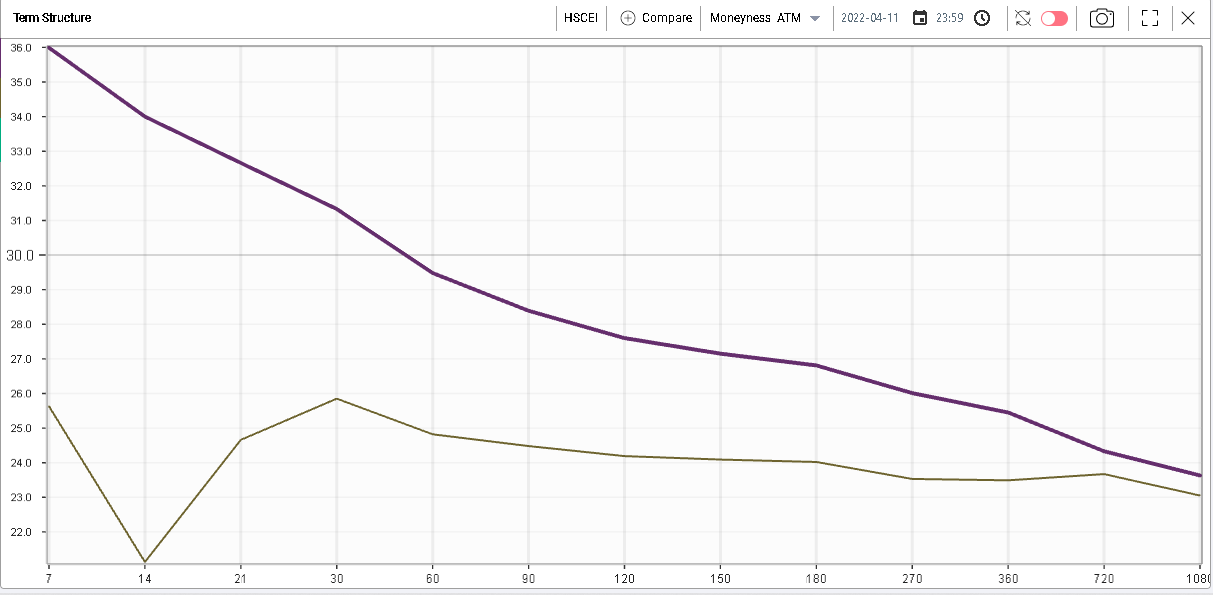
This is an exception for global indices where in Europe term structures are slightly inverted and over in Asia they are already inverted by a significant amount. |
German DAX – 2022-04-11 in purple vs 2022-04-01 in yellow |
Nikkei (Japan) – 2022-04-11 in purple vs 2022-04-01 in yellow |
HSCEI (China) – 2022-04-11 in purple vs 2022-04-01 in yellow |
Although the outright shape of the term structure may seem strange at first sight, the absolute level looks fairly logical considering the amount of risk for each of the zones considered. |
|
On the chart above, we can see: |
|
Considering the backdrop for Chinese equities with a risk of a further economic slowdown on the back of tighter Covid controls, a still unresolved complex situation for the real estate sector and the risk that the government will continue to look into the companies, it is not surprising that it would be priced at the highest level of volatility. |
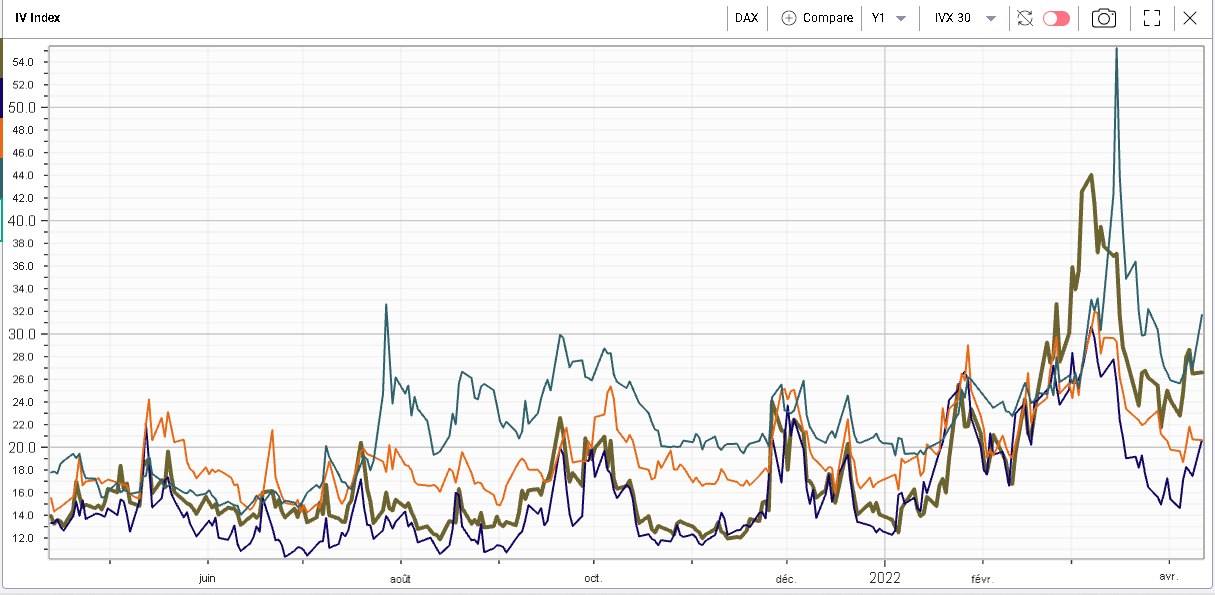
Europe has really been suffering from the conflict that broke down in Eastern Europe. If we look back at 2021, we can see that the DAX and the SPX were pretty much trading in line for the whole year but that this relationship broke down at the end of February. |
As the FED continues to distribute its more hawkish message, the SPX IVX has remarked slightly higher and looks set to overtake the NKY implied volatility. |
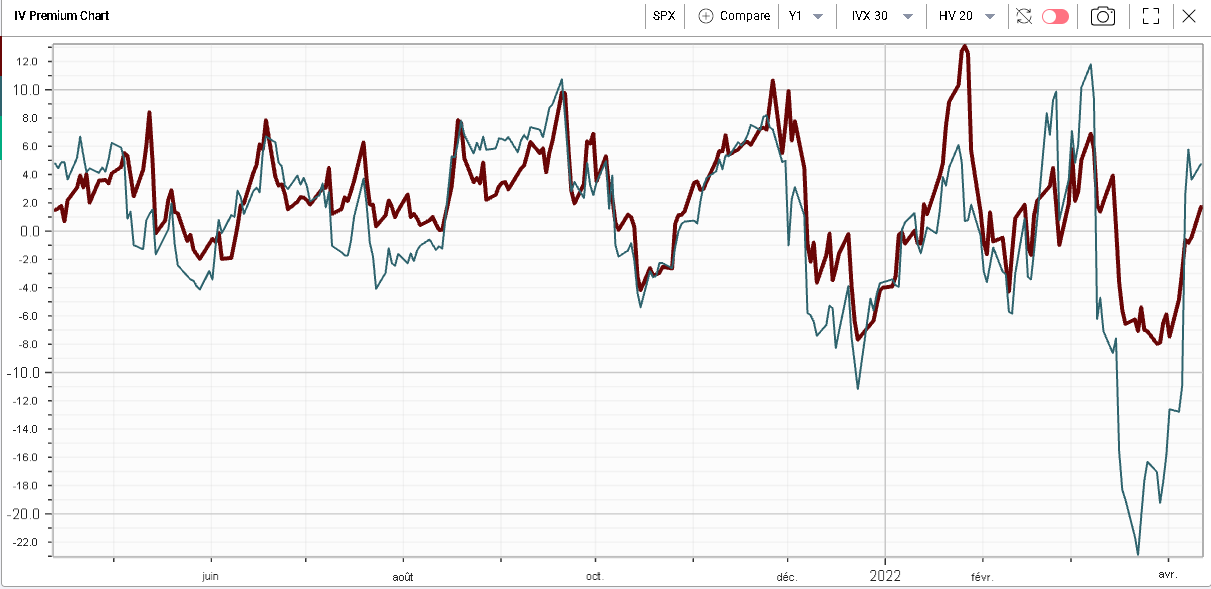
Looking at the IVX premium chart and comparing 30d IVX with 20d HV, we can see that 30d implied volatility for the SPX is around 2 points higher than the realized volatility over the last month while 30d IVX is around 5 points higher than its most recent realized volatility for the German DAX. |
|
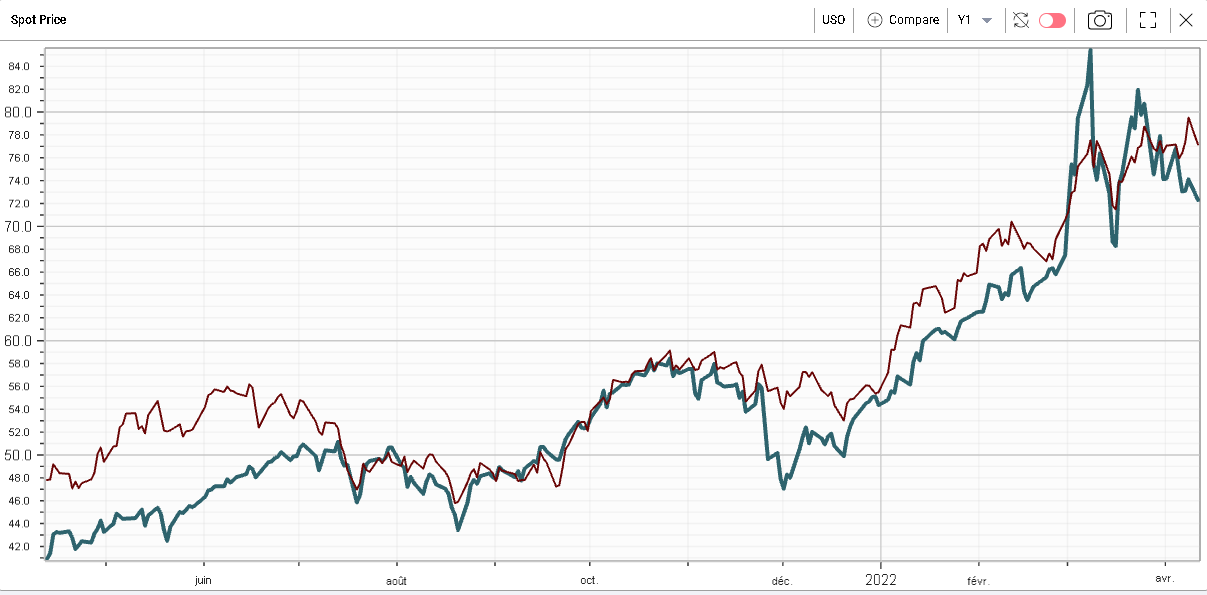
Looking at sectors, the energy was the worst performing sector on the day down 3%. Comparing the USO (Oil Fund ETF / Blue line below) with the XLE (Energy Equities ETF / Red line below), we see that they have slightly decorrelated recently with stocks holding firm despite Crude Oil prices dropping. The correlation between the two is obviously not 100% but they seem to have moved in sync for the best part of the last 12 months and it will be interesting to see what happens over the next few days. |
|
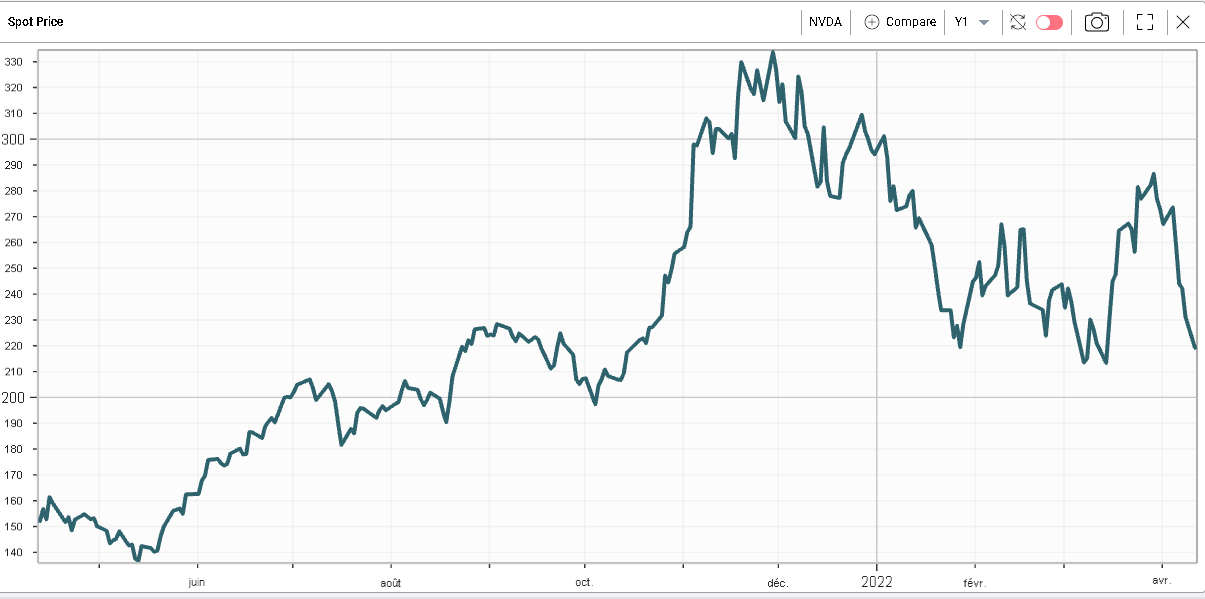
Looking at NDX components, one name that has seen some selling pressure over the past few days has been NVDA. |
|
The stock is down around 20% over the past 5 days and about 27% lower for the year so far. Looking at implied volatility in the name it is still trading lower than where it settled the last two times that the stock traded around $230. |
Using the RT Spread Scanner, we can look for opportunities either to play a continuation of this move lower or to fade it and look for structures that will allow us to gain exposure on the upside. |
Looking for Naked calls no further than 20% out of the money and offering a risk/reward of no more than 10%, we can find some ideas: |
|
For instance, the 29th Apr 255c are offered at 1.55 and give a potential reward of $1,770 for $155 of risk. |
Puts offer slightly less attractive risk/reward ratios but still allow traders to gain exposure for a fraction of the potential gain. |
|
Do note that earnings are expected to be outside of the May expiration but it is possible to find structures that should include earnings, for instance on the put side: |
|
And on the call side: |
|
Disclaimer - This information is provided for general information and marketing purposes only. The content of the presentation does not constitute investment advice or a recommendation. IVolatility.com and its partners do not guarantee that this information is error free. The data shown in this presentation are not necessarily real time data. IVolatility.com and its partners will not be liable for any loss or damage, including without limitation, any loss of profit, which may arise directly or indirectly from the use or reliance on the information. When trading, you should consider whether you can afford to take the high risk of losing your money. You should not make decisions that are only based on the information provided in this video. Please be aware that information and research based on historical data or performance do not guarantee future performance or results. Past performance is not necessarily indicative of future results, and any person acting on this information does so entirely at their own risk. |
