It’s not just about earnings! |
JPM kicked off the earnings season yesterday and the numbers seem to be slightly below market’s expectations. The overall message from the bank was also quite cautious with an extra $900 million set aside as CEO Jamie Dimon mentioned the existence of “storm clouds on the horizon”. |
This did not prevent the broader market from rallying as the idea that the inflation peak may have already happened is starting to spread around following the slightly lower than anticipated core CPI numbers on Tuesday. |
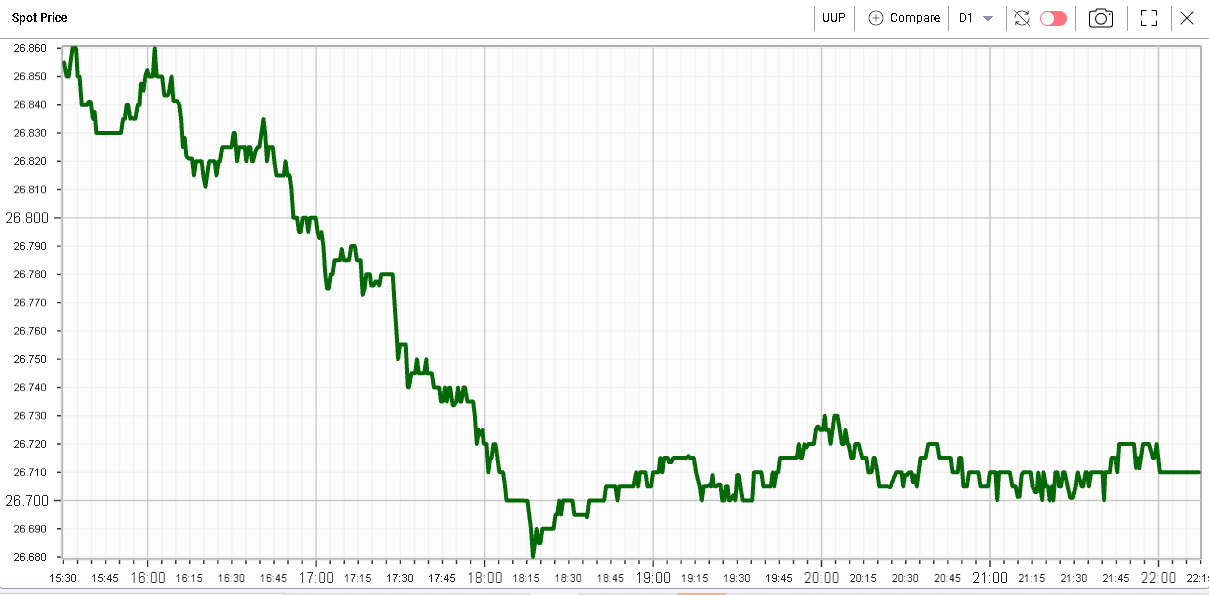
The USD measured here by UUP traded slightly lower over the day after being up about 3.6% on the year. |
|
|
Rates have also corrected with the 10y back at 2.68% vs a high of 2.84% just before the CPI print. |
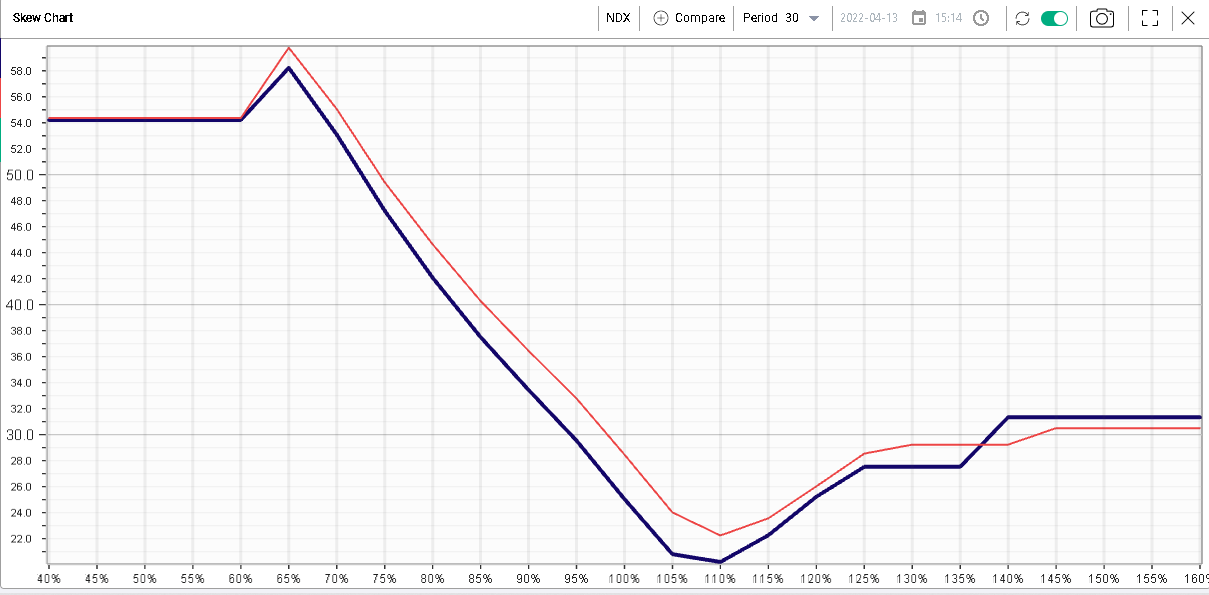
This backdrop probably explains why the NDX managed to gain about 2% yesterday while implied volatilities also reset lower with 30d atm IV down about 3.5 points. |
|
In terms of sectors, the consumer discretionary space was the strongest sector yesterday up 2.5%. The technology space was also pretty strong up more than 1.5%. On the other hand, the more defensive sectors such as utilities, staples or healthcare underperformed. |
Following the pretty upbeat reporting by DAL which finished more than 6% higher on the day, BA was also pretty strong and closed up by about 4%. |
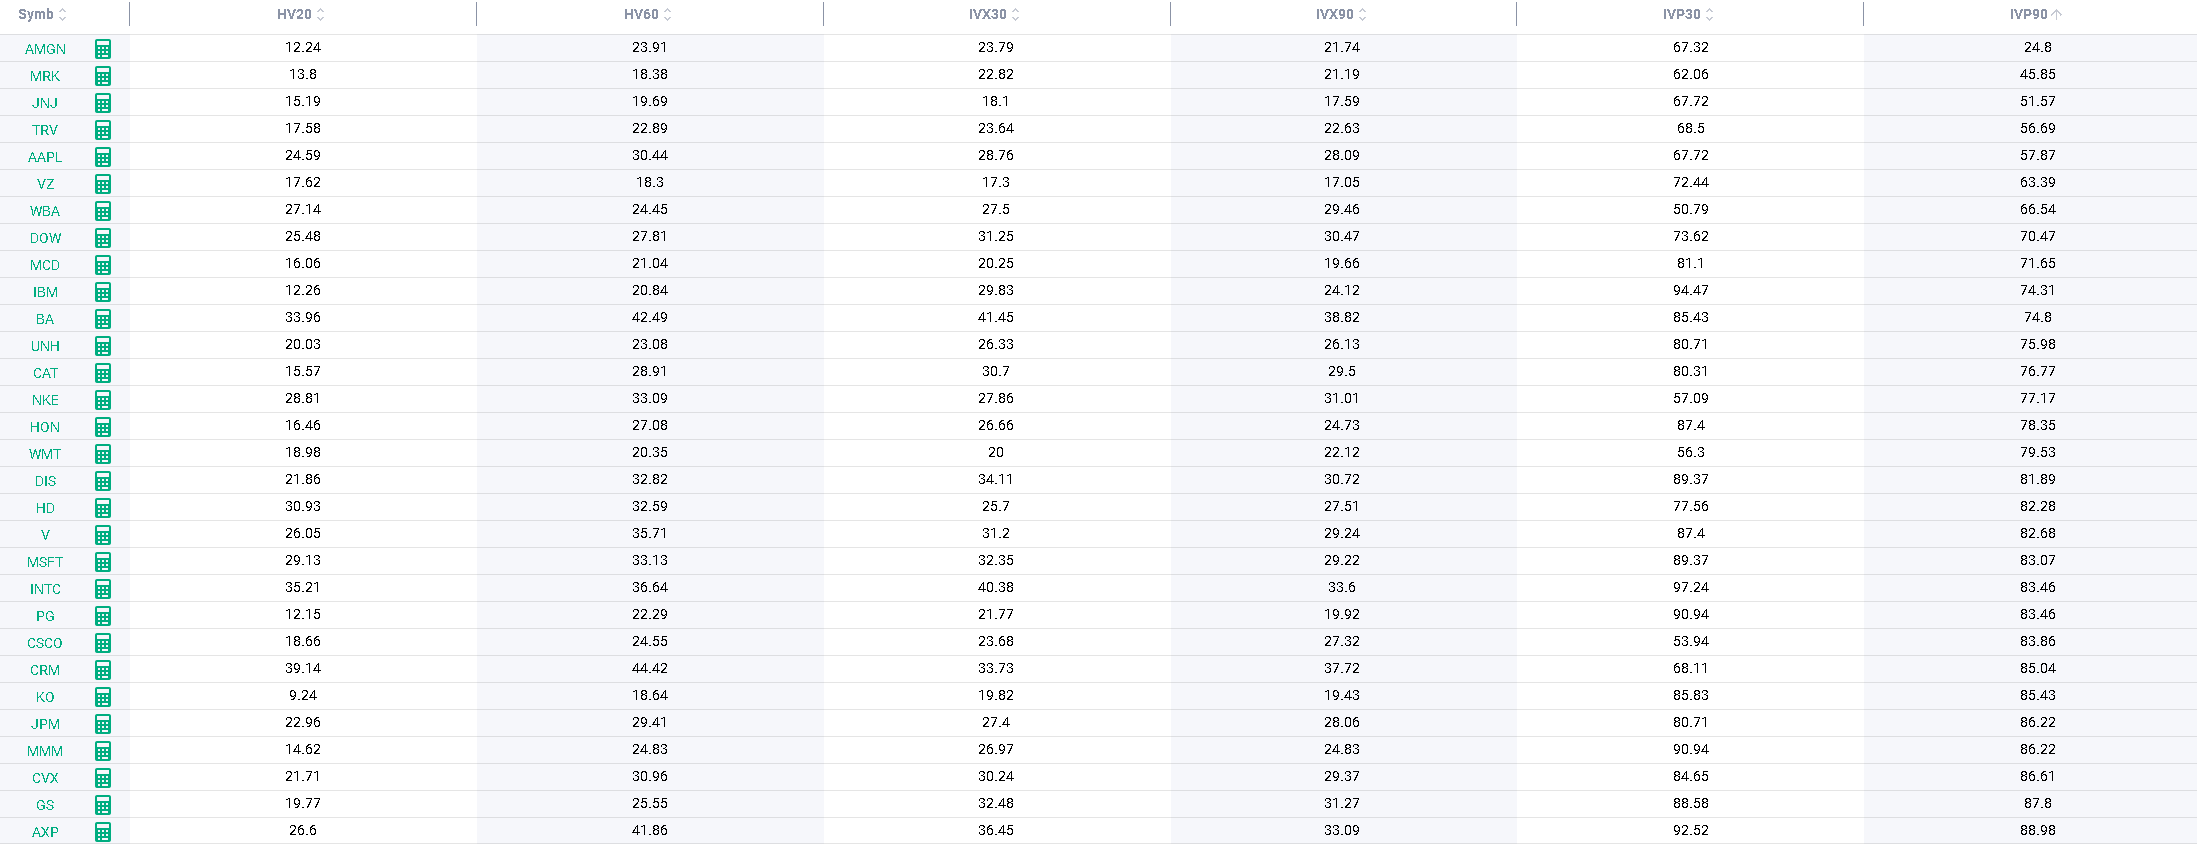
Looking at implied volatilities across the DJIA, we find that the volatility levels are quite spread around. |
|
First, using the IVP90, the last 12 months percentile for the 90d IVX, we see that the vast majority of implied volatilities are still trading at elevated levels historically with percentiles above 80 for almost half of the stocks. |
Financials seem to remain a source of worry for traders with GS 90d IVX at 31.27, 88th percentile while JPM is trading at 28.06, 86th percentile. This is happening as realized volatilities in those names are not particularly high relative to implied. We have 20 days realized volatility for JPM at 22.96 and 19.77 for GS. |
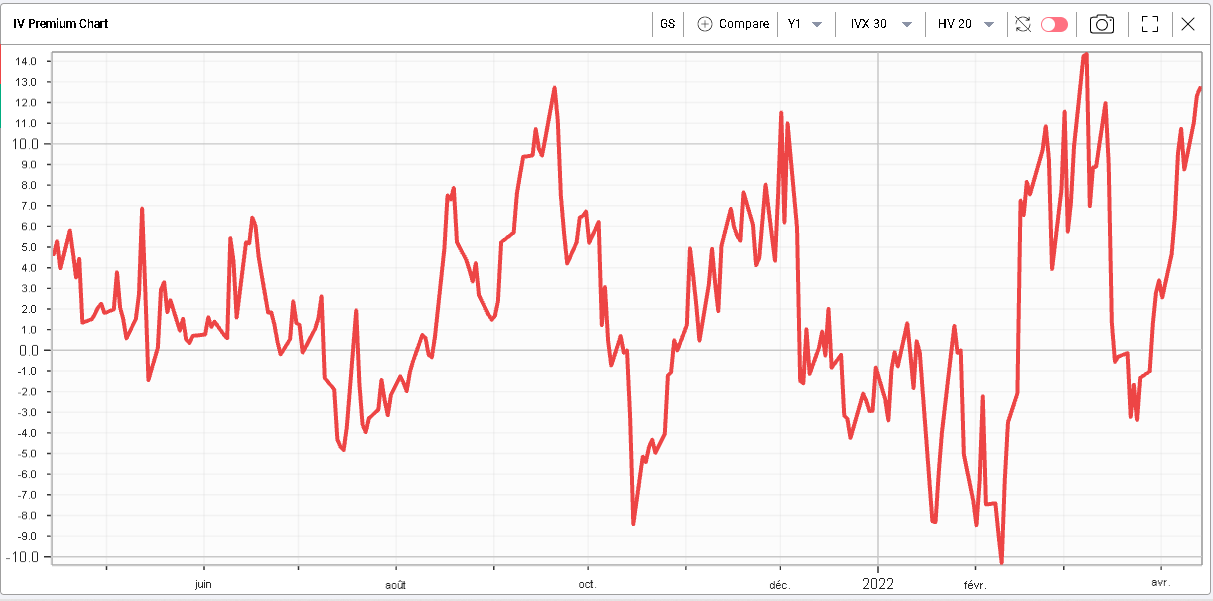
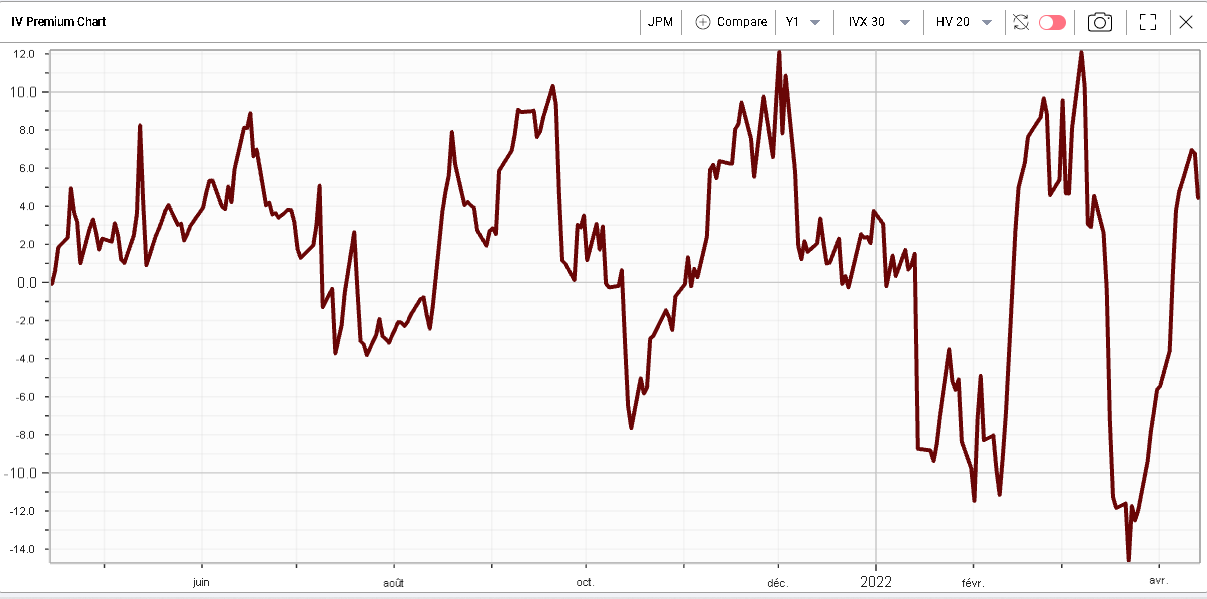
This creates a situation where GS 30d/20d IVX Premium is trading pretty much at its highest level over the past 12 months. |
|
Earnings could be part of the explanation although a similar picture is visible in JPM despite having reported earnings already. |
|
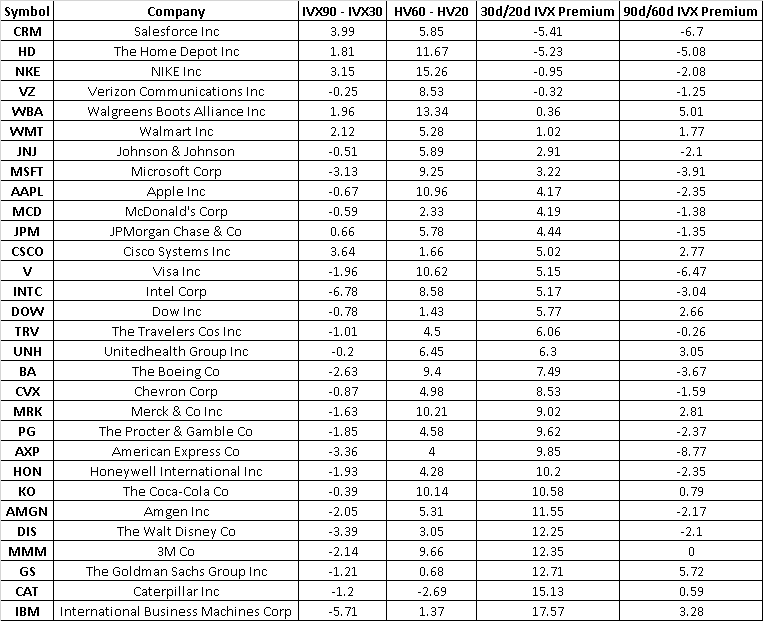
Looking at the IVX Premium both measured as 30d/20d and 90d/60d for all stocks in the DJIA, we get the following table: |
|
Whenever IVX90 – IVX30 is negative and 30d/20d IVX Premium is elevated relative to 90d/60d IVX Premium, it is generally a sign that the market is more concerned about possible short-term developments that would increase the volatility in the name. |
For some stocks the upcoming earnings would be a possible explanation for this dislocation and once the event has passed, we could expect the IVX premium to normalize. |
On the other hand, when both IVX Premia are high, this could be related to an increase in specific risk for that company or the sector in which it operates. |
It is important to remember than most HV60 will look elevated because they include the higher realized volatility of the end of February/beginning of March. Considering that HV20 is trading significantly lower, we could expect 90d/60d IVX Premium to trade negative for most cases. |
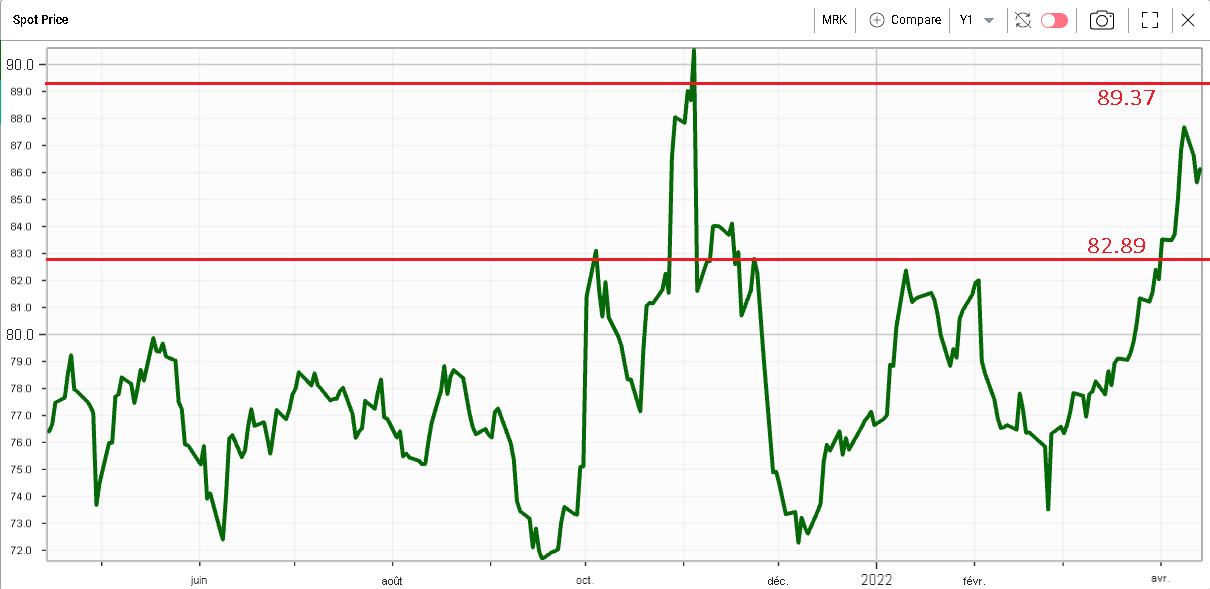
Looking at the above table, some names in the healthcare space look different such as UNH or MRK. For MRK, the stock has been fairly strong so far this year and has rebounded pretty aggressively from the lows of Feb/Mar. |
|
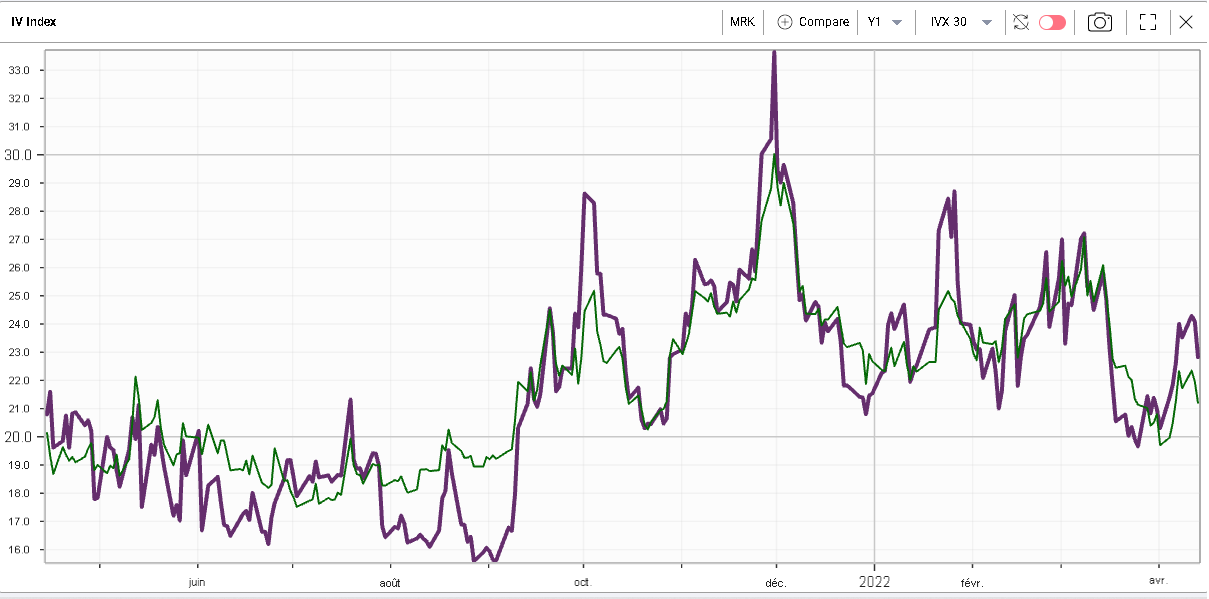
Looking at the 30d IVX and 90d IVX, we can see that short term implied volatilities are trading at a premium to longer term volatilities. This is best explained as the company will be reporting earnings at the end of April. |
|
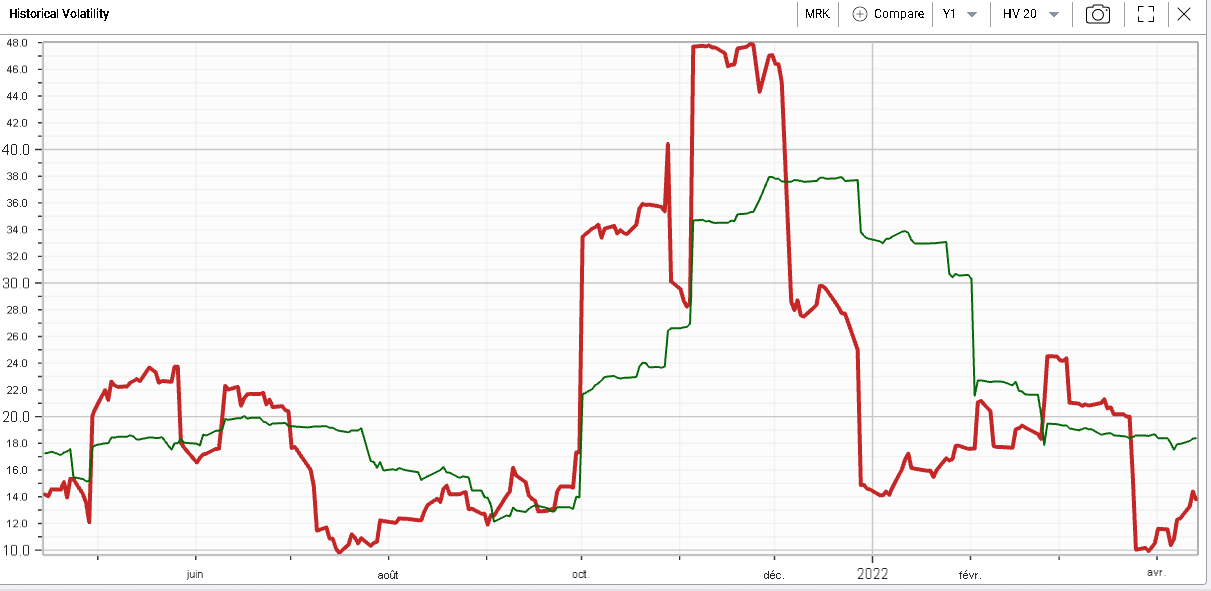
Looking at the 20d realized volatility in red vs the 60d realized volatility in green, we can see that the short term realized volatility points to relatively low levels of realized around 14. |
|
This explains why the short term IVX Premium seems to be at its highest level of the last 12 months. |
|
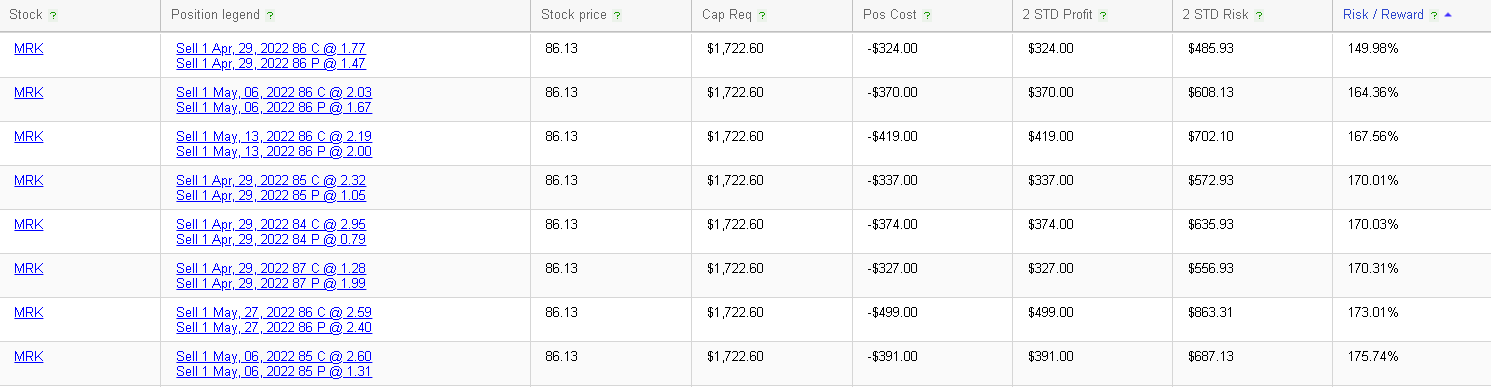
Using the RT Spread Scanner, we can get an idea of the attractiveness of short straddles with short dated expirations. The system automatically sorts the possibilities that present the most attractive risk/reward ratios depending on the criteria we select. |
|
Looking at the 29th Apr’22 86 straddles, they are priced at 3.24 which gives us the below boundaries for the short or long straddles. |
|
Disclaimer - This information is provided for general information and marketing purposes only. The content of the presentation does not constitute investment advice or a recommendation. IVolatility.com and its partners do not guarantee that this information is error free. The data shown in this presentation are not necessarily real time data. IVolatility.com and its partners will not be liable for any loss or damage, including without limitation, any loss of profit, which may arise directly or indirectly from the use or reliance on the information. When trading, you should consider whether you can afford to take the high risk of losing your money. You should not make decisions that are only based on the information provided in this video. Please be aware that information and research based on historical data or performance do not guarantee future performance or results. Past performance is not necessarily indicative of future results, and any person acting on this information does so entirely at their own risk. |