Are Industrials waking up? |
Markets traded higher yesterday as earnings season gets underway. The NDX led the way and closed 2.15% higher, the SPX finished 1.61% higher and the DJIA was up 1.45%. |
Afte r the close Netflix reported earnings which disappointed investors. The stock is currently trading about 25% lower in Germany. |
At the sector level, consumer discretionary stocks continue to perform well. We flagged NKE’s performance at the end of last week and the company continued to push higher. The stock was up another 4% yesterday. The Communication sector as well as the Tech sector were both up about 2%. |
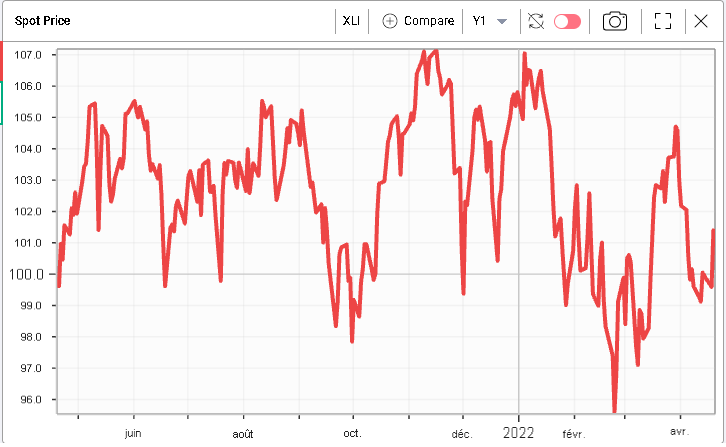
Industrials also performed well up 1.8% on the day. The sector has been pretty underwhelming over the past 12 months with little going on. The below chart shows the 12 months spot price performance for the XLI ETF. |
|
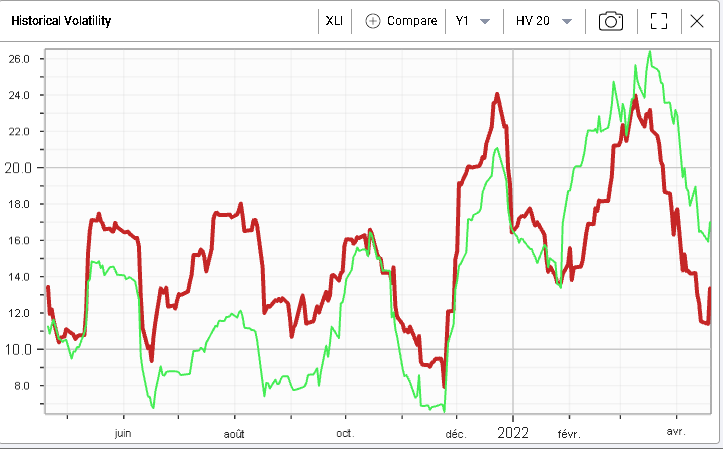
As a result, despite all the developments both locally and globally, realized volatility has been fairly subdued for the space. On the chart below, we look at the 20d historical volatility in red for the XLI compared with the 20d historical volatility of the SPX in green. Â We can see that for pretty much all of 2021, XLI was realizing more than the SPX but since Dec’21 this has inverted and the SPX is now realizing over XLI. |
|
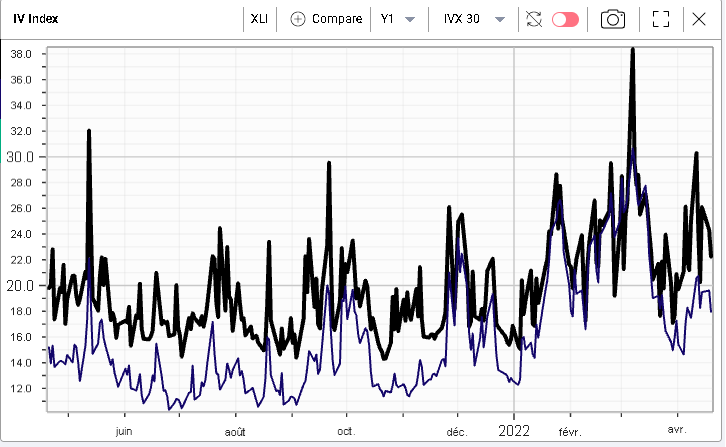
Implied volatility shows a different picture with the 30d IVX for the XLI (in black) trading at a premium to the SPX (in blue). |
|
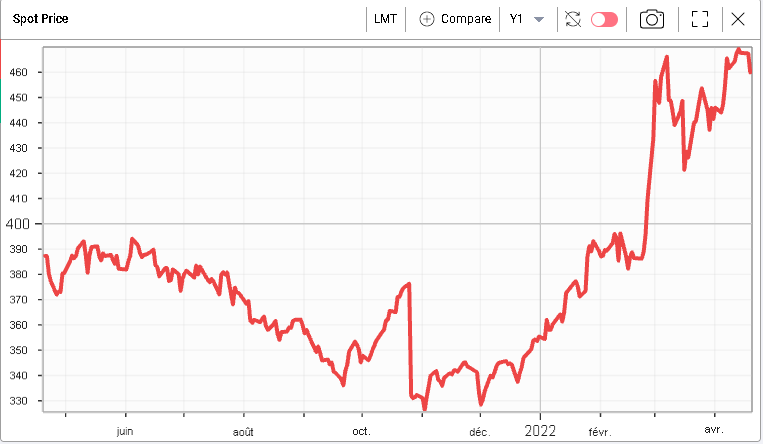
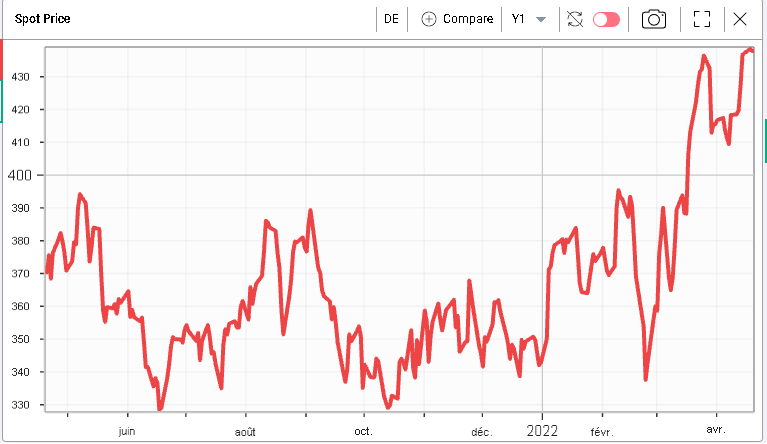
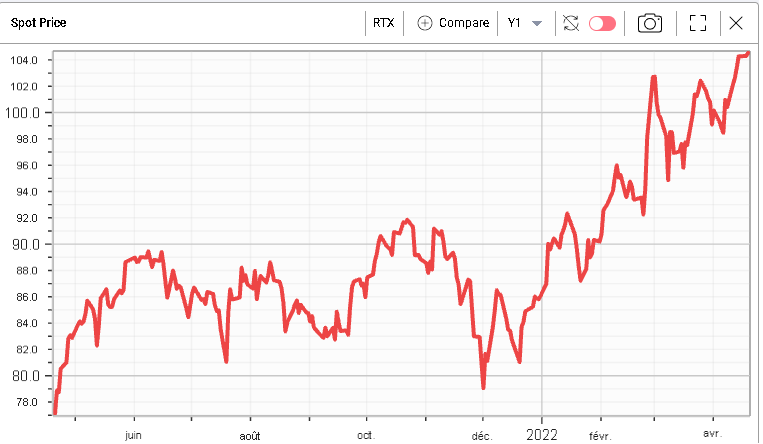
Within the sector stocks have behaved in very different ways. For instance, below, we show the spot prices over the last 12 months of LMT, DE and RTX respectively up by 29.8%, 26.6% and 21.7%. |
|
|
|
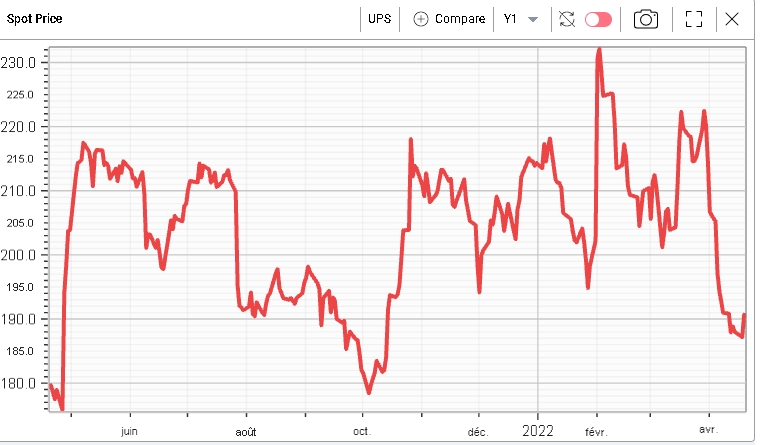
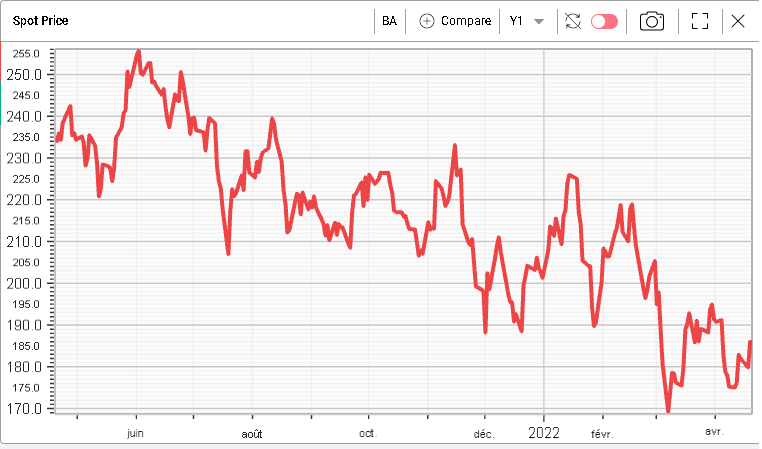
On the other hand, some names have really struggled so far this year for instance MMM, UPS or BA are down respectively 15.8%, 11.1% and 8.7%. We show their spot prices over the last 12 months below: |
|
|
|
The rest of the components of the XLI are pretty much unchanged on the year. As a result, there are two conflicting forces at play to understand why the XLI has performed so quietly. First, there has been losers and winners and the market capitalization given up by those that went lower has pretty much been compensated by the market capitalization gained by those that went up. Second, there are a handful of stocks that have not yet managed to gain or lose value in 2022. |
Covered calls are a popular strategy for traders looking to keep some exposure to a stock that has performed well while acknowledging the overall bullish performance seen in the underlying. |
Using the RT Spread Scanner can provide incredible insight on how to build an attractive covered call strategy. Please check it out via our free 3 weeks trial. Covered calls are one of the many strategies available in the RT Spread Scanner and the system will automatically search for the most attractive combinations depending on a list of presets that you will be asked to fill. |
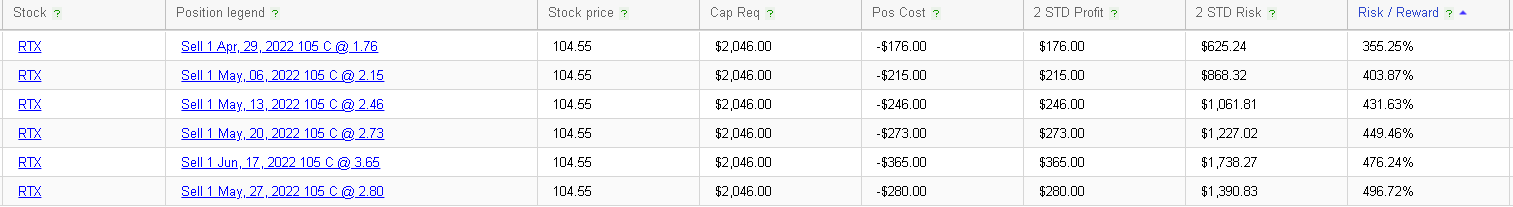
In the below table, we show short term calls to sell in RTX as highlighted by the system and based on Risk/Reward (This sorting mechanism takes into account the possible loss and profit defined by a 2-standard deviation). |
|
The energy space was the only sector lower on the day as Crude Oil prices drop. The sector was down about 1% on the day. |
Earnings for the rest of the week will include amongst others: |
|
PM seems to be highly anticipated by options traders with short dated vols trading about 8 points higher than medium term volatilities. |
Disclaimer - This information is provided for general information and marketing purposes only. The content of the presentation does not constitute investment advice or a recommendation. IVolatility.com and its partners do not guarantee that this information is error free. The data shown in this presentation are not necessarily real time data. IVolatility.com and its partners will not be liable for any loss or damage, including without limitation, any loss of profit, which may arise directly or indirectly from the use or reliance on the information. When trading, you should consider whether you can afford to take the high risk of losing your money. You should not make decisions that are only based on the information provided in this video. Please be aware that information and research based on historical data or performance do not guarantee future performance or results. Past performance is not necessarily indicative of future results, and any person acting on this information does so entirely at their own risk. |