Going nowhere very fast for now |
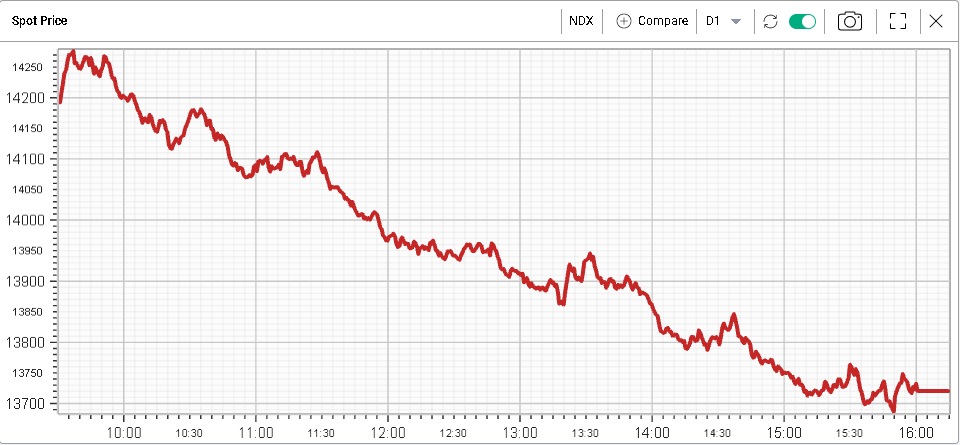
US indices were sold yesterday despite a strong opening print. The slide was fairly continuous throughout the day and the NDX finished 2% lower, the SPX 1.5% and the DJIA 1.05%. |
|
If on any single day the price action can be fairly sanguine both on the upside or the downside, it seems that for now US indices have struggled to find a strong trend over the medium term. Over the past month, the SPX is down around 2.6% and over the past 6 months, the SPX has lost around 3.33%. |
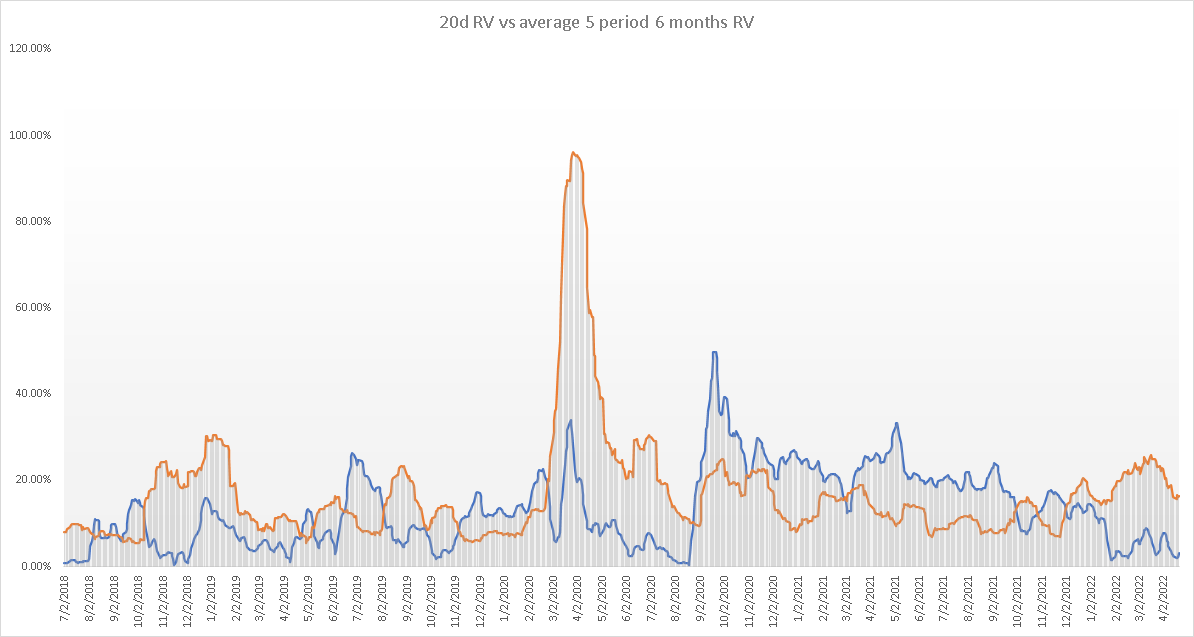
Looking at two measures of volatility we can see that difference quite clearly. First, we observe the realized volatility by its standard daily measure over the last 20 days. This is the orange line below. Second, we measure the realized volatility over an average of 5 periods of 120 days each, this is the blue line. |
| We can see on the chart below that realized volatility when measured over long periods of time has dropped while volatility measured daily has increased. In essence the blue line measures the strength of the momentum in the market ie the persistence of volatility and direction over longer periods of time while the orange line measures the day to day variations. |
If the market goes up and down each day by a large amount then over long periods of time the market will hardly have moved keeping the blue line in check while the daily realized volatility would increase materially. |
|
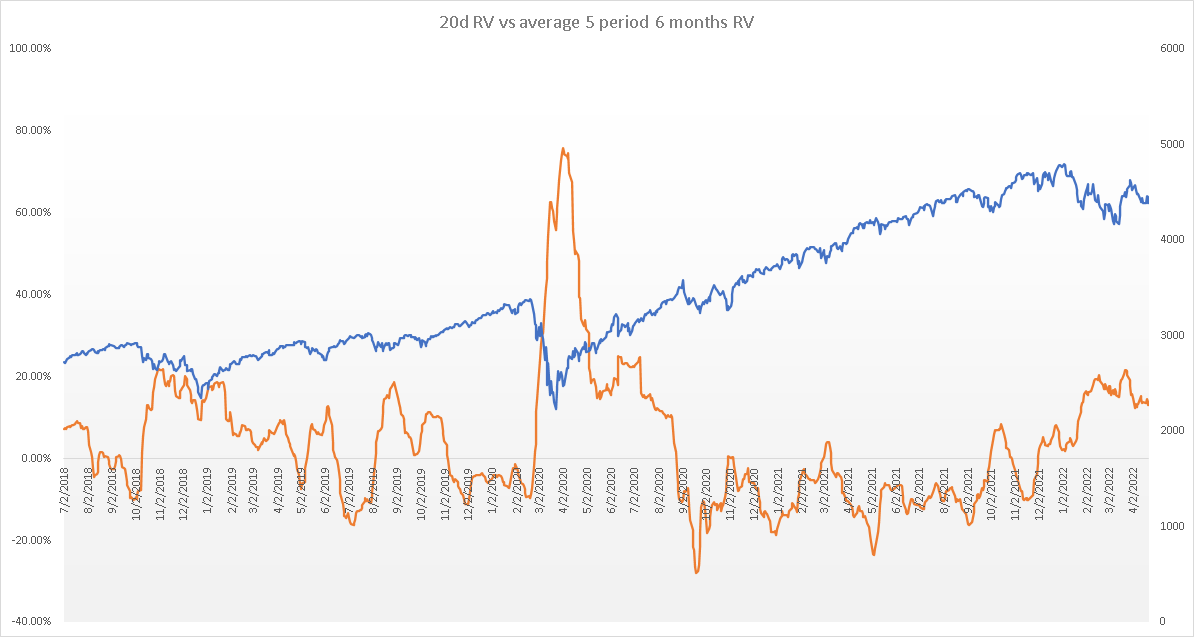
Looking at the spread between those two metrics, we can see that over the past 4 years when the market was in periods of strong momentum and strength, the spread (orange line below) was fairly close to zero and quite often negative. Whenever the market starts to encounter a more difficult period, that spread seems to increase |
|
Looking at the current levels, they are roughly on par with the levels seen at the end of 2018. For options traders this can mean many things but one possible idea is that it might make holding long term options less attractive while short term options might still be able to benefit from higher elevated volatility when measured on a day-to-day basis. |
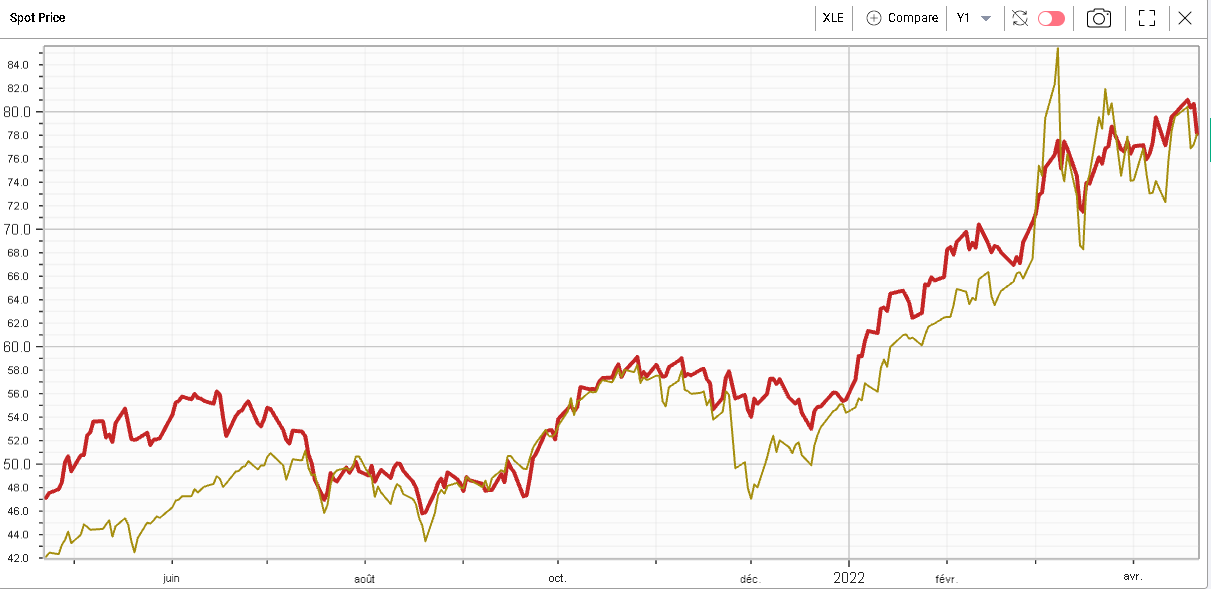
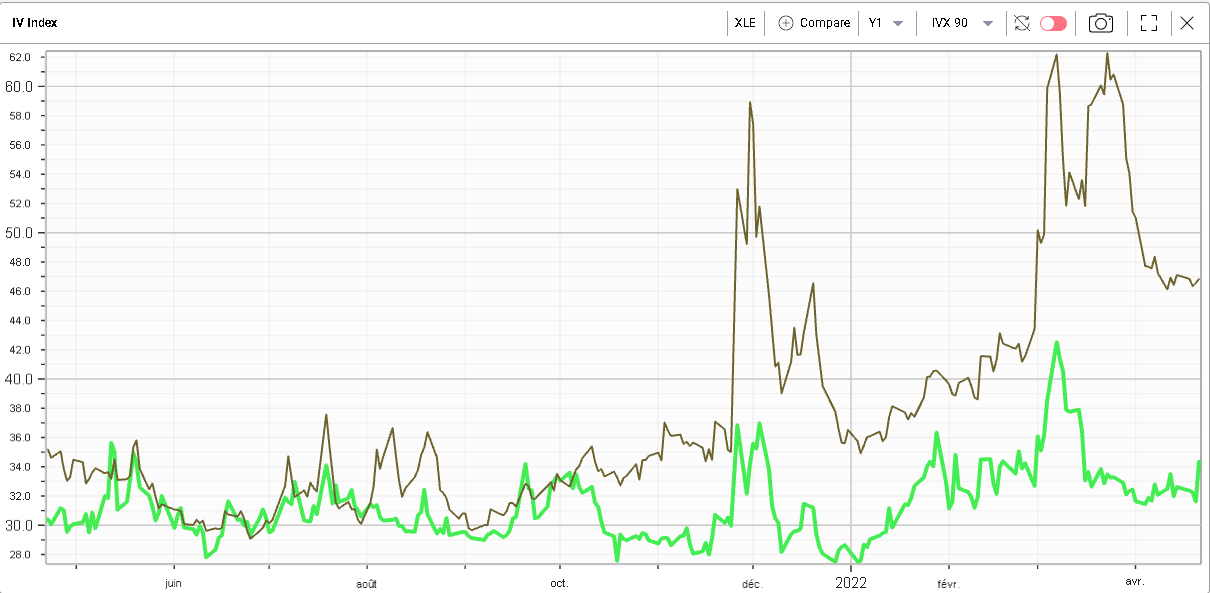
Looking at sectors, the energy space was under pressure yesterday closing about 3% lower. The performance of the XLE (US Energy stock ETF) has remained highly correlated with that of USO (US Oil ETF). |
|
Looking at the implied volatility, we can see that they have decorrelated from their relative proximity up until the last quarter of 2021.The spread for the 90d IVX of Crude Oil (Yellow below) and the 90d IVX for the XLE (Green below) is still elevated over the past 12 months. |
|
This disconnect has been first and foremost driven by the lower realized volatility observed in the XLE compared to USO. Below we show in red the 60d HV for USO and in blue the 60d HV for the XLE. |
|
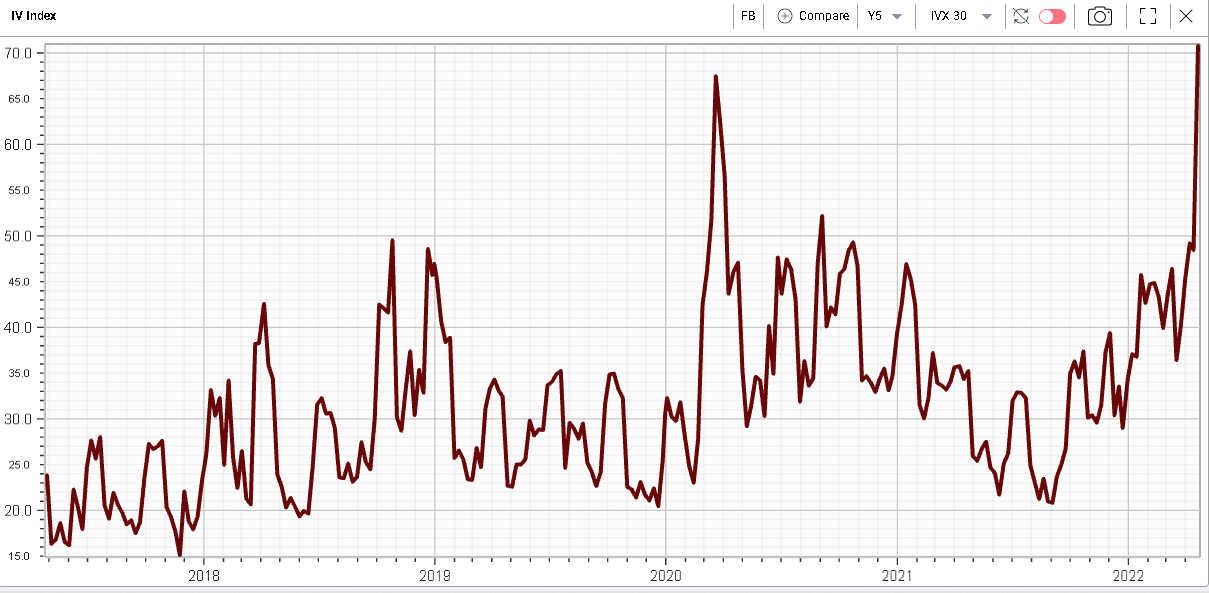
Communications stocks traded lower again yesterday closing about 3% lower led by NFLX which lost another 3.5% and FB which dropped more than 6%. |
Looking at the 30d IVX in FB, we find that it has reached its highest levels over the last 5 years, a sign that market makers are getting really concerned about an outsized move in the name, possibly on earnings. |
|
Disclaimer - This information is provided for general information and marketing purposes only. The content of the presentation does not constitute investment advice or a recommendation. IVolatility.com and its partners do not guarantee that this information is error free. The data shown in this presentation are not necessarily real time data. IVolatility.com and its partners will not be liable for any loss or damage, including without limitation, any loss of profit, which may arise directly or indirectly from the use or reliance on the information. When trading, you should consider whether you can afford to take the high risk of losing your money. You should not make decisions that are only based on the information provided in this video. Please be aware that information and research based on historical data or performance do not guarantee future performance or results. Past performance is not necessarily indicative of future results, and any person acting on this information does so entirely at their own risk. |