Making sense of the noise, looking at HD |
Markets completely reversed Monday's rally and more and the NDX finished 3.9% lower, the SPX 2.81% lower and the DJIA about 2.4% lower. Implied volatilities rallied on the move with 30d IVX for the NDX up about 5 points, 30d IVX for the DJIA up about 6 points and 30d IVX for the SPX up around 4 points. |
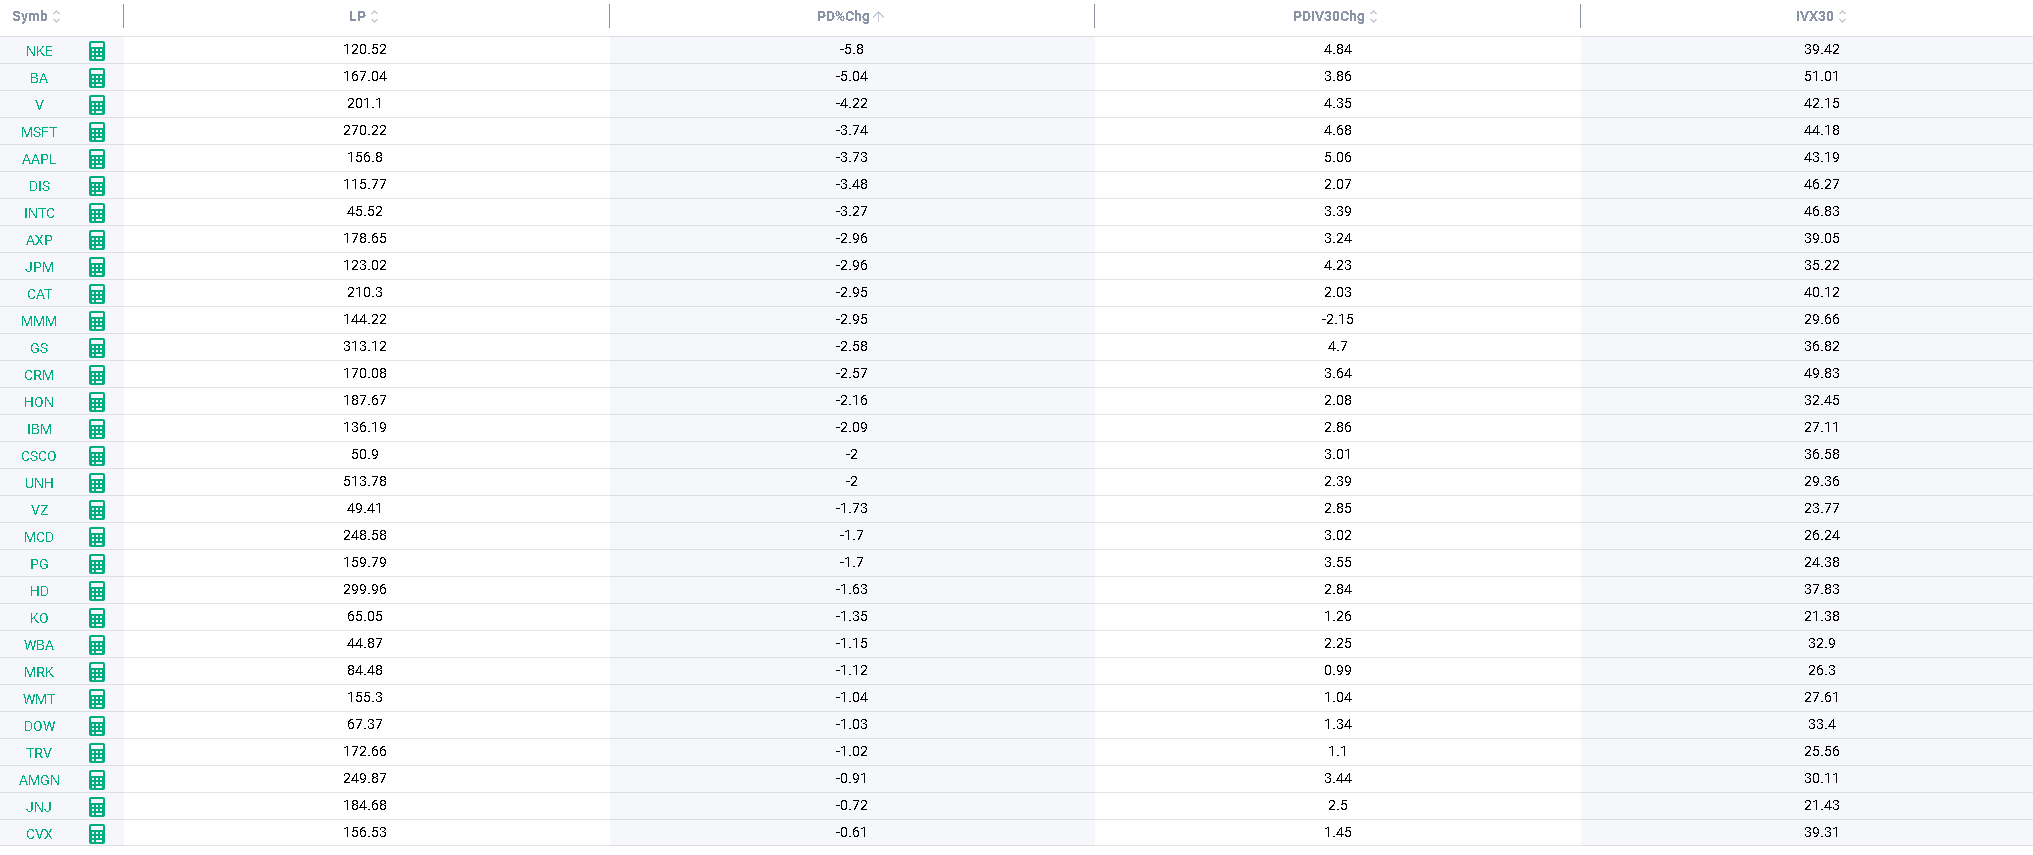
Looking at the DJIA, all components traded lower on the day but it felt like the market was more selective in what was being offered and what was not. |
The below table shows the change on the day as well as 30d IVX change for the components of the DJIA. |
|
We can see that Defensives outperformed while, Tech, Industrials and Consumer Discretionary underperformed. This is a very important distinction because it echoes back to the overall performance of sectors seen in 2022 so far. In other words, the market is very much driven by trend following investors looking to add to stocks that have outperformed in 2022 and to sell those that have underperformed. |
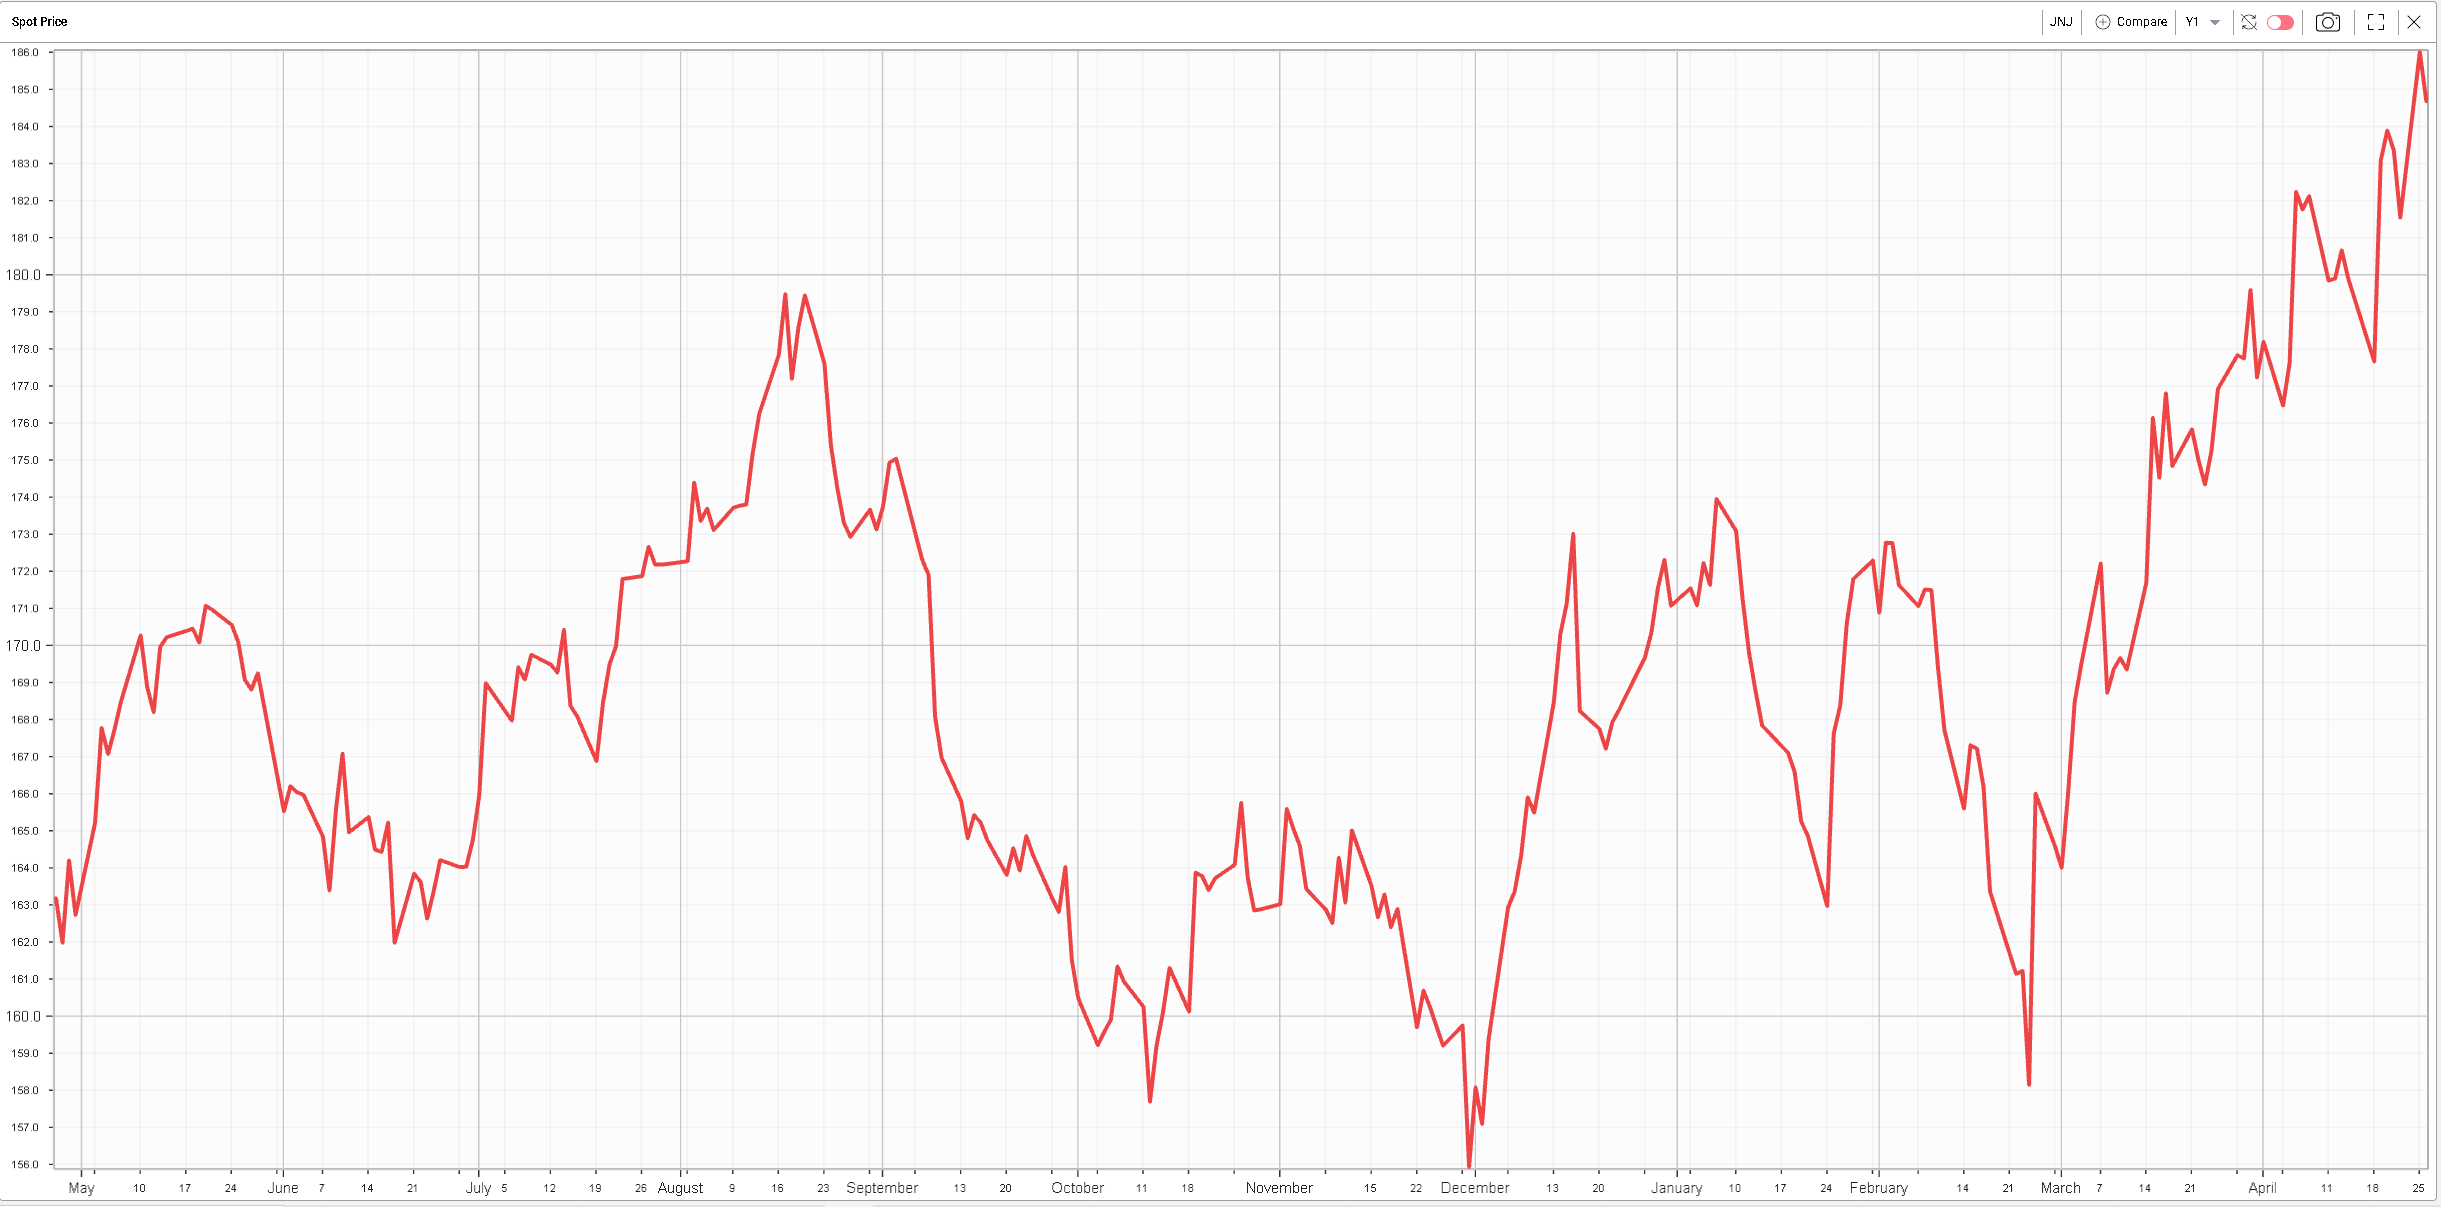
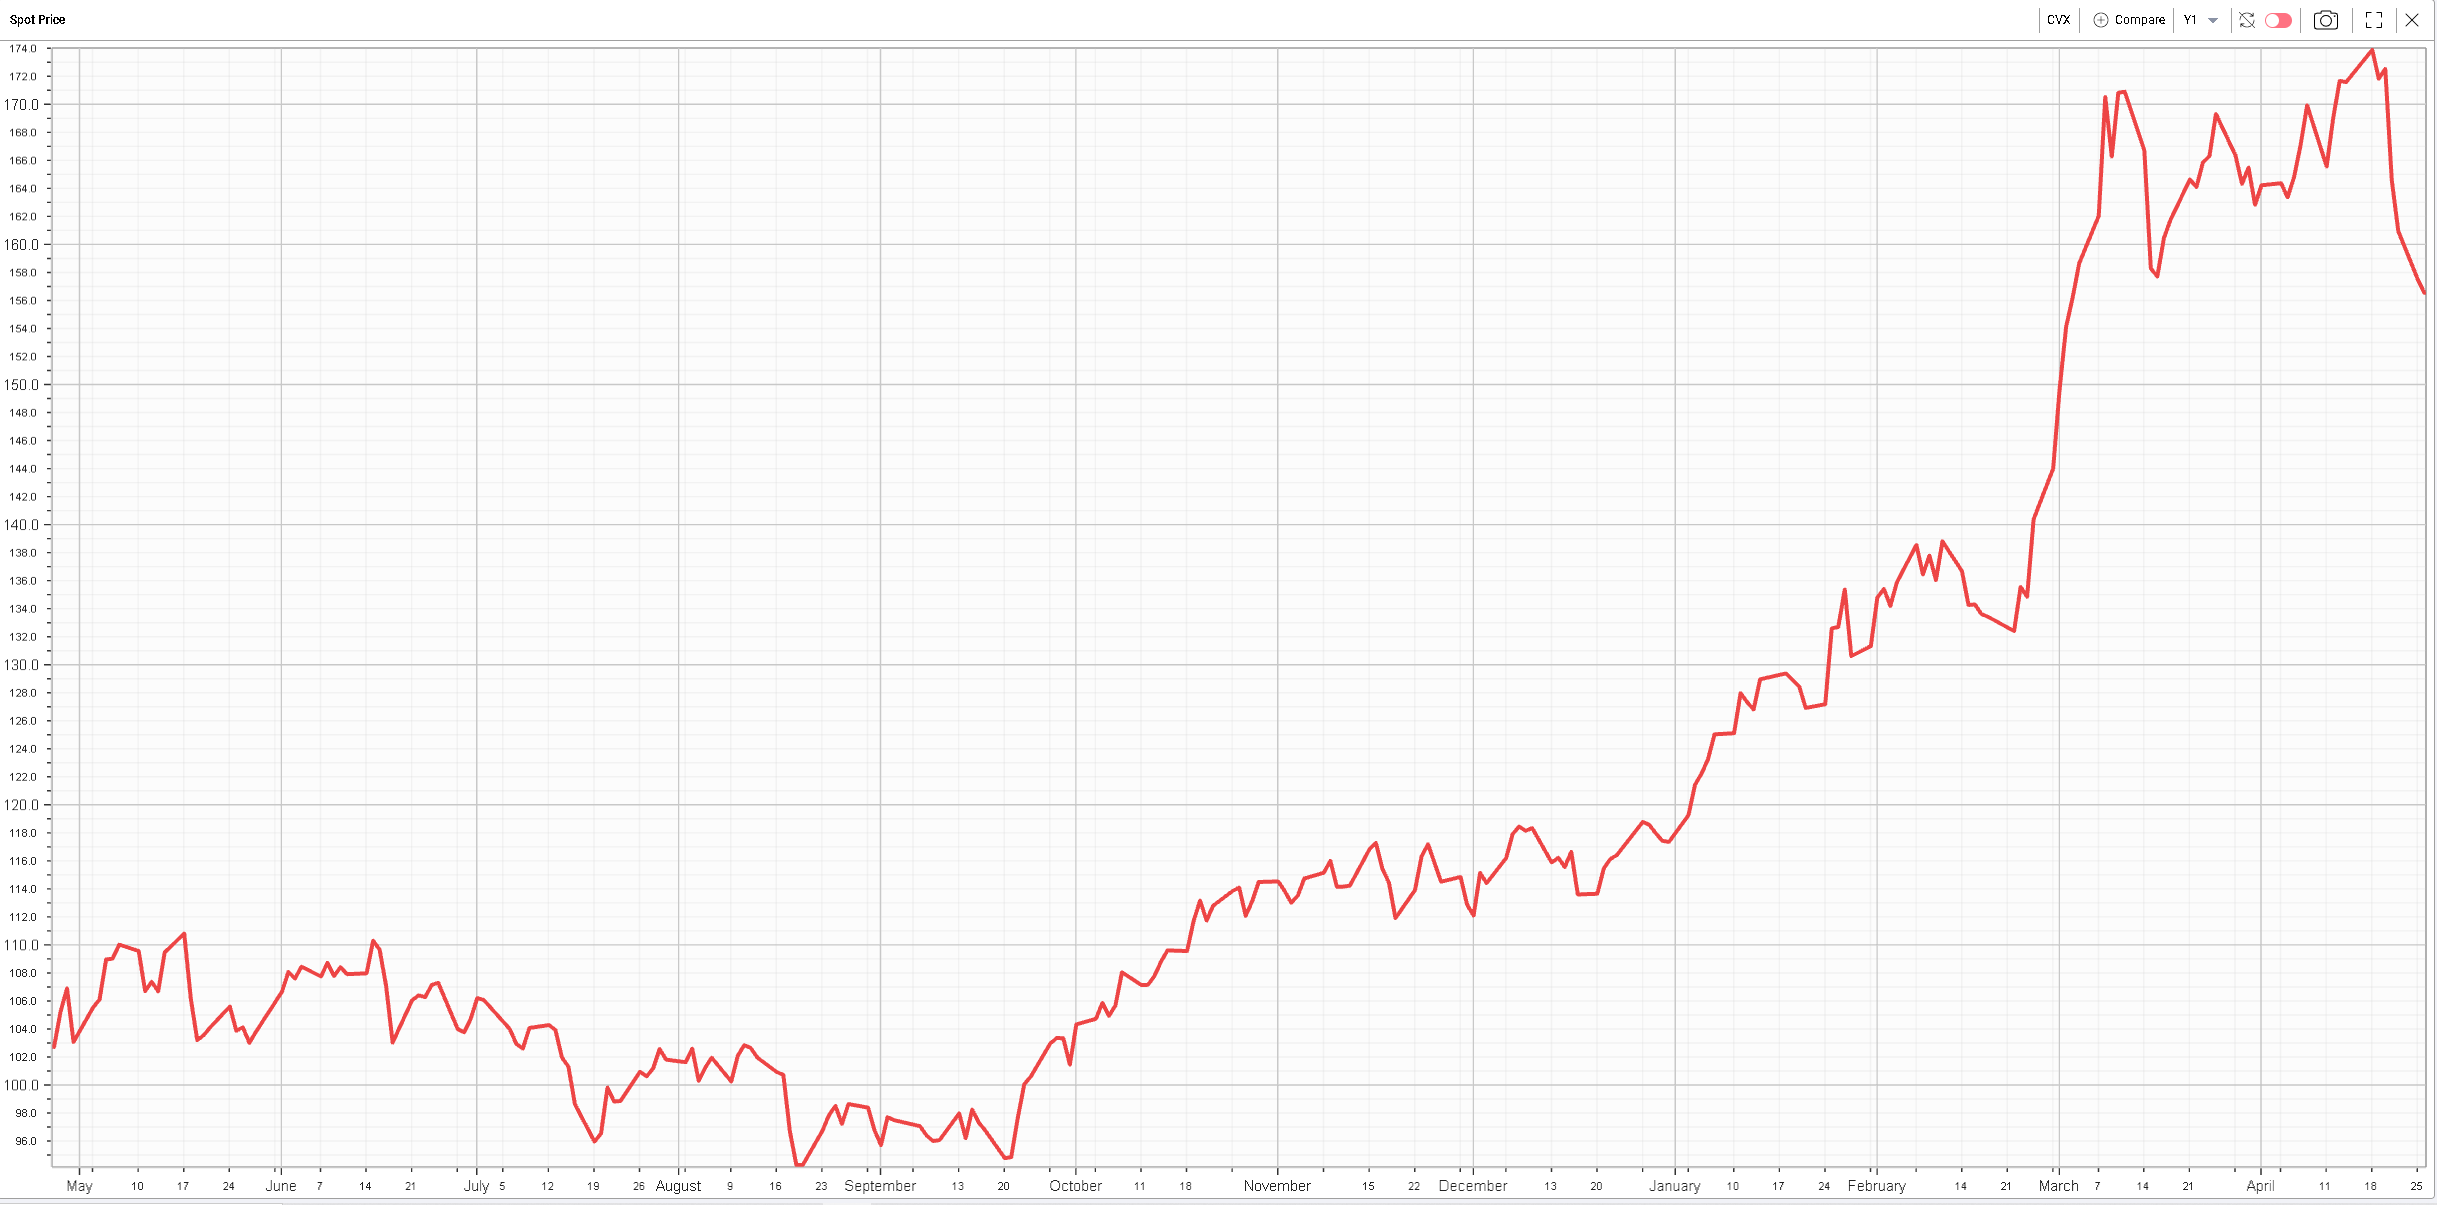
The below spot price shows the performance over the last 12 months of JNJ. Although the stock finished the day lower yesterday it significantly outperformed. Another example shown below is CVX which has been a strong outperformer in 2022 as well. |
|
|
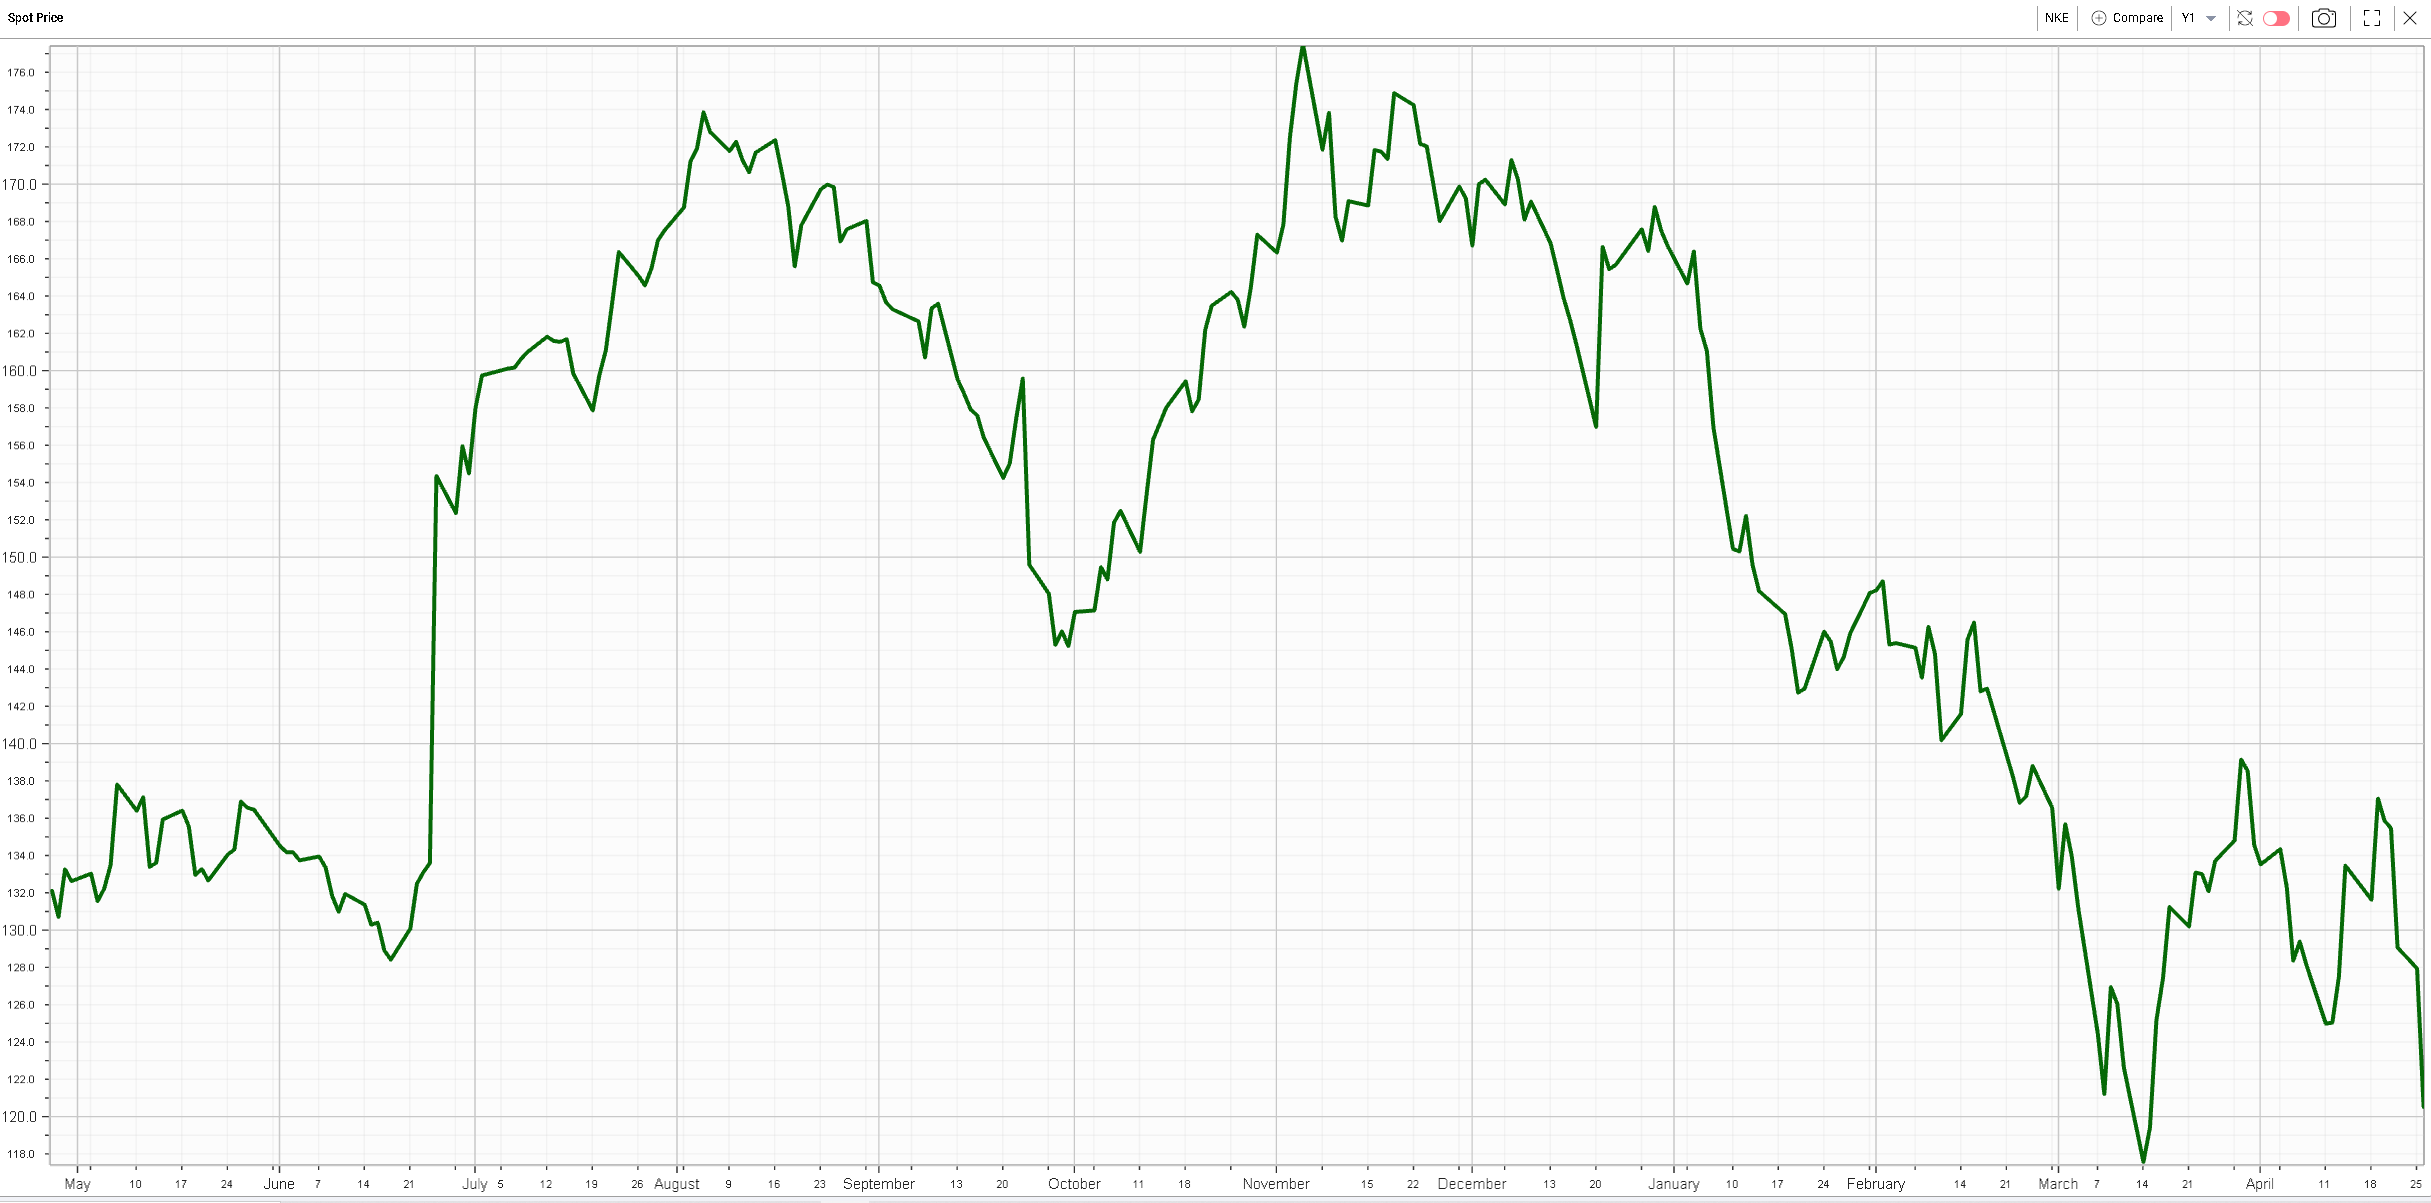
Looking at the underperformers, we can find names like NKE which finished almost 6% lower yesterday. Here again, the correlation between yesterday’s performance and the overall performance in 2022 is quite interesting. |
|
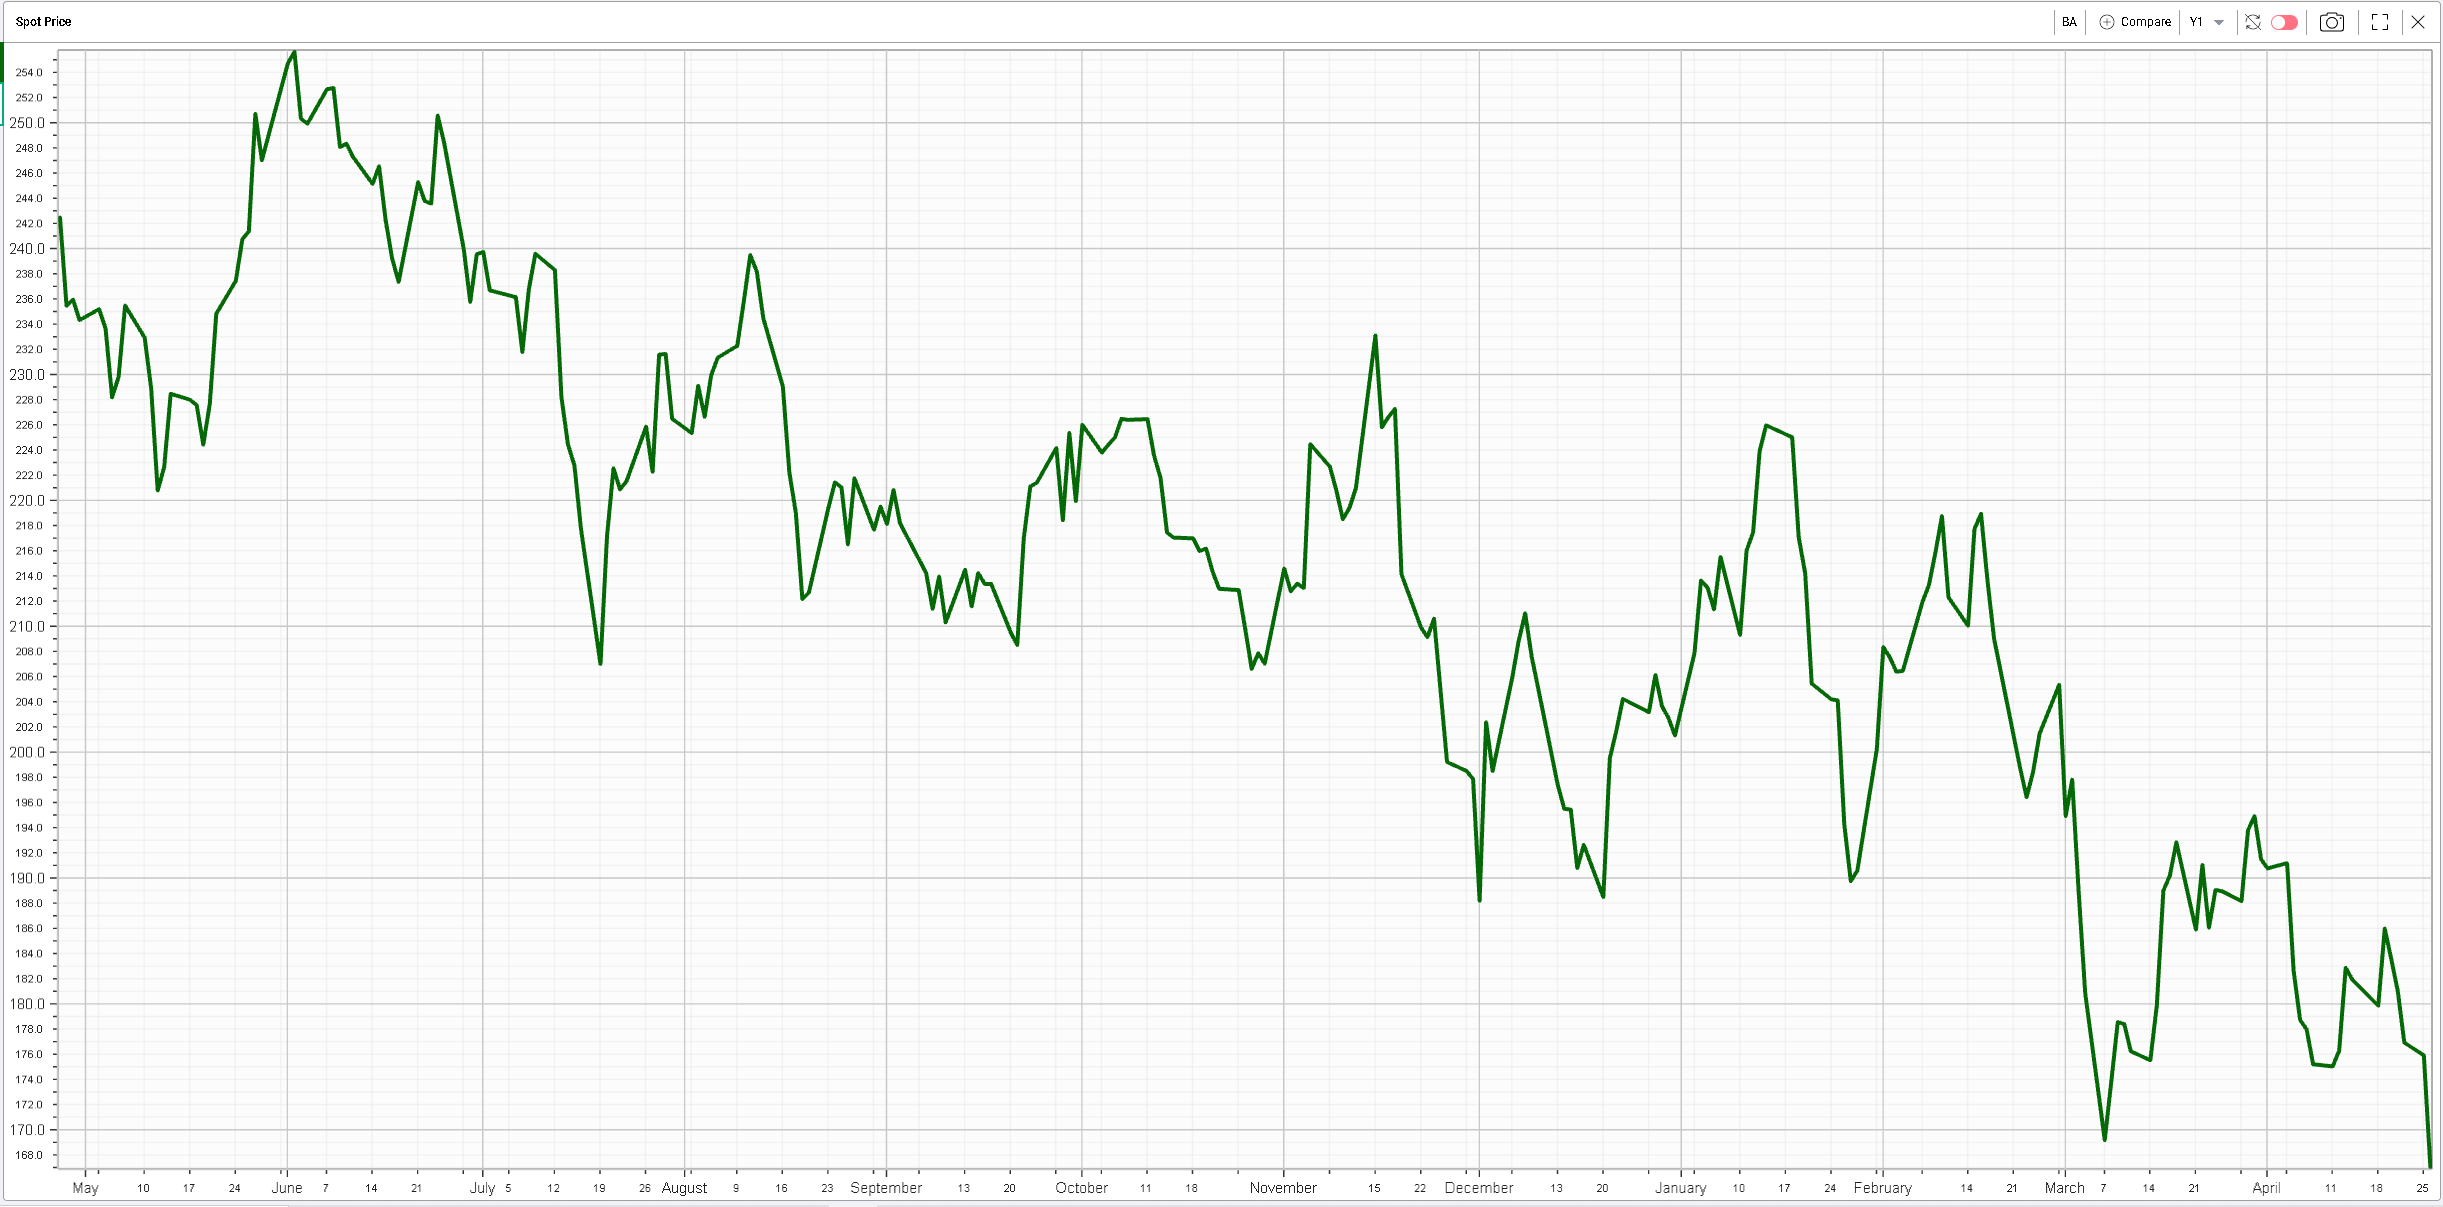
BA was the second worst performing stock of the DJIA yesterday and as expected has been an underperformer in 2022 so far. |
|
This analysis may seem very broad but by finding patterns in the market, we are able to identify divergences from those patterns. Those divergences can then be analyzed and under certain conditions they can lead to trading ideas. |
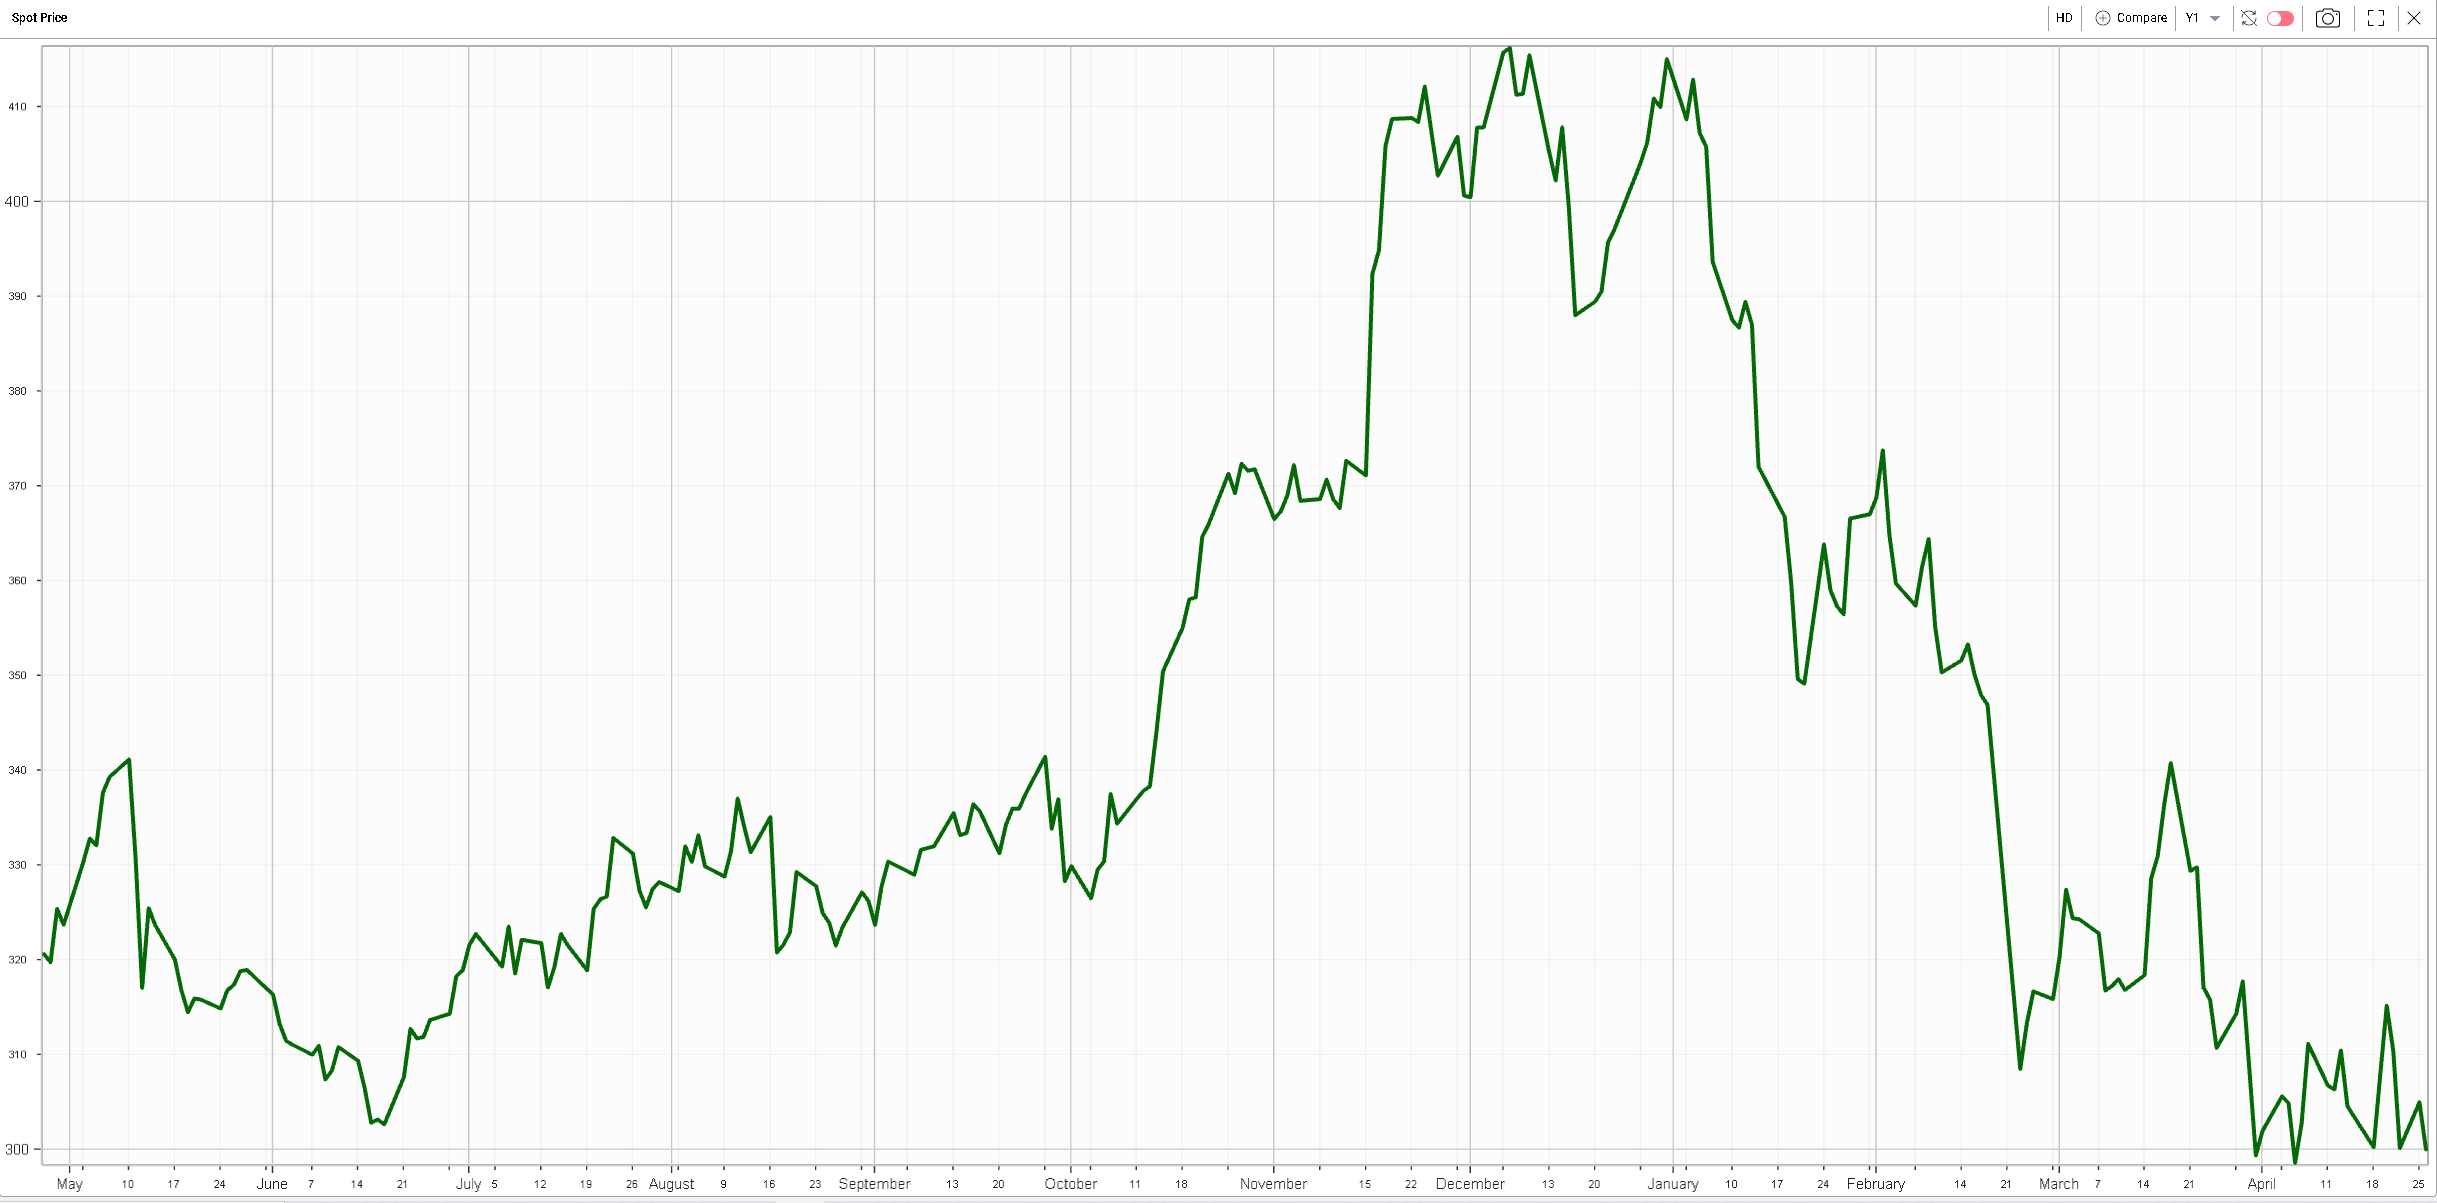
For instance, looking through the data, we can see that the performance of HD, which finished 1.63% can look weak at first sight but may actually have been fairly good. On the year, HD is down about 26.6% or about the same as NKE or DIS. NKE finished almost 6% lower and DIS was almost 4% lower yesterday. |
It is interesting to note on the below chart how the $300 mark has acted as a fairly strong support for HD so far and this is where we stopped again yesterday. |
|
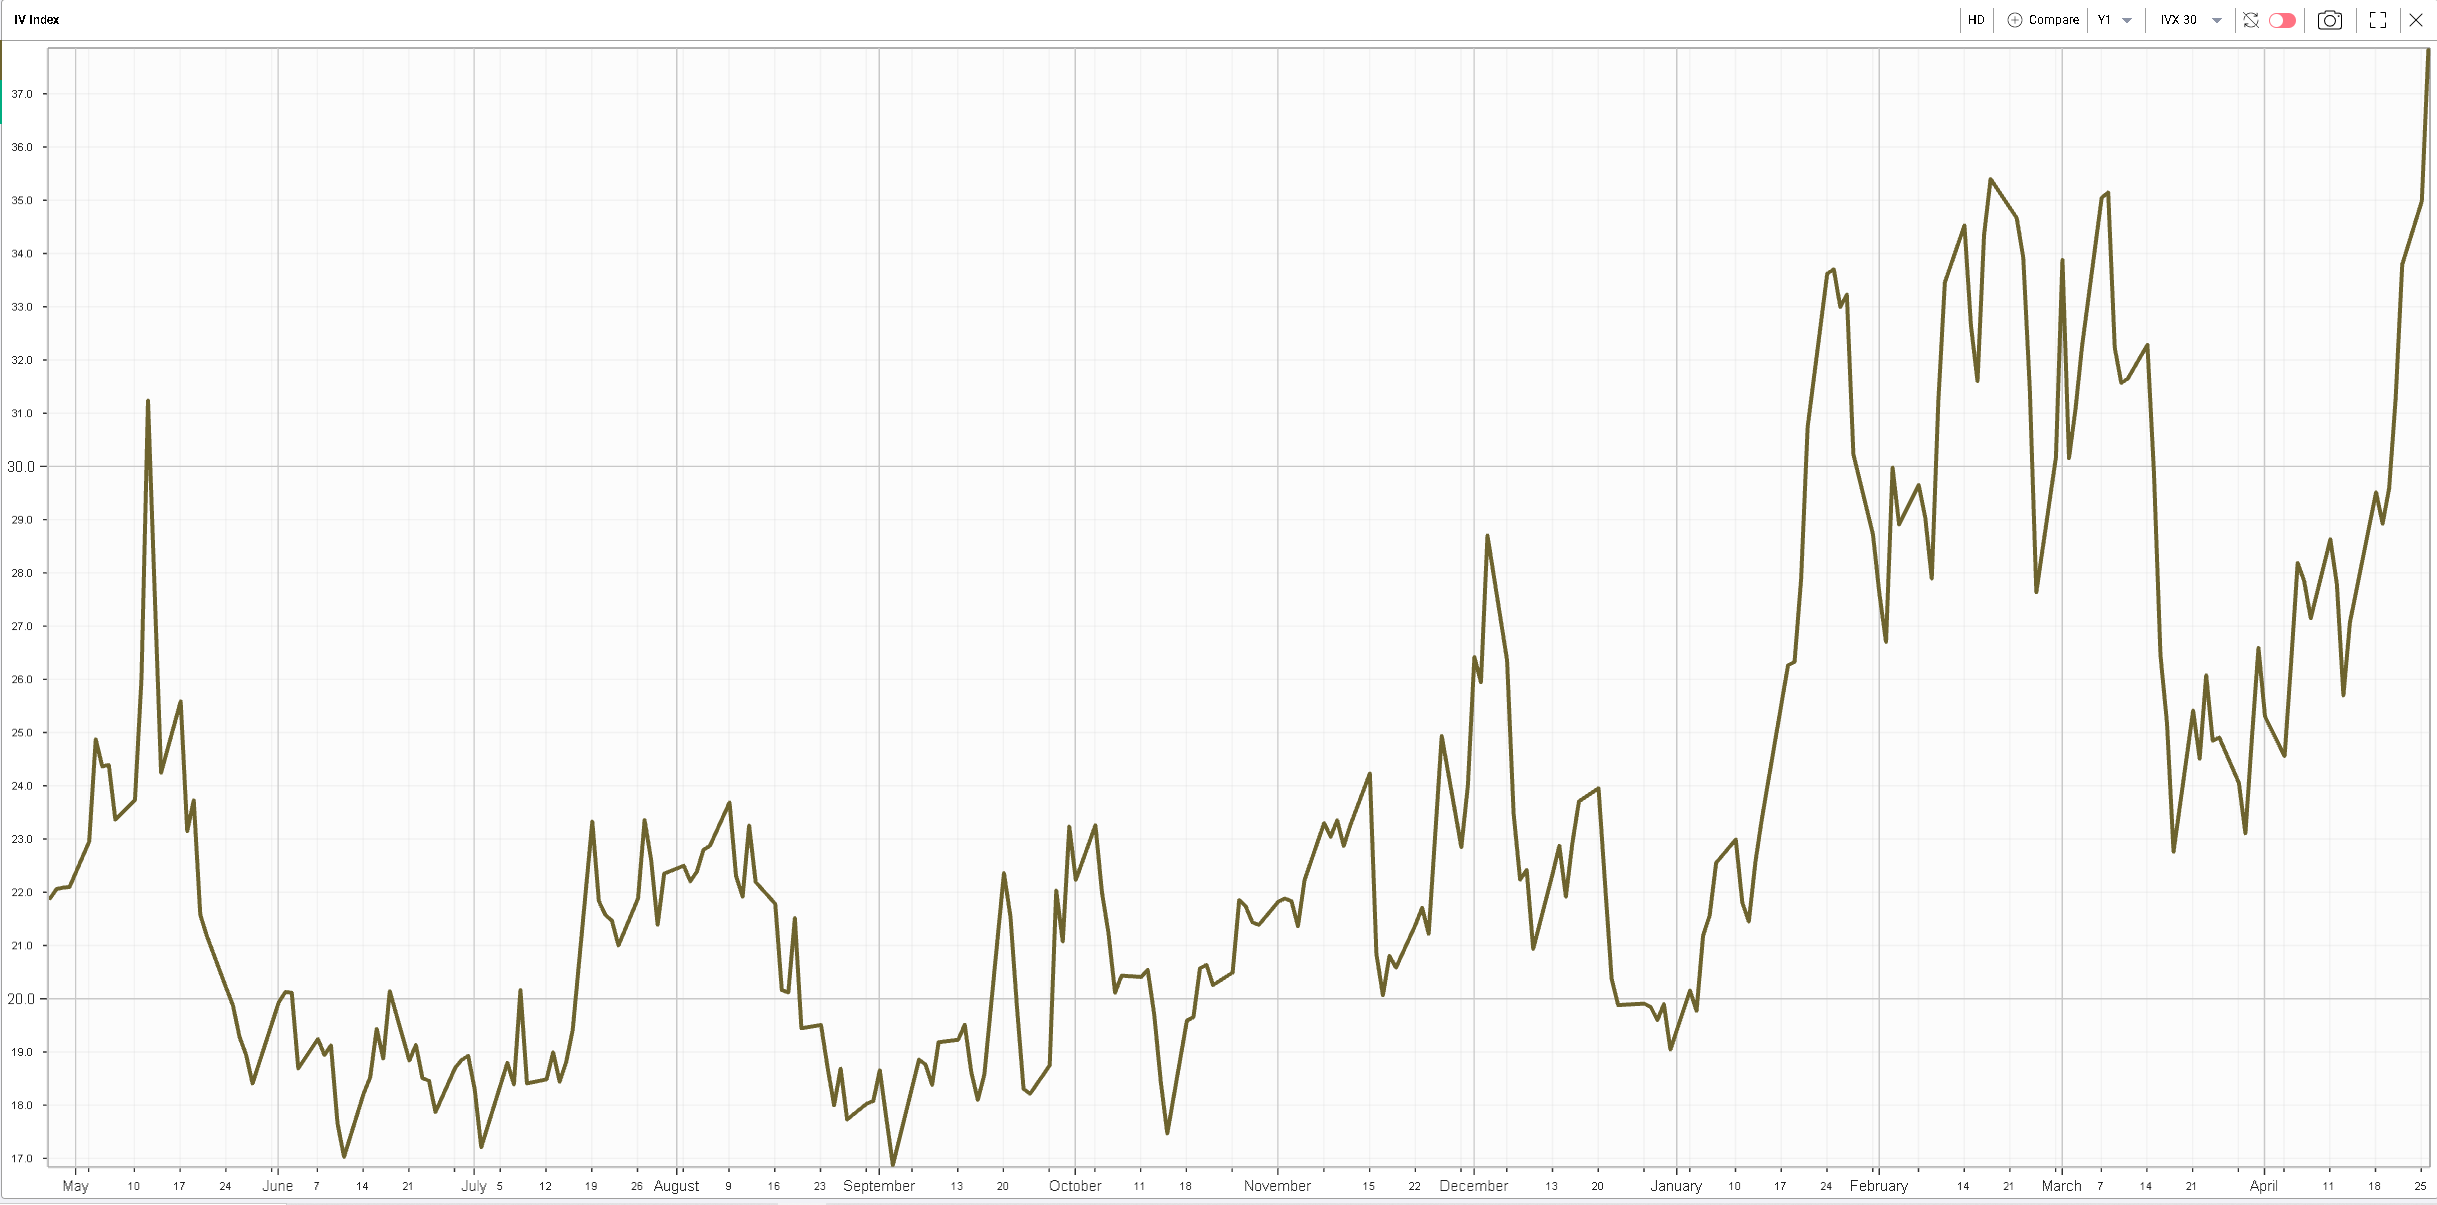
We will leave it to those of you interested in technical analysis to try and appreciate how strong such a support might be but from a practical standpoint, this is an important level. Looking at implied volatility via the 30d IVX, we can see that it reached new 12 months highs yesterday. |
|
This is important because it shows a dislocation between the spot level and the implied volatility level, a phenomenon that we have highlighted in many webinars such as THIS |
This shows us to some extent that options traders are getting slightly more worried about the possibility of a larger move. Granted we cannot say if that move is expected to happen on the upside or the downside but around such an important support, it is possible that people are getting nervous about $300 breaking. |
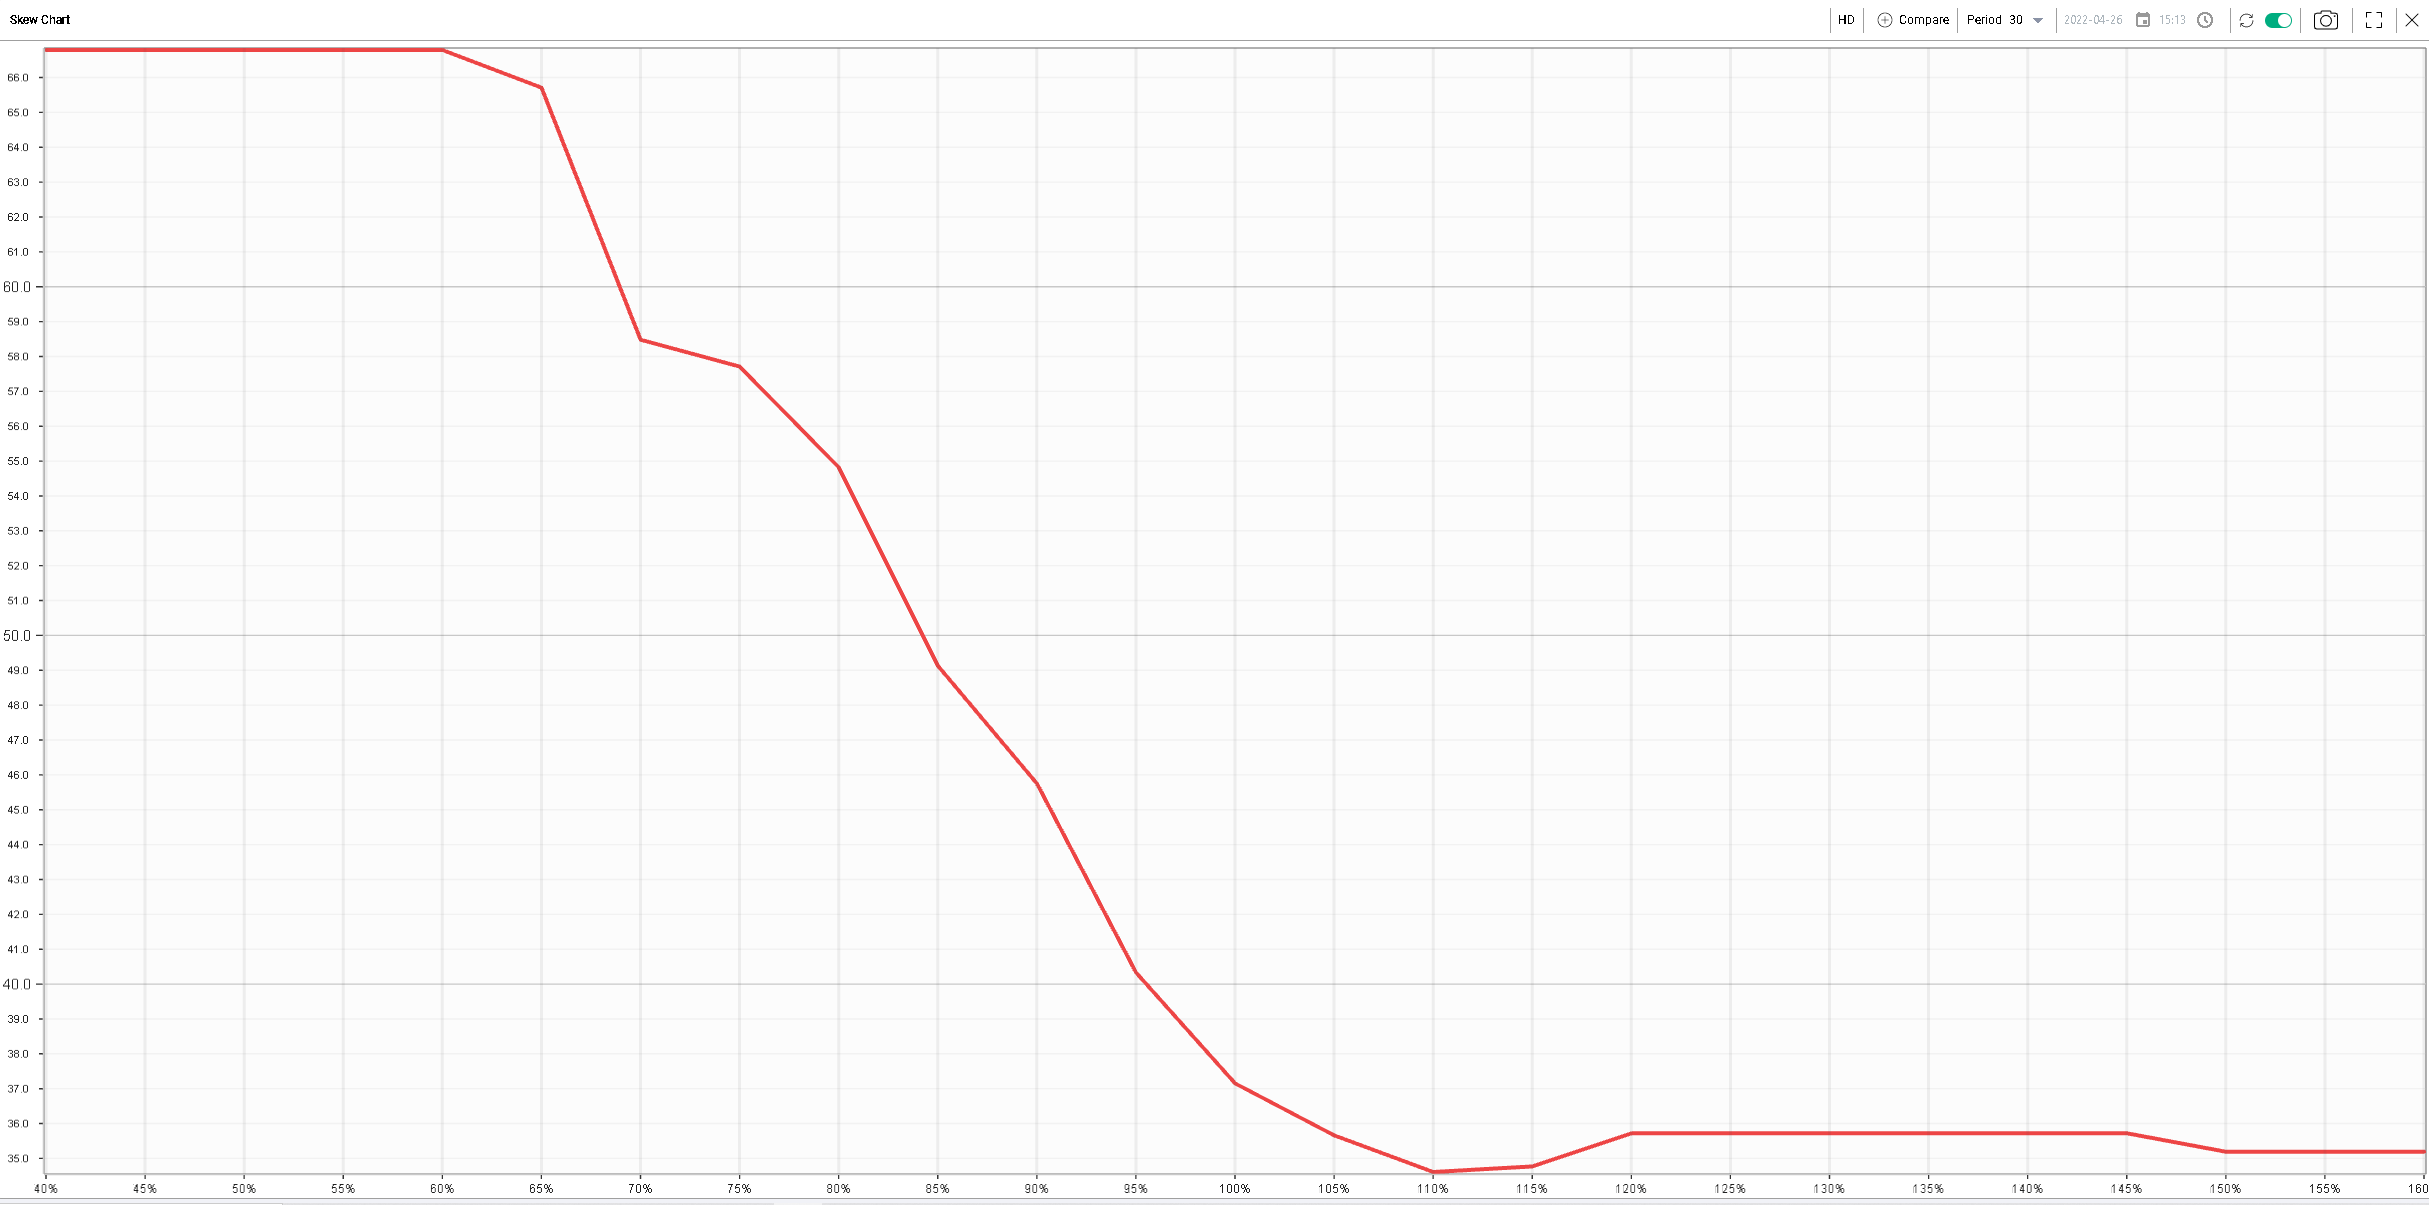
Looking at the skew chart for HD, we can see that the implied volatility for lower strikes rises very quickly compared to the volatility of higher strikes. |
|
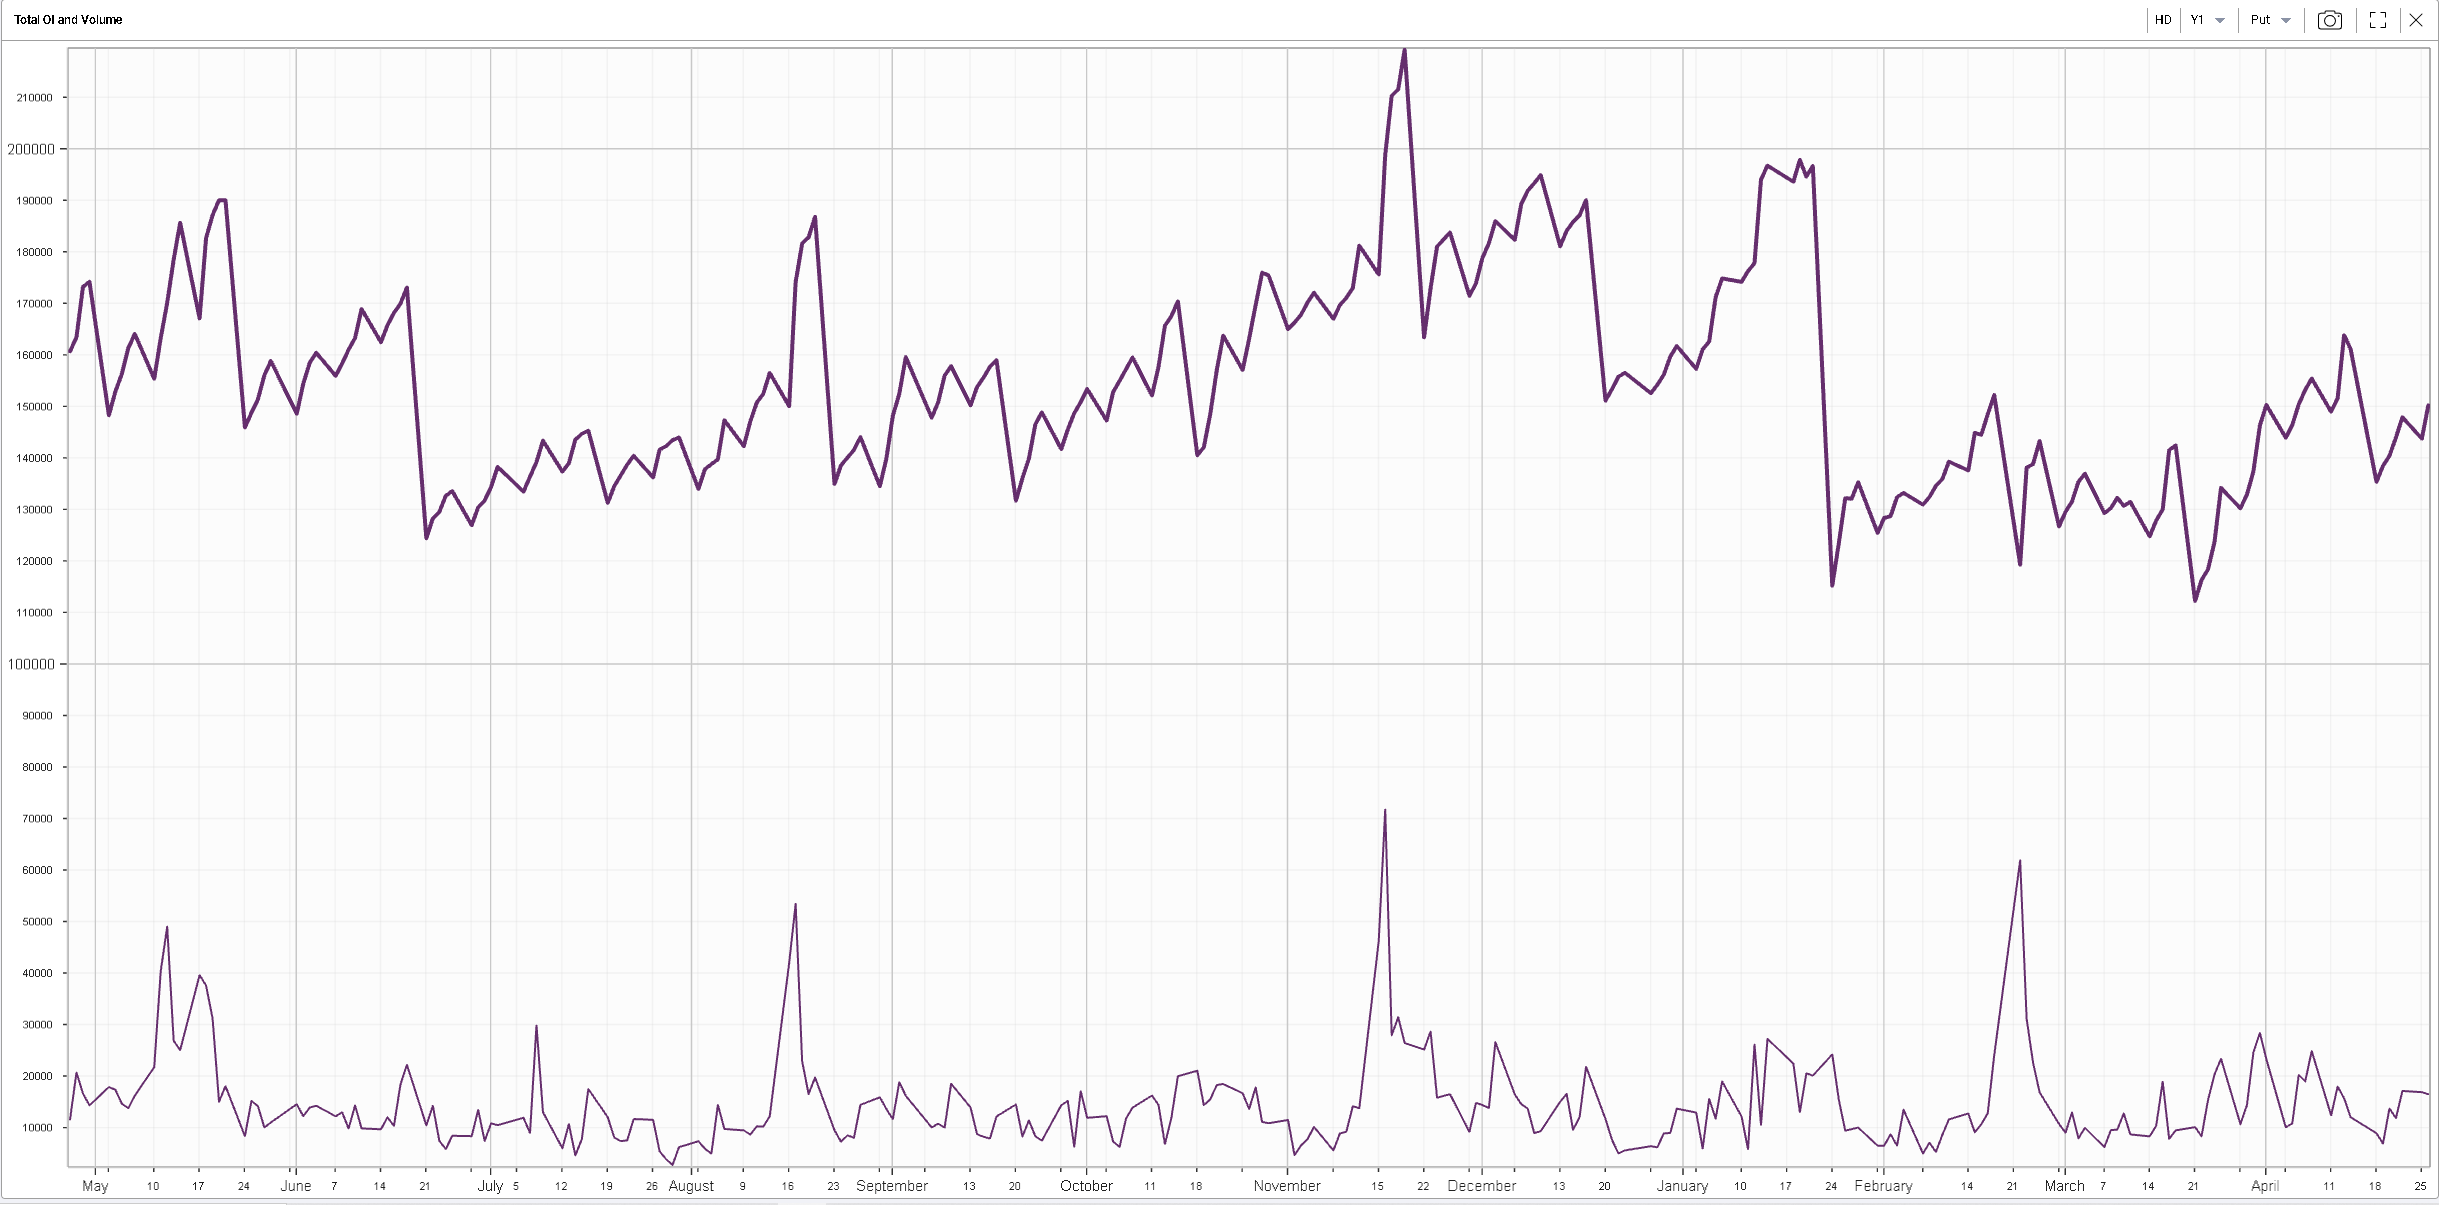
In general, such a phenomenon is driven by demand for puts being significantly greater than the demand for calls but here it has not really been the case as shown on the below open interest and volume chart on puts for HD. |
|
This leaves us with the idea that it is mostly options traders that are getting concerned about a possible outsized move and are raising the compensation they are requesting to sell puts, should traders decide to hedge themselves. |
Going one step further and formulating a trade idea based off that observation is beyond the point of this market update. It is also where you have to make a choice and decide how you want to interpret things: |
|
1. Are options market makers overly concerned and bearish about the future of HD and as such inviting us to be bullish according to the famous adage attributed to Warren Buffett: "be fearful when others are greedy, and greedy when others are fearful". |
Or |
|
2. Are options market makers worried that the stock has been held for technical reasons and that fundamental value warrants an even larger discount that the current price inviting us to be cautious. |
As with all things it is not our place to answer that question and it will require that you do proper analysis at the company level in order to assess whether you see value in this name or not. |
Using the other set of tools such as the RT Spread Scanner and the PnL Calculator will help you find an option or combination of options that match your personal risk tolerance and view. |
Disclaimer - This information is provided for general information and marketing purposes only. The content of the presentation does not constitute investment advice or a recommendation. IVolatility.com and its partners do not guarantee that this information is error free. The data shown in this presentation are not necessarily real time data. IVolatility.com and its partners will not be liable for any loss or damage, including without limitation, any loss of profit, which may arise directly or indirectly from the use or reliance on the information. When trading, you should consider whether you can afford to take the high risk of losing your money. You should not make decisions that are only based on the information provided in this video. Please be aware that information and research based on historical data or performance do not guarantee future performance or results. Past performance is not necessarily indicative of future results, and any person acting on this information does so entirely at their own risk. |