How to find trades with IVolLive |
The market held firm yesterday with the NDX managing to stay above the 13,000 level and closing almost unchanged on the day. The SPX and the DJIA were both up 0.2% during Wednesday’s session. |
Under the surface some trends continued to develop with the Communications sector finishing 2.2% lower driven by Meta which closed down 3.3% and Alphabet which finished 3.7% lower. |
Meta reported earnings overnight which seem to reassure investors for now with both a beat on profits and daily active users. As of last night’s close, the stock was down almost 50% on the year so it will be interesting to see how traders look at the price action. |
Given the elevated implied volatility level, options traders were expecting a very large overnight in the name. Pre market indications are showing an opening price around $200 or 17% higher than yesterday’s close. |
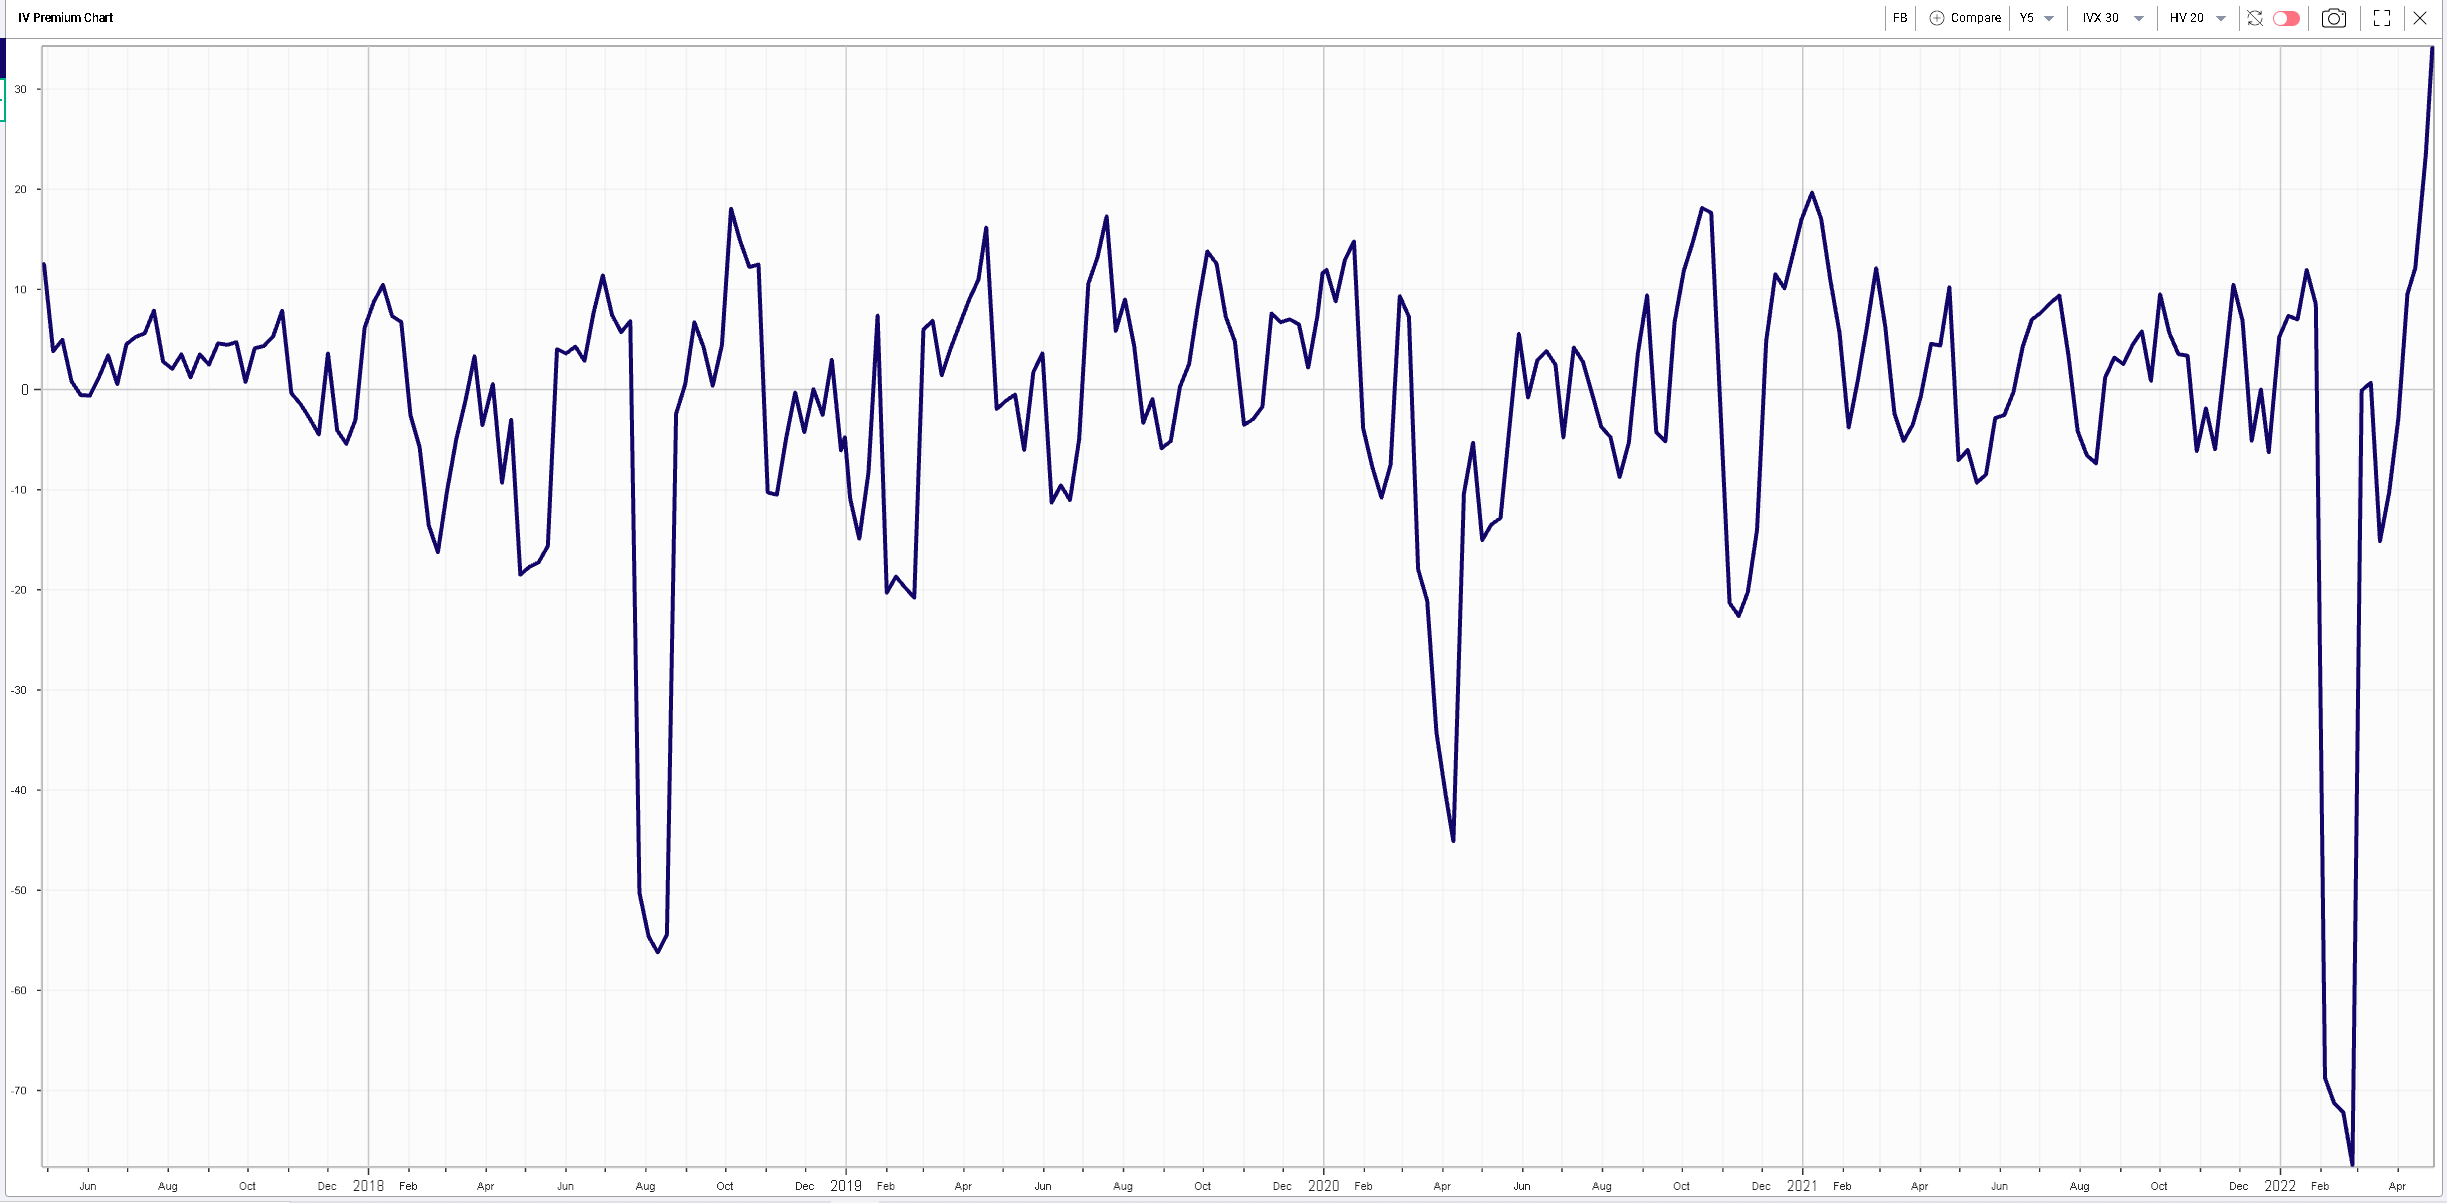
The below chart shows the 5 years 30d / 20d IVX Premium trading at +34, a sign that options traders were asking for a very large compensation to sell options for those earnings. |
|
On the other hand, Technology stocks actually performed well yesterday led by MSFT which closed almost 5% higher on the back of stronger earnings and guidance. The stock is still trading about 15% lower on the year. |
The best performing stock in the DJIA yesterday was Visa. The stock finished 6.5% higher and is now only 3.5% lower on the year. This story is once again driven by better earnings than expected. Boeing struggled and finished 7.5% lower on the day weighted by some unexpected loss around the production of Air Force One. Boeing is now down 26% on the year. |
As the SPX closed yesterday pretty much at its closing level of the 14th Mar’22,it would make sense to take a step back and analyze how stocks have moved since that date. |
First, looking at global indices, since the 14th Mar’22, US indices have been largely unchanged. The SPX is flat, the DJIA is up about 1.5% and the NDX is down less than 1%. This stability is also fairly visible in European indices with the French CAC up about 1% while the German DAX is down almost 2%. |
Over in Asia, things are quite different. First Chinese Equities, despite all the negative talk in the market are up almost 3% but it is in Japan where things have been the most bullish so far with the NKY up almost 6%. Now part of the story for the NKY is the weakening of the JPY and it is interesting that this effect has not been seen in other parts of the world, in particular over in Europe with the EURUSD trading around 1.05. |
Looking at stocks, it is interesting to note that actually only a handful of stocks are trading close to where they were back on the 14th Mar’22. We are looking at the components of the DJIA in this particular example. |
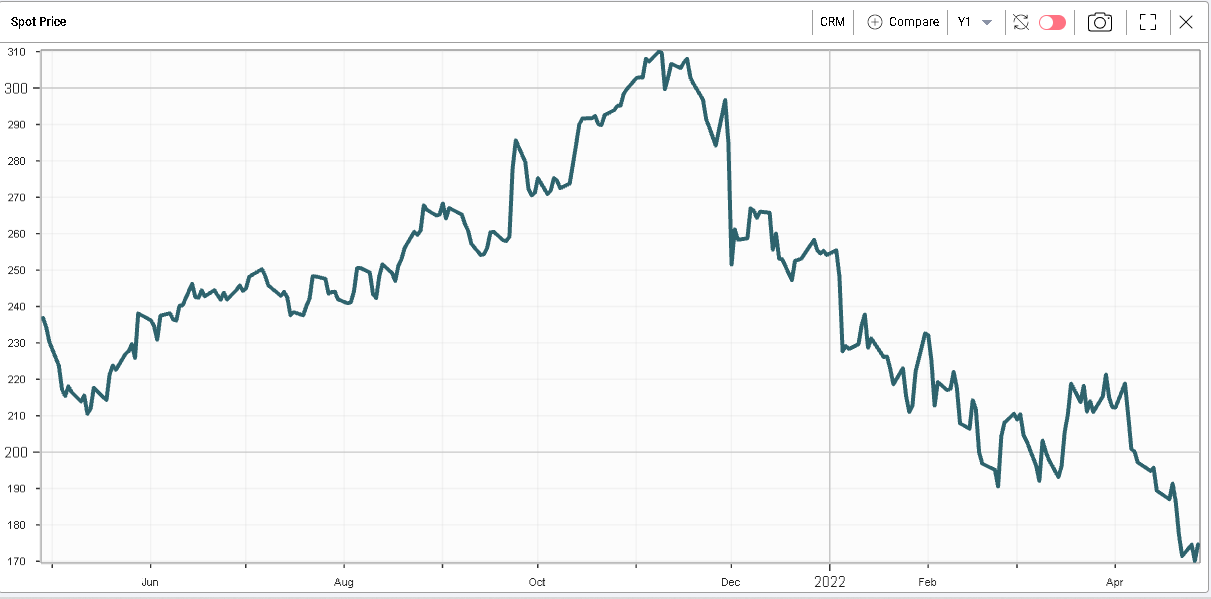
The worst performing stock since the 14th Mar’22 has been CRM which has lost more than 10%. The name is now down more than 30% on the year. |
|
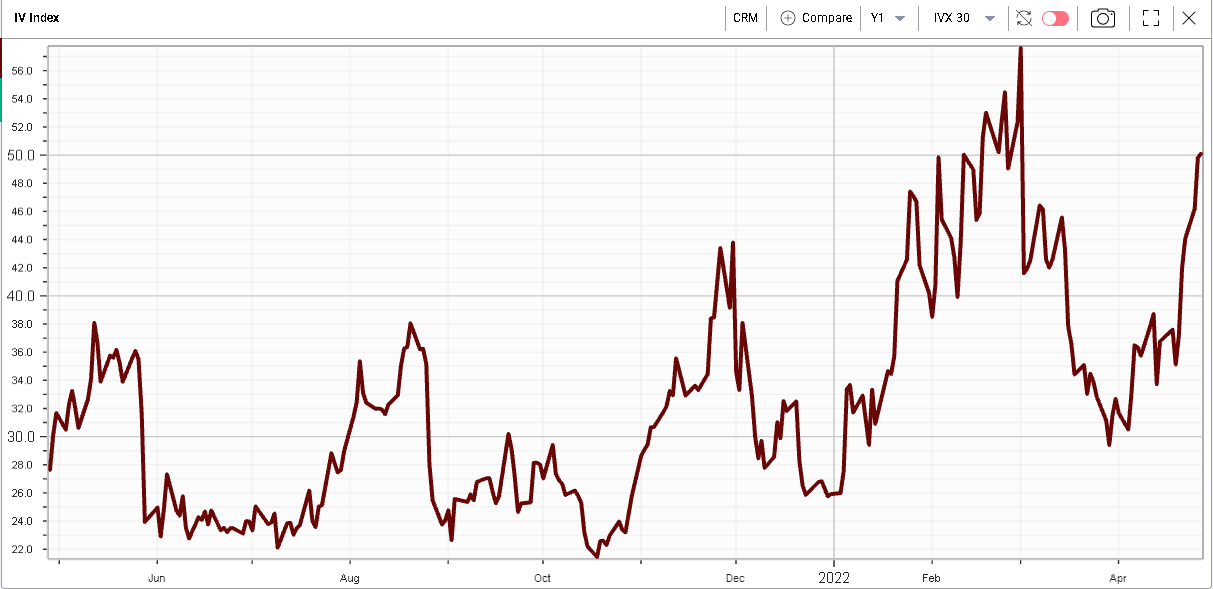
Interestingly, the fact that the stock has continued to drift lower has not been entirely reflected in implied volatilities. Below we show the 30d IVX for CRM and we can see that spot and implied volatility have diverged. |
|
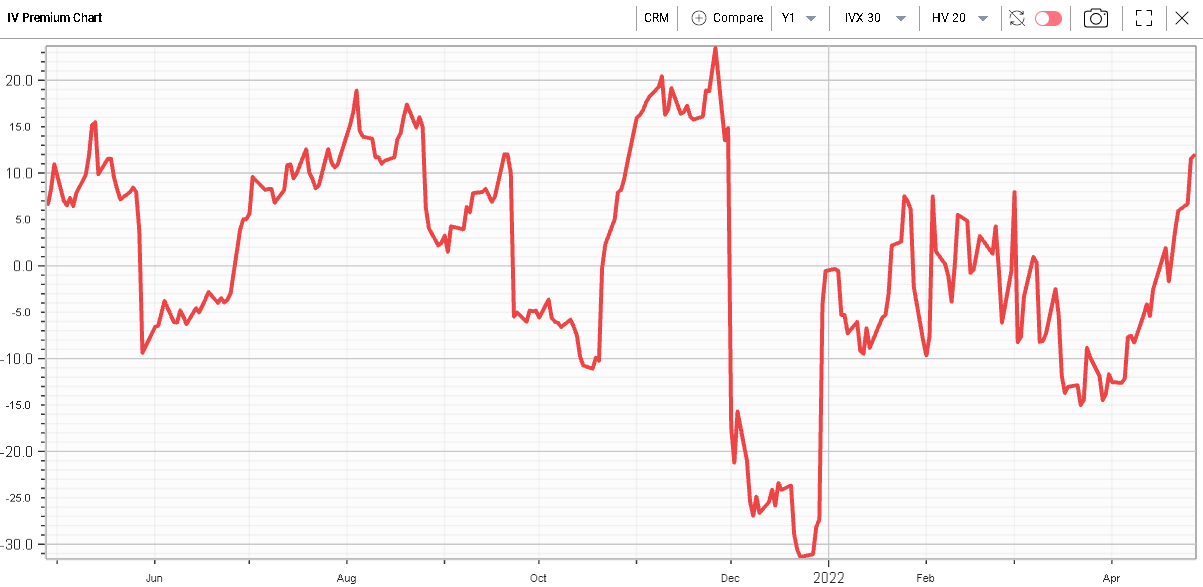
Looking at the IVX Premium chart that compares 30d IVX with 20d HV, we can explain the slow bounce of implied volatilities by subdued realized volatilities. |
|
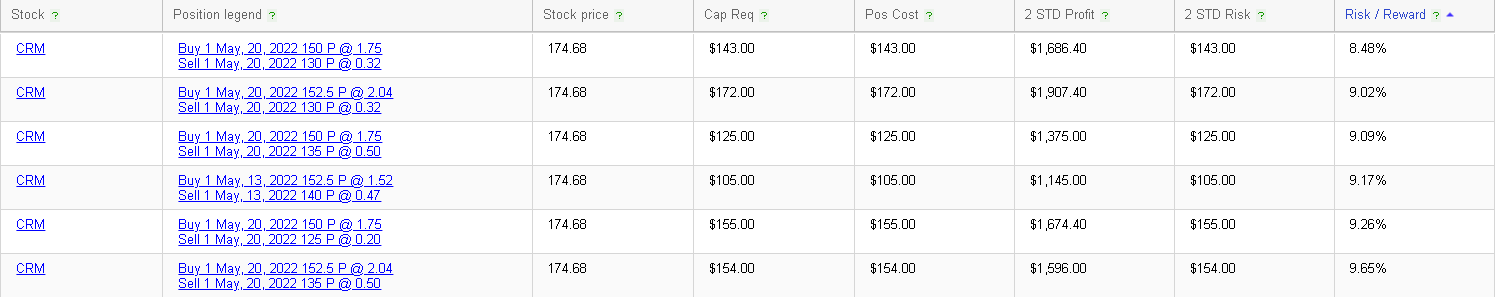
Using the RT Spread Scanner, we are able to retrieve the most attractive bear vertical spreads for traders interested in playing a continuation in the move and the most interesting bull vertical spreads for traders looking to play a bounce. |
The RT Spread Scanner is a very powerful tool that is part of the IVolLive suite and allows you to scan for trading ideas depending on a range of criteria that you can set. Here we elected to sort spreads by their respective risk to reward ratios. |
Looking at the results, we can see a risk to reward ratio for bear vertical spreads as low as 8.48%, in other words, the trader looking at this strategy stands to make $1 for every 8.5c that he risks. |
|
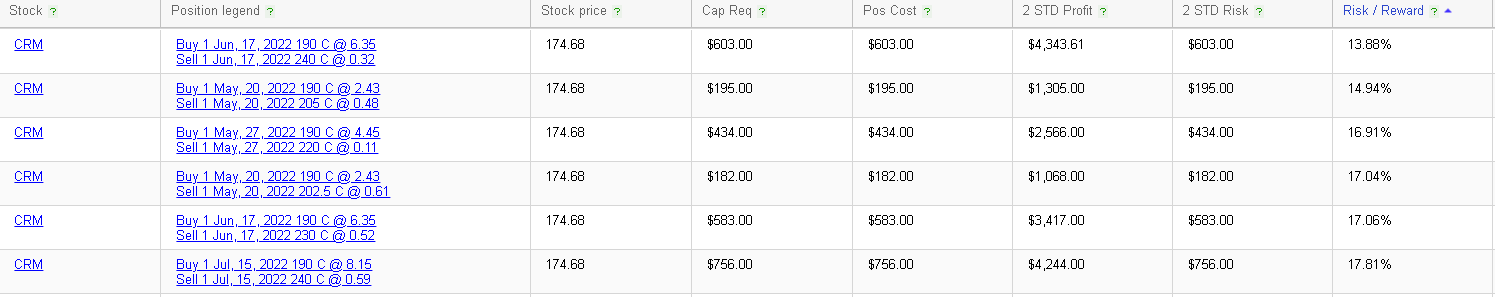
Looking at bull vertical spreads, the system highlights some longer dated structures (July vs May for the bear spreads) offering a risk to reward ratio of around 13.88%. |
|
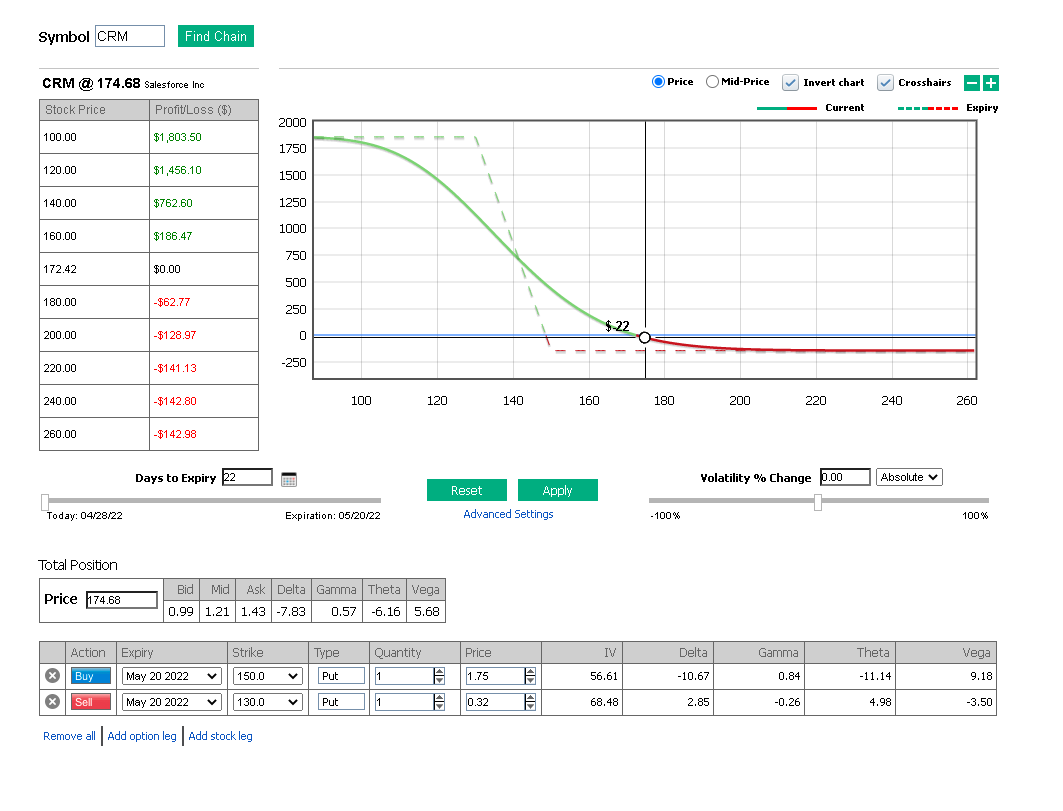
Let us study the May 150/130 bear spread in more details using the PnL Calculator. The top right payoff chart shows both the payoff at expiration (dotted lines) and the current payoff. |
|
The top left table allows us to quickly understand the profits and losses we stand to realize for a $20 move in the underlier. At the bottom we have a recap of our exposures, measured with the Greeks both at the position level and for each of the options we have selected. |
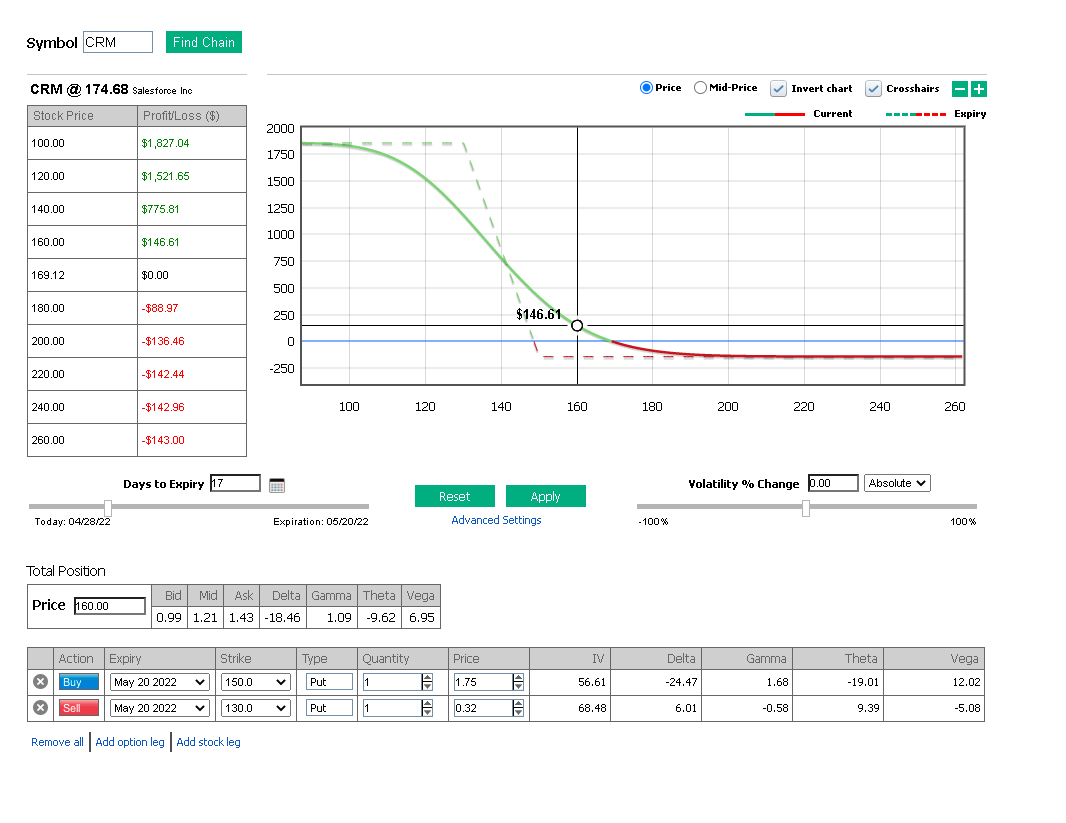
We can see that our position shows a delta of -7.83. In other words, holding a bear vertical spread is equivalent to holding a short position in around 8 shares. Those exposures are not constant and using the sliders to understand how they will evolve is key to planning trades. For instance, sliding the spot price from $174.68 to $160 and passing 5 days, we can see that our delta has changed to -18.46. The value indicated on the chart tells us the expected profit or loss, in this case a gain of $146.61. |
|
Options are complex products with many moving parts. They also include significant amounts of leverage. As such, using tools such as the PnL Calculator allows you to assess your exposures and size your trades accordingly. |
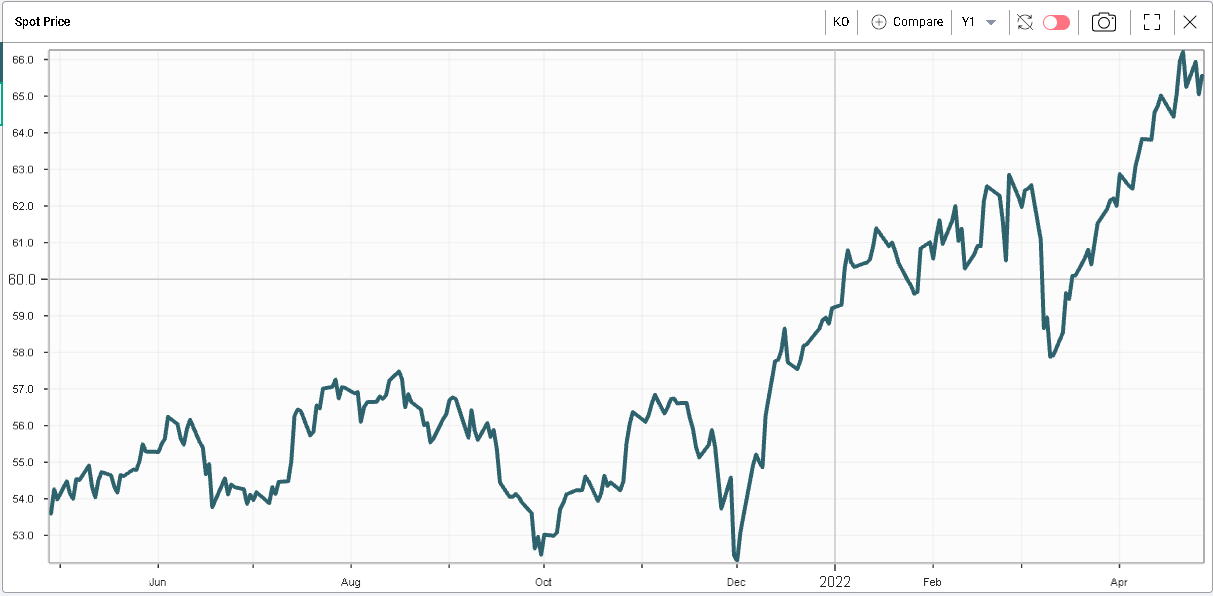
Many other names stand out when compared with the 14th Mar’22. KO for instance has rallied more than 10% and the stock is now up more than 10% on the year. |
|
Across the board, companies with a more defensive tilt have generally done better than others. As inflation continues to increase, traders are betting that consumers will become more selective in the things they purchase. |
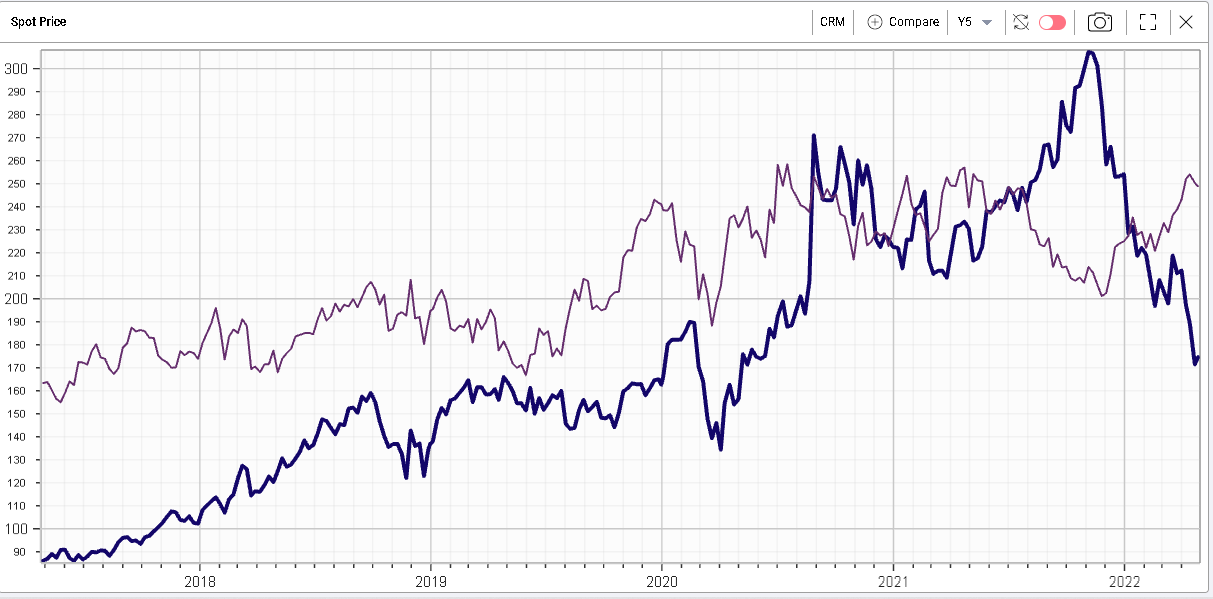
This being said, the market has been fairly quick in repricing that trade as shown on the chart below displaying the 5-year performance of CRM in dark blue vs AMGN in purple. |
|
Disclaimer - This information is provided for general information and marketing purposes only. The content of the presentation does not constitute investment advice or a recommendation. IVolatility.com and its partners do not guarantee that this information is error free. The data shown in this presentation are not necessarily real time data. IVolatility.com and its partners will not be liable for any loss or damage, including without limitation, any loss of profit, which may arise directly or indirectly from the use or reliance on the information. When trading, you should consider whether you can afford to take the high risk of losing your money. You should not make decisions that are only based on the information provided in this video. Please be aware that information and research based on historical data or performance do not guarantee future performance or results. Past performance is not necessarily indicative of future results, and any person acting on this information does so entirely at their own risk. |