There is a lot in the price |
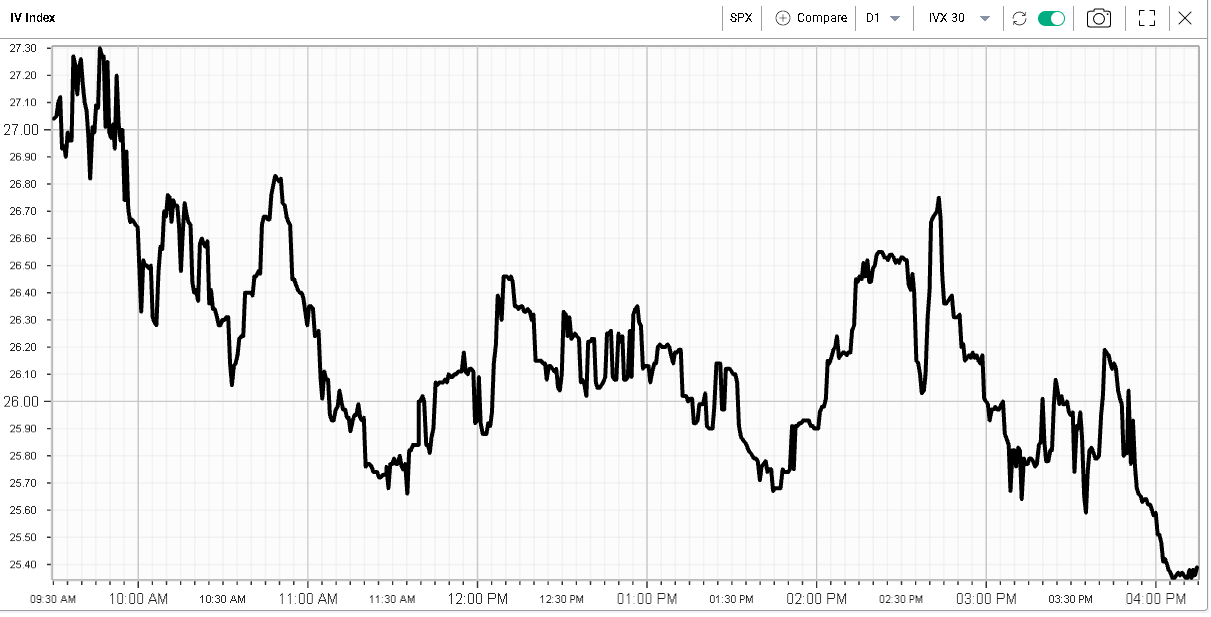
US indices traded sideways yesterday ahead of an important FOMC meeting tonight. The NDX finished 0.11% higher, the SPX 0.48% higher and the DJIA 0.2% higher. Despite a major risk event tonight, implied volatilities continued to deflate with the SPX 30d IVX losing 1.5 points on the day. |
|
At the sector level, the Energy space continued to push higher and finished almost 3% higher on the day. Financials also performed well and showed the second-best performance over the day up 1.3%. |
Within the DJIA, stocks were fairly contained with all names showing a performance comprised between -3% and 3%. NKE was the worst performing stock down around 2.6% while BA outperformed up 3.3%. |
Despite the very macro focus we will most likely have for the rest of this week, first with the FOMC today and then with NFPs on Friday, it is important to keep in mind that a decent portion of stocks still has not reported earnings. |
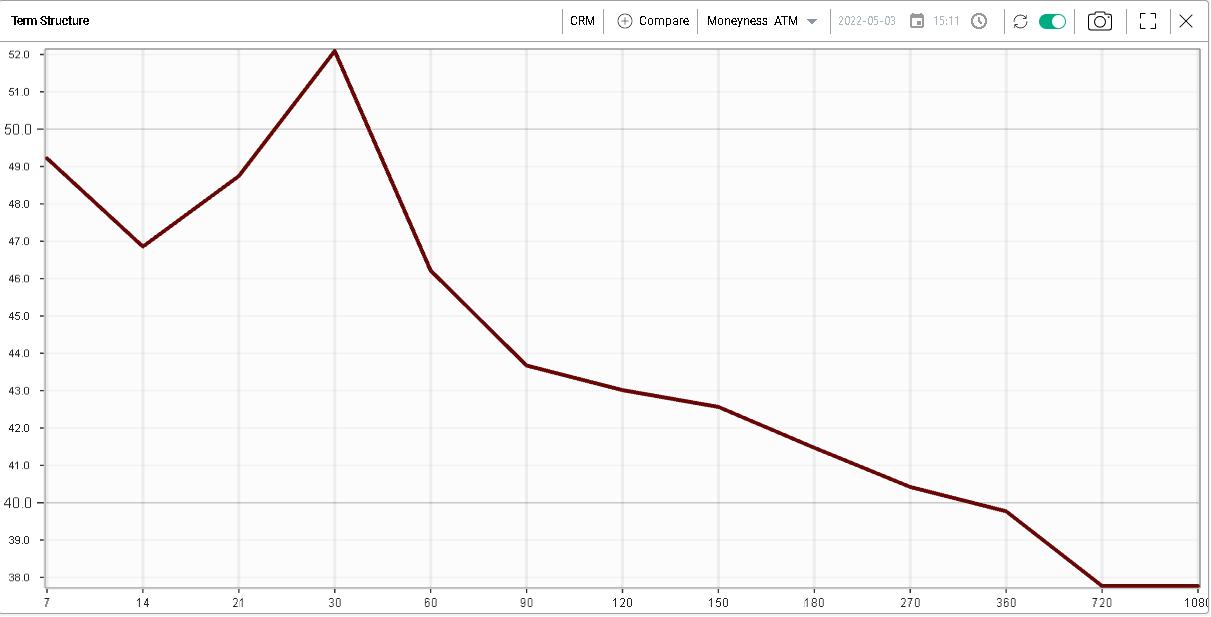
Looking at some of those names, we can see that the term structure for many of those names are quite inverted. For instance, below we show the Term Structure for CRM which is due to report earnings on the 26th May'22 |
|
The difference in implied volatility between 30 days options and 60 days is quite elevated with 30d IVX around 52% and 60d IVX around 46.5%. |
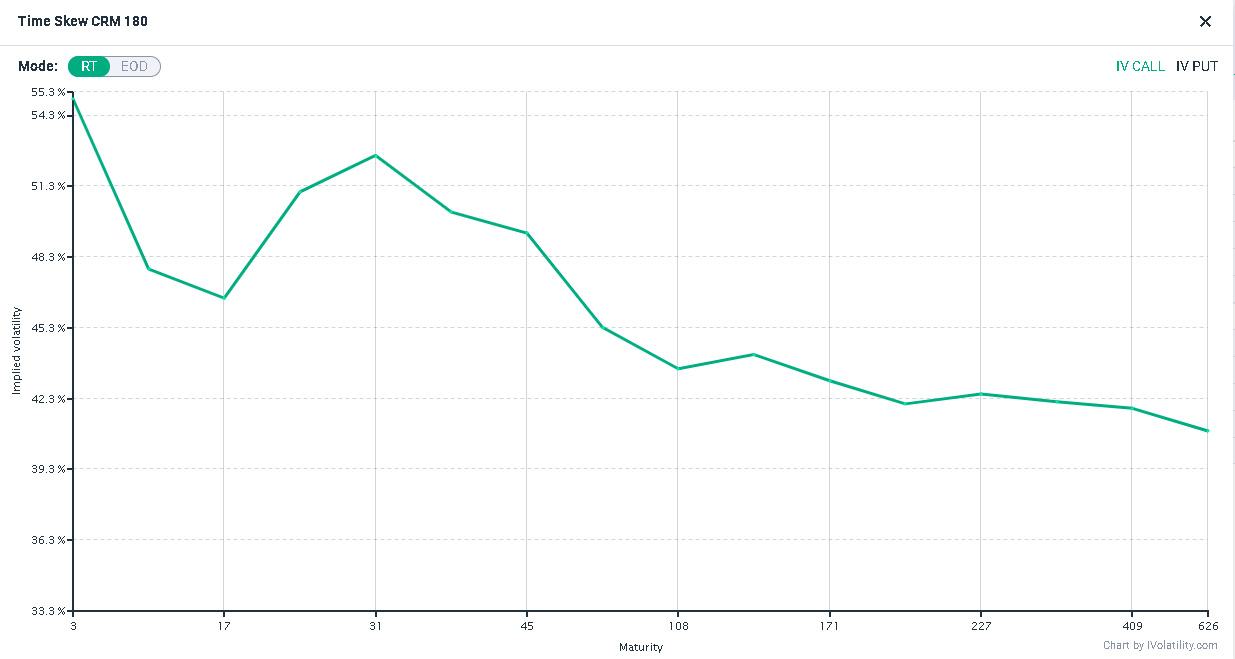
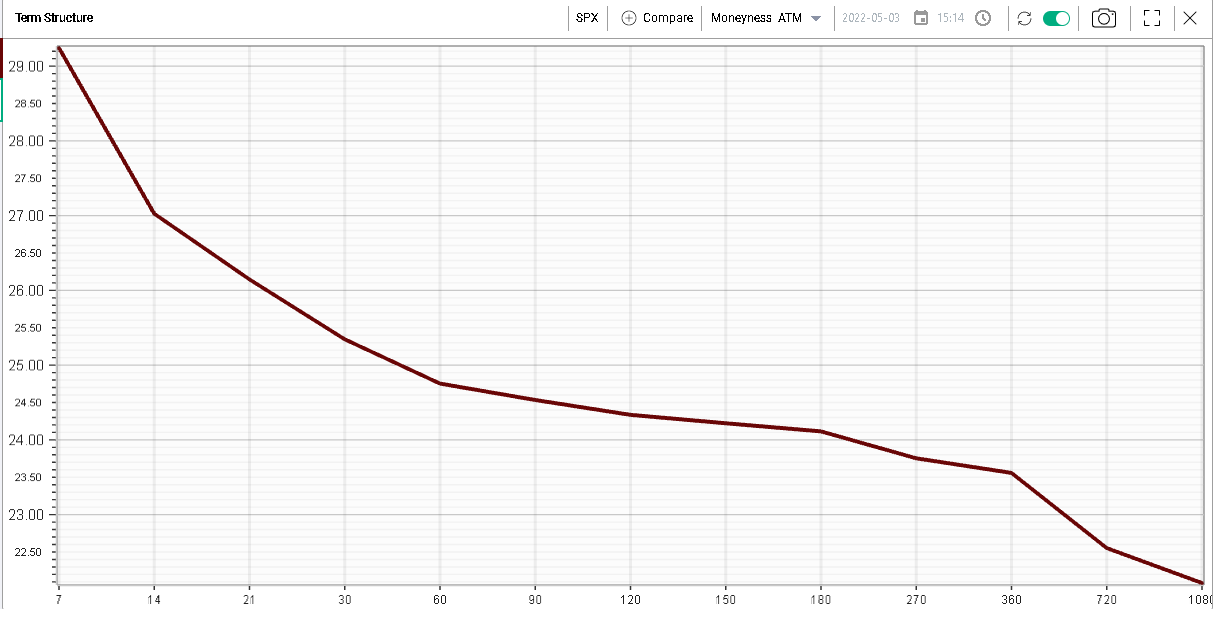
Looking at the 180 strikes across all listed expirations, we get the below term structure. This is an important step to convert a theoretical idea into a real one as the term structure above is normalized while the one below looks at real options. |
|
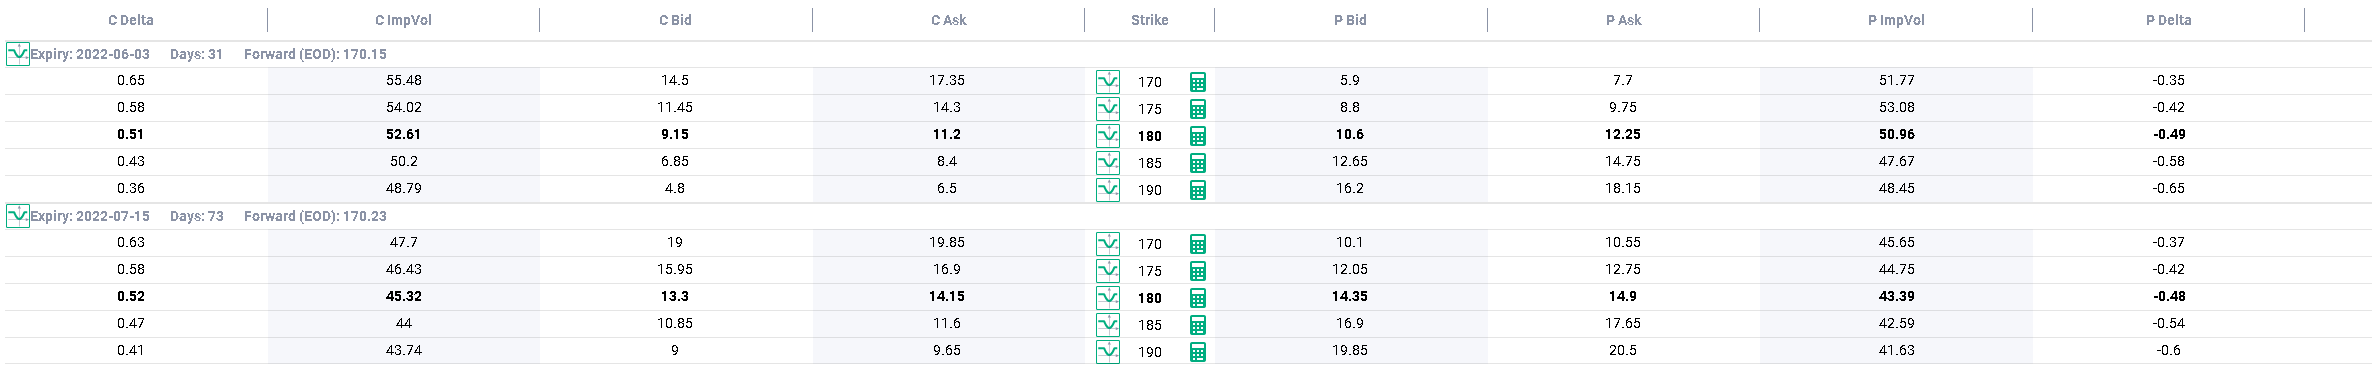
The 31 days (3rd Jun'22) 180 options are trading with a 52.61% implied volatility while the 73 (15th Jul'22) days 180 options are trading with a 45.32% implied volatility. |
Looking at the options chain, we can see that buying the July 180 calls and selling the June 180 calls costs a net $5 using Ask and Bid prices respectively. |
|
Looking at puts and buying the July 180 puts while selling the June 180 puts costs a net $4.3. |
This position resembles owning the 180 calls with a July expiration from the 3rd of June for $5 or owning the July 180 puts from the 3rd of June for $4.3. |
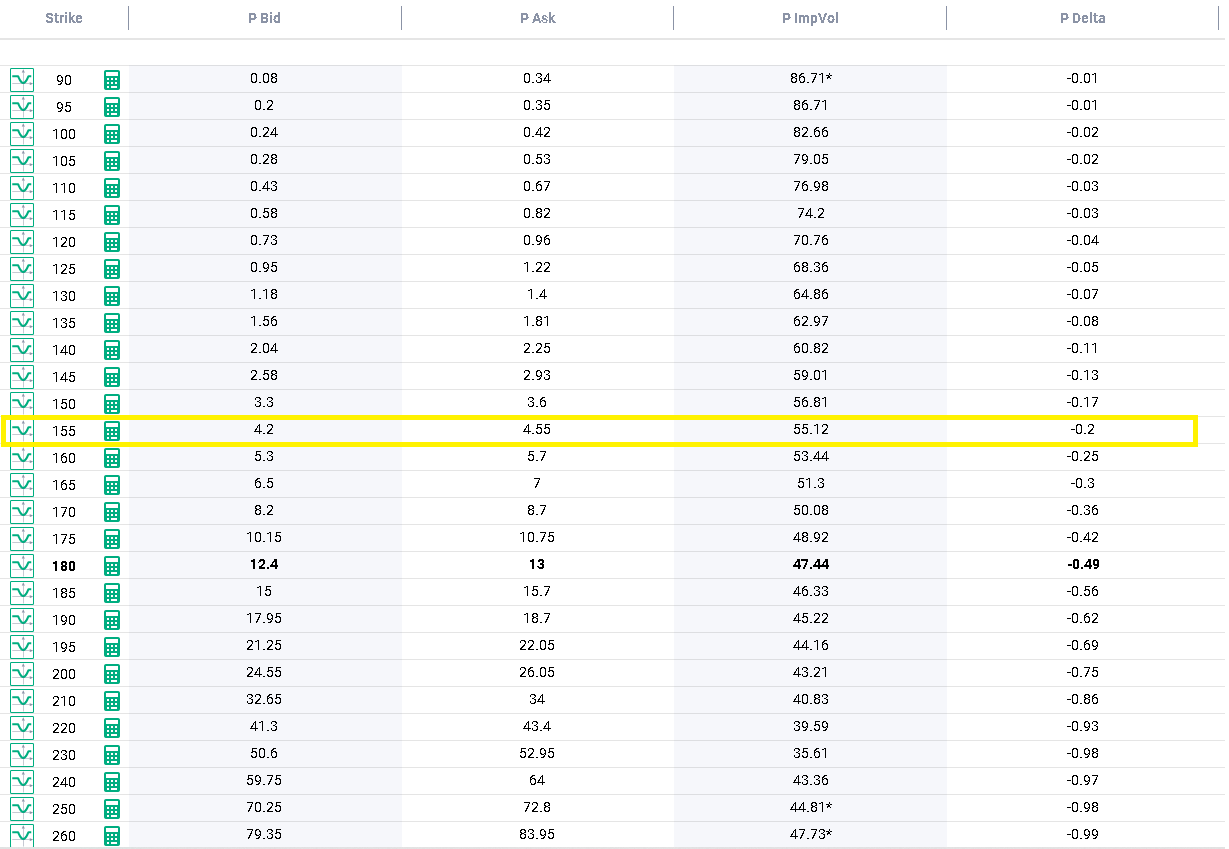
On the 3rd Jun'22, the July options will have an expiration of 42 calendar days. Looking at the 17th Jun'22 options which have 45 days to expiration, we can see that the closest call costing around $5 is the 200 calls. |
|
This presents the bullish trader with two possible alternatives: |
|
Not one approach is better than the other and it really depends on the view that the trade wishes to express. If the trader thinks that earnings might prove underwhelming and that the stock might not move much higher then the second approach would be easier to carry. |
If on the other hand, the trader saw earnings as the catalyst for a swift upside repricing then the trader would probably prefer the first strategy. |
|
The same work can be done with puts. The following options chain shows that the following alternatives exist: |
|
Once again, the trader will have to refer to its view in order to assess whether or not that trade makes sense. |
Given the importance of the releases over the next few days, the curve in the SPX looks inverted. |
|
A similar strategy can be employed here for traders who think that too much attention has been dedicated to this week’s events. |
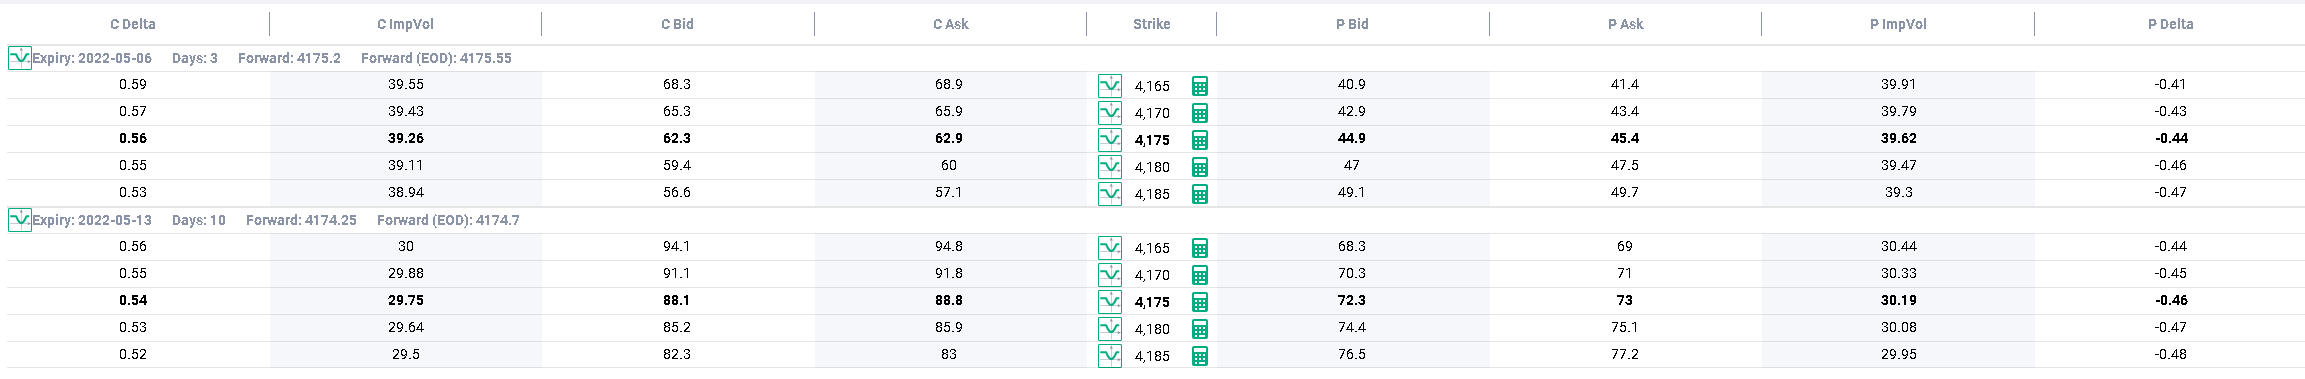
Looking at weekly options, we highlight the 6th May'22 and the 13th May'22. |
|
For instance, the 4175 call expiring on the 6th May’22 are priced with an implied volatility of 39.26% while the 4175 calls expiring on the 13th May’22 are priced with an implied volatility of 29.75%. |
Looking at the options chain, we can think for example of the following calendar spreads: |
|
In order to better understand the exposures that this strategy carries, you should consider using the PnL Calculator. This is a must-take step for serious traders who want to understand their exposure and no trade should be added without going through that what-if analysis. |
If you would like to try our services, we offer 3 weeks of free trial. |
Disclaimer - This information is provided for general information and marketing purposes only. The content of the presentation does not constitute investment advice or a recommendation. IVolatility.com and its partners do not guarantee that this information is error free. The data shown in this presentation are not necessarily real time data. IVolatility.com and its partners will not be liable for any loss or damage, including without limitation, any loss of profit, which may arise directly or indirectly from the use or reliance on the information. When trading, you should consider whether you can afford to take the high risk of losing your money. You should not make decisions that are only based on the information provided in this video. Please be aware that information and research based on historical data or performance do not guarantee future performance or results. Past performance is not necessarily indicative of future results, and any person acting on this information does so entirely at their own risk. |