Markets deliver, Energy pushes higher |
The FOMC meeting yesterday was a highly anticipated event and markets did not fail to deliver with the SPX finishing up 3%, the NDX up 3.4% and the DJIA up 2.8%. |
Implied volatilities were under pressure led by the front-end of the curve which remarked lower with the 30d IVX 4 points lower for the NDX and 3 points lower for the SPX. |
|
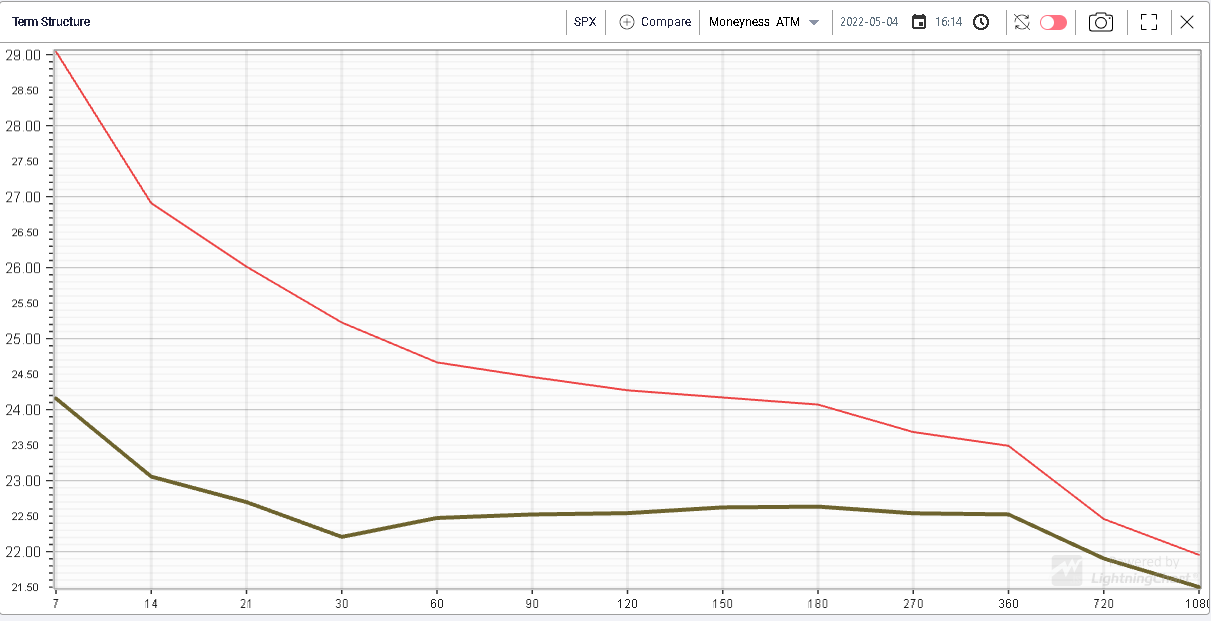
Post the event, the term structure of implied volatility for the SPX looks very flat from 30d onwards. The market is still expecting some more action in the short term but things are expected to normalize fairly rapidly. |
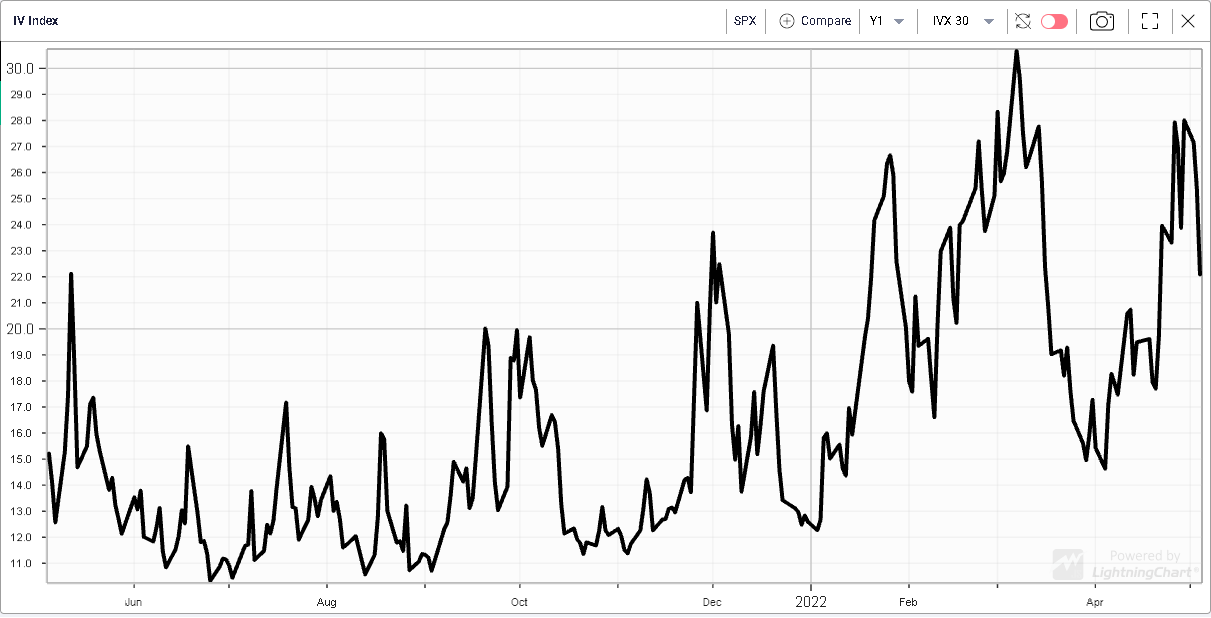
If implied volatility has dropped it remains elevated when compared with its 12 months history as shown on the chart below. |
|
All sectors in the US finished in the green yesterday and the move was led by Energy up 4.15%, Technology +3.5% and Communications +3.4%. Laggards included Real Estate which closed 1.2% higher, Healthcare which finished 2.2% higher. |
|
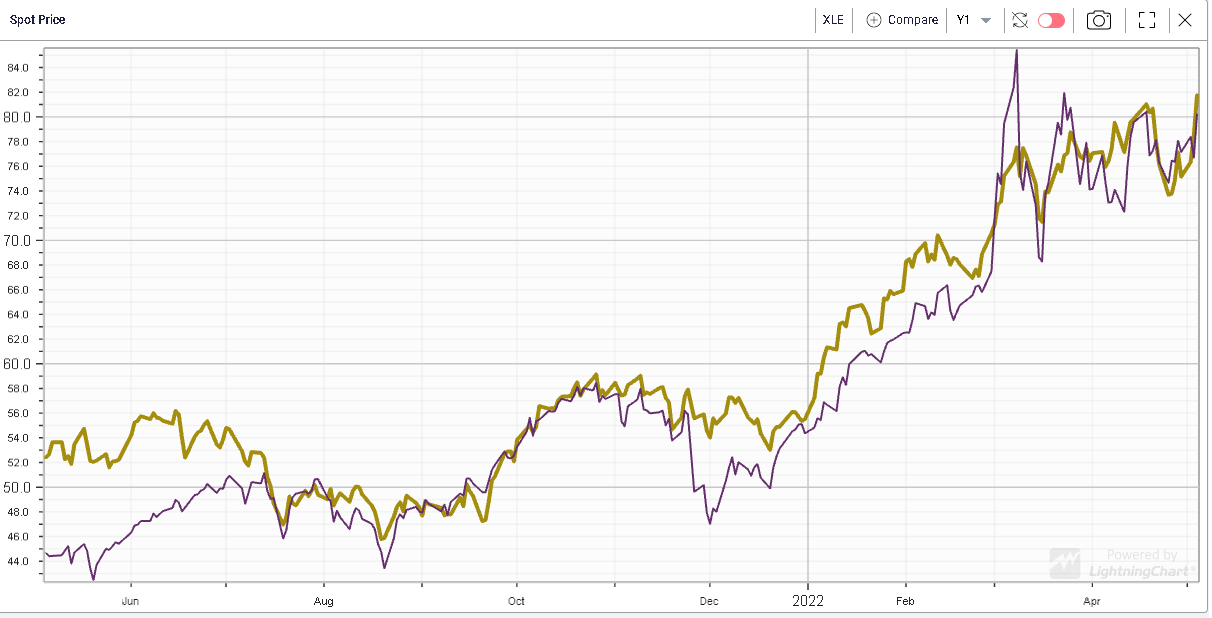
The energy space has been particularly strong over the past few days and has need reached new 52 weeks high. Comparing the performance of the sector in yellow above with the performance of the USO (Crude OIL ETF), we can see that Energy equities have outperformed the underlying commodity recently. |
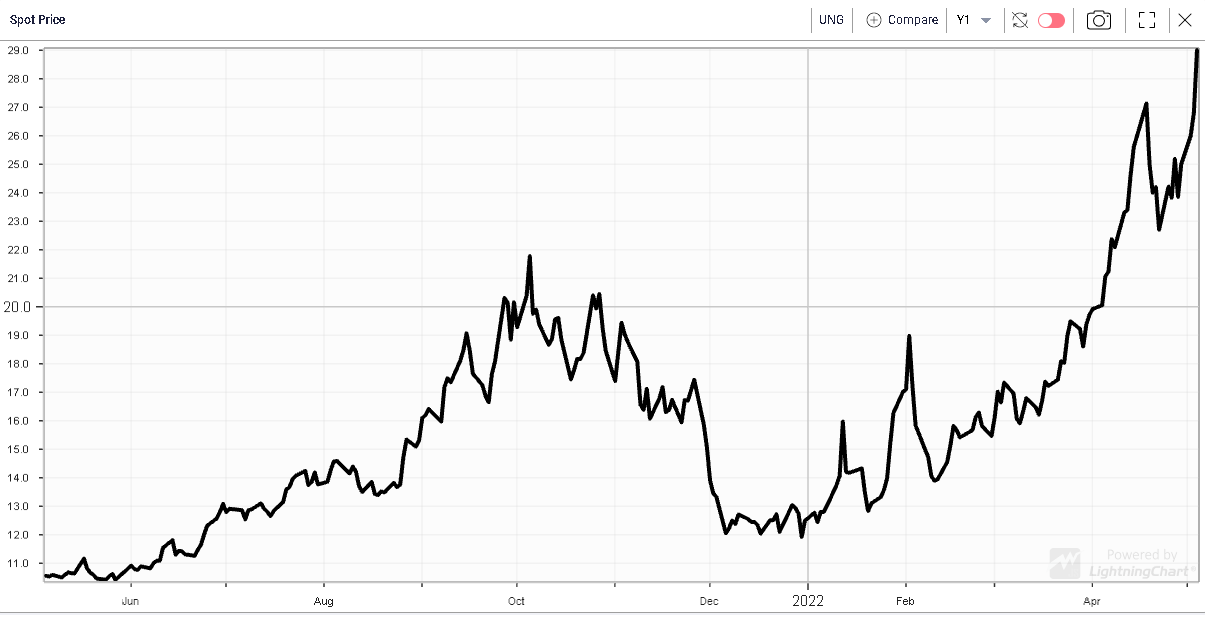
This has happened as Natural Gas, proxied here by the UNG ETF has rallied and reached new 12 months highs. |
|
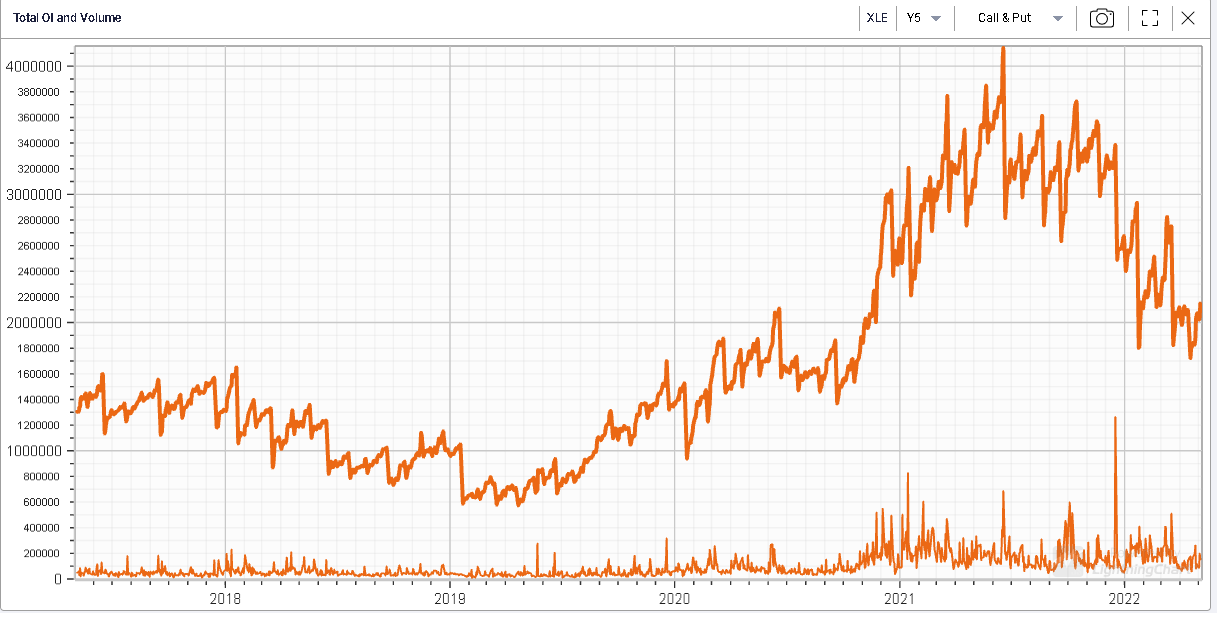
Despite that performance, volume and open interest in the sector remain fairly low historically as evidenced by the below chart over the last 5 years. |
|
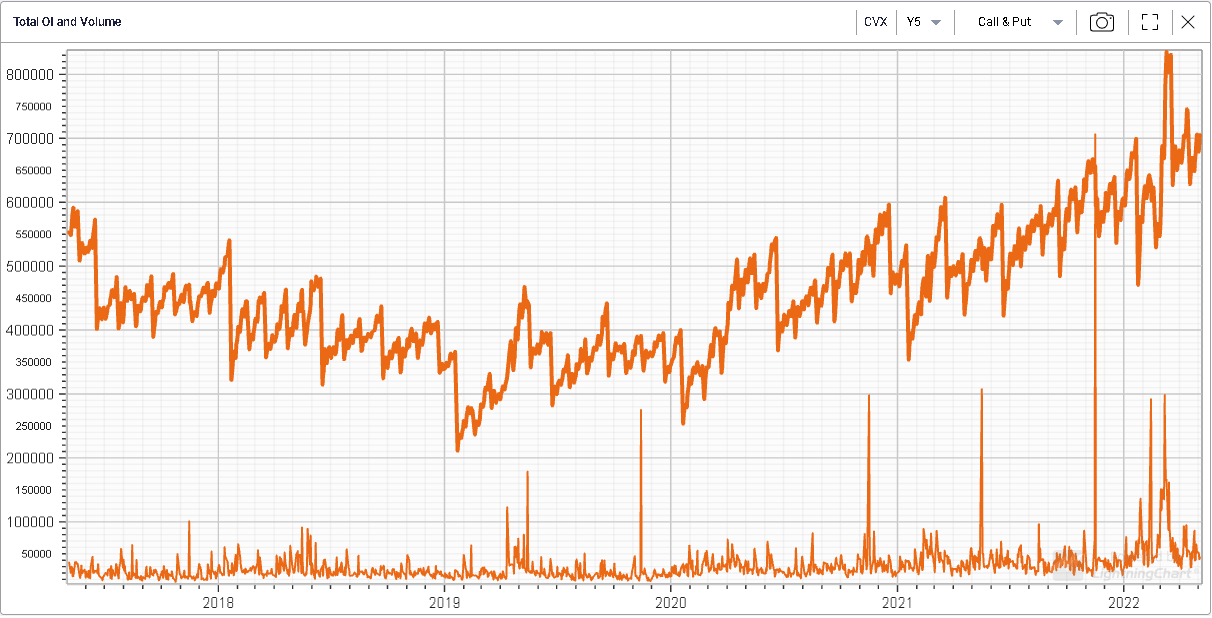
Against this backdrop, CVX really stands out with not only a stellar performance in 2022 up 40% but also with a decent increase in both volume and open interest on the options side. |
|
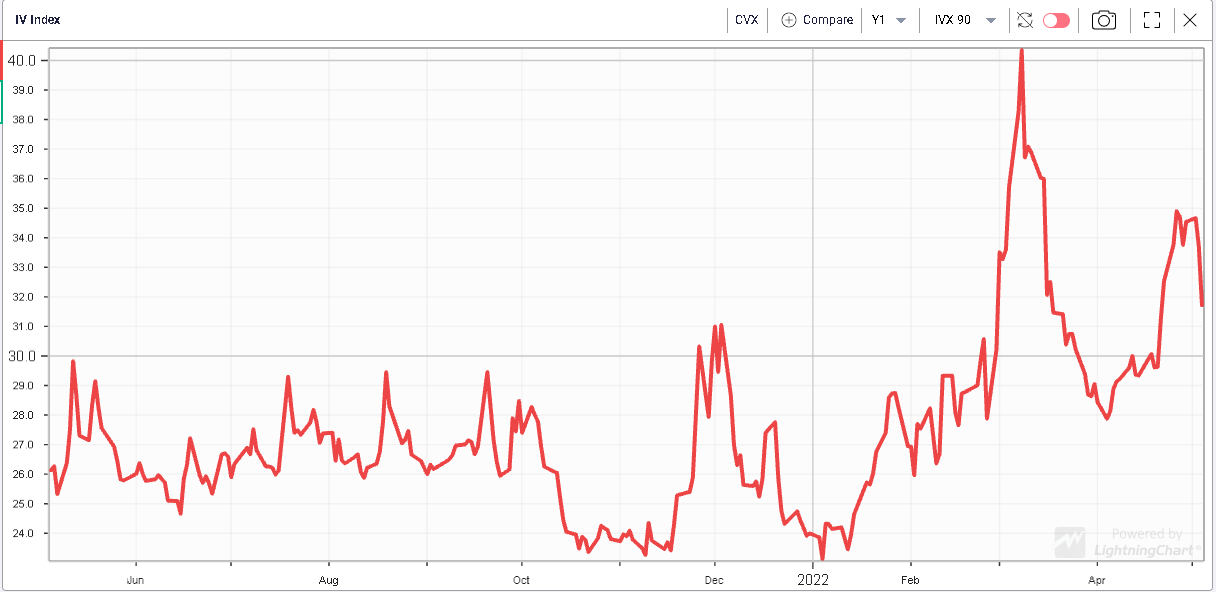
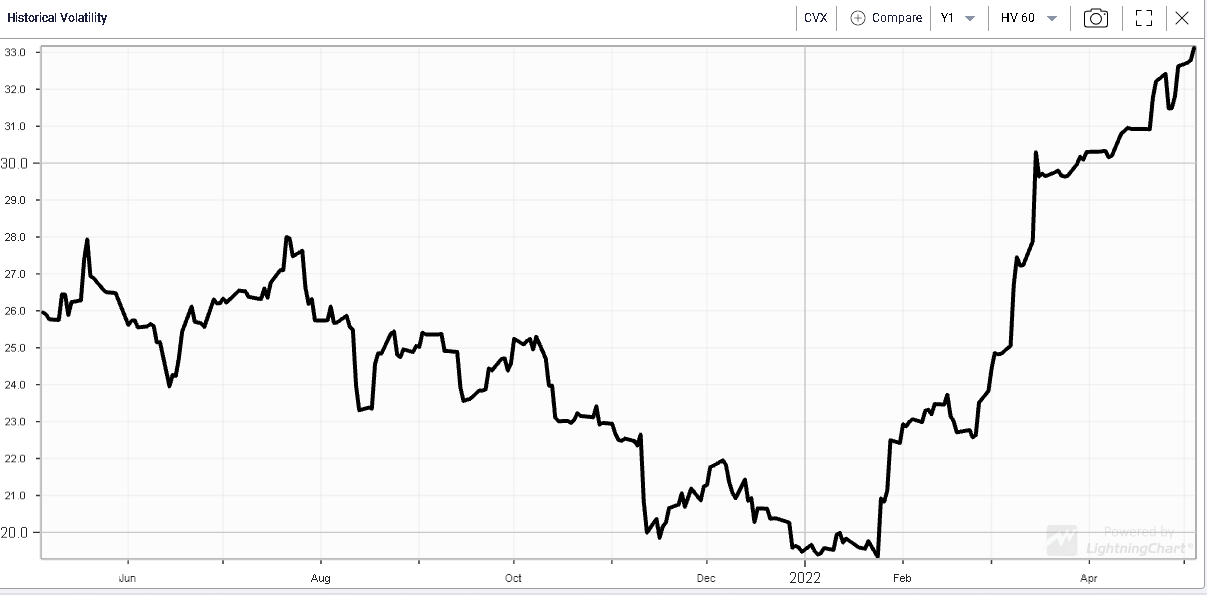
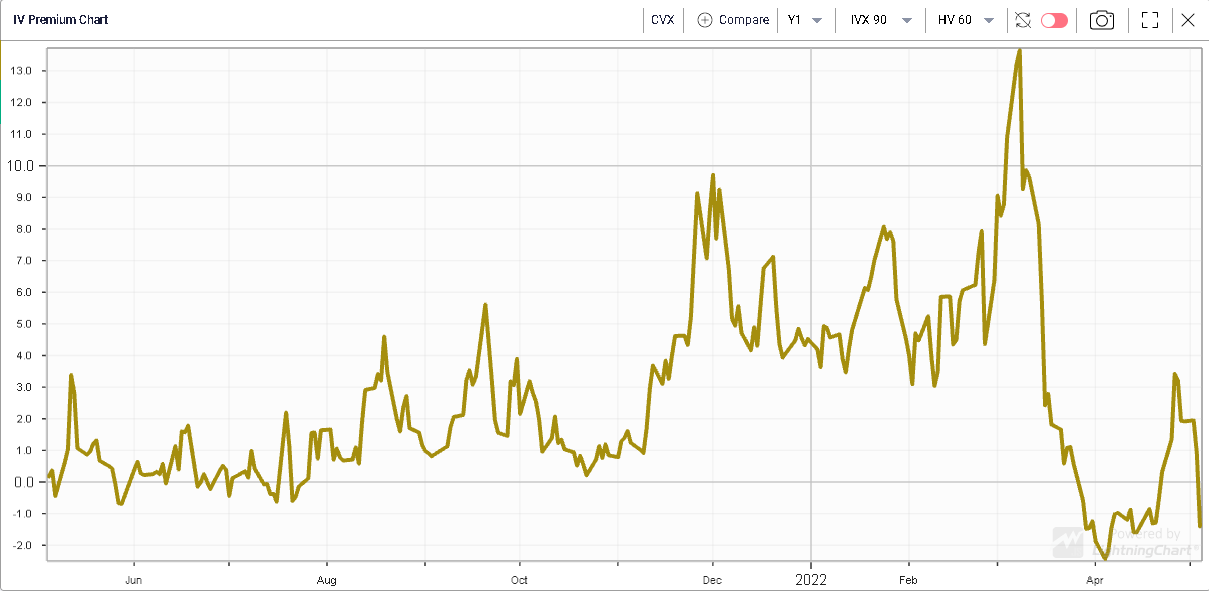
Although implied volatility has increased over the last 12 months, it has happened while realized volatility also picked up. The resulting effect is an IVX Premium that trades negative and very close to its lowest value in a year. |
90 Days IVX for CVX over the last 12 months |
60 Days Realized Volatility for CVX over the last 12 months |
90d/60d IVX Premium for CVX over the last 12 months |
A negative IVX premium shows that options traders no longer expect future volatility to increase from its current level but rather to normalize. It has been used by some traders as a way to gauge complacency or fear by market participants. |
Disclaimer - This information is provided for general information and marketing purposes only. The content of the presentation does not constitute investment advice or a recommendation. IVolatility.com and its partners do not guarantee that this information is error free. The data shown in this presentation are not necessarily real time data. IVolatility.com and its partners will not be liable for any loss or damage, including without limitation, any loss of profit, which may arise directly or indirectly from the use or reliance on the information. When trading, you should consider whether you can afford to take the high risk of losing your money. You should not make decisions that are only based on the information provided in this video. Please be aware that information and research based on historical data or performance do not guarantee future performance or results. Past performance is not necessarily indicative of future results, and any person acting on this information does so entirely at their own risk. |