Making sense of IVX Premium |
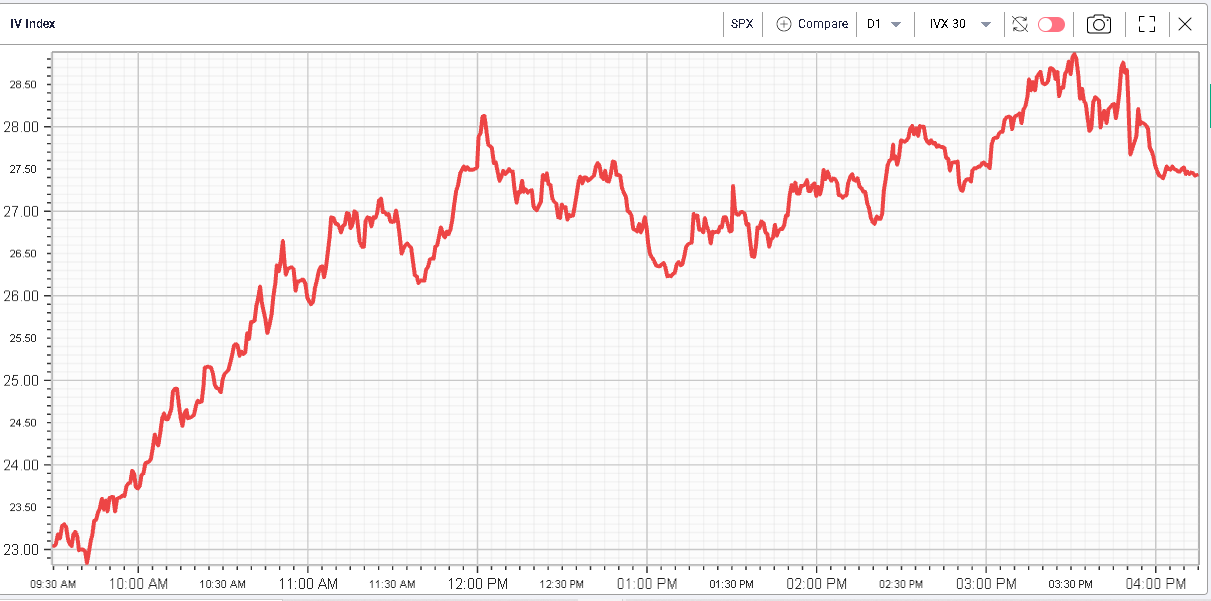
What a turnaround in the market, NDX closed 5% lower, SPX 3.6% lower and the DJIA 3.1% lower. It will not come as a surprise that implied volatilities jumped right back up with the SPX 30d IVX moving from 23 around the open to around 28 by the close. |
|
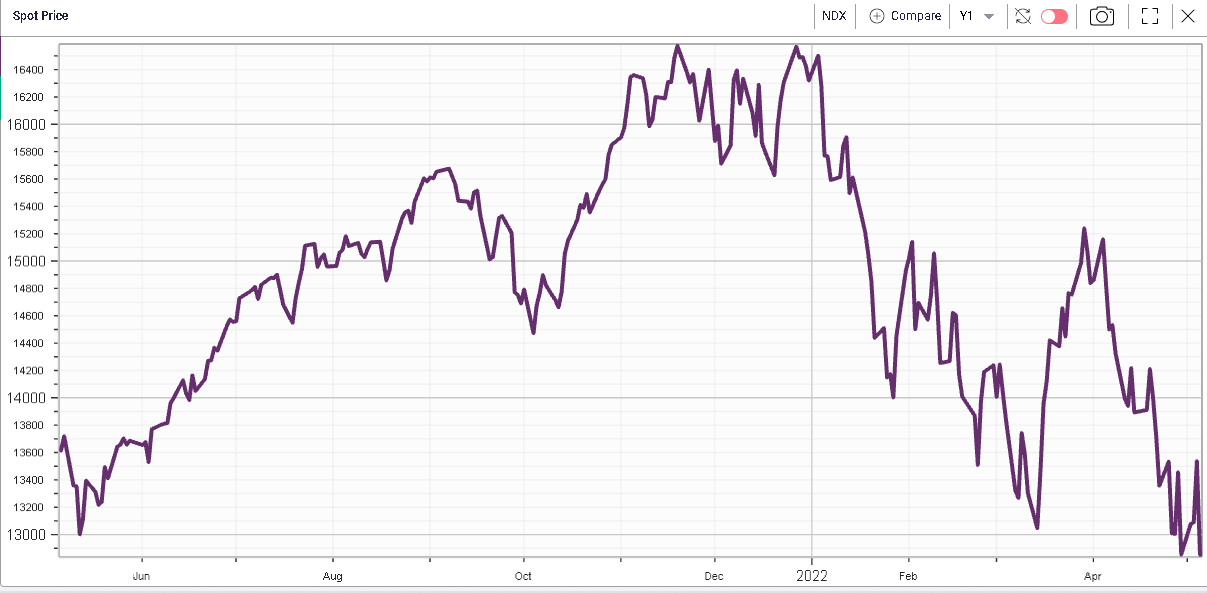
The NDX broke its recent lows and settled below the 13,000 mark, an important psychological level that supported the market and stalled the selling pressure over the past few days. |
|
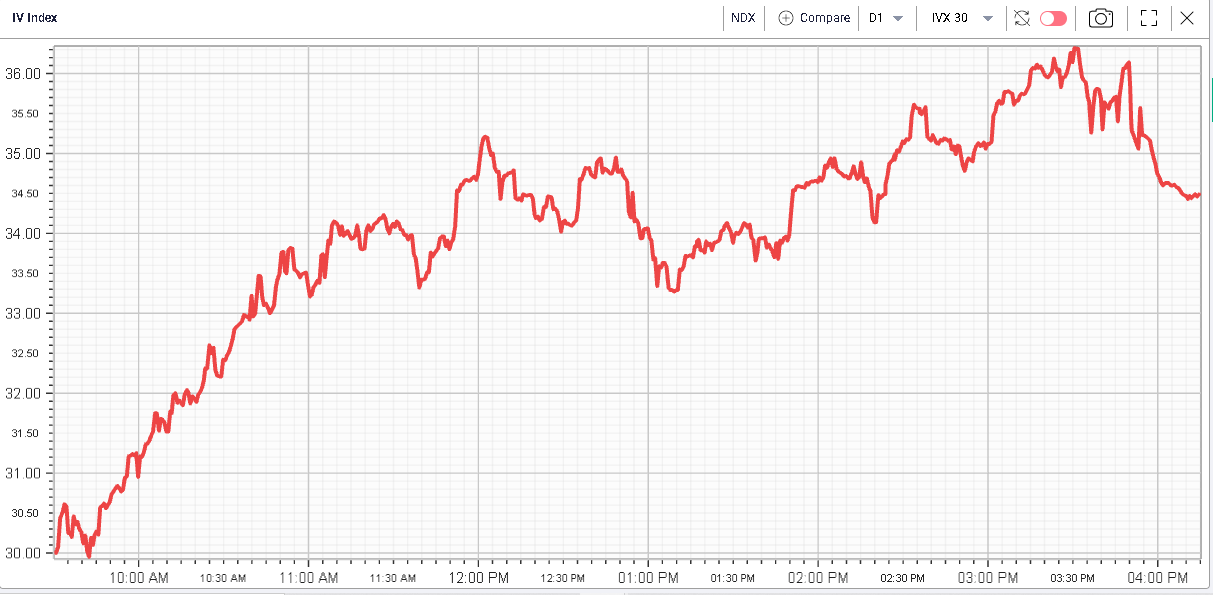
Implied Volatility in the NDX jumped significantly as well with 30d IVX opening around 30 and finishing about 5 points higher by 4pm. |
|
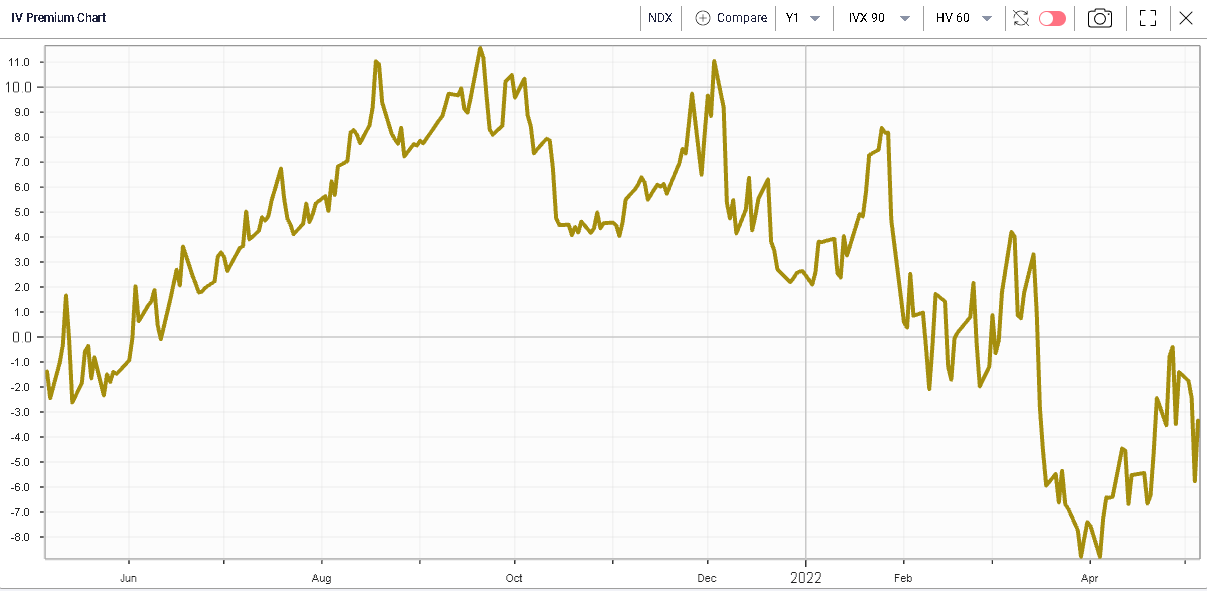
Given the significant increase in implied volatility, it could be tempting to assume that volatilities now look rich. One of the charts we offer with IVolLive is the IVX Premium chart in order to read the message that the market is sending on that point. |
In a nutshell, it allows our users to visualize the spread between implied volatility and realized volatility in order to better understand what market makers are pricing. When making a market in an option, a trader will generally rely on two factors to make a quick evaluation of the implied volatility to use: |
|
In other words, by looking at the IVX Premium, traders are able to assess what options traders are suggesting about the future of volatility. |
Looking at the NDX as an example, we can see that the IVX Premium is currently trading negative. That simply means that the IVX 90 is trading below the HV 60 as those are the metrics we have selected for this analysis. |
In other words, if a trader had bought 90d implied volatility 3 months ago at the same level as where it is now and carried it over the following 90 calendar days (or roughly 60 trading days), he would have earned around 3.3% of volatility. This might be a little complicated at first but it is fairly easy to grasp. |
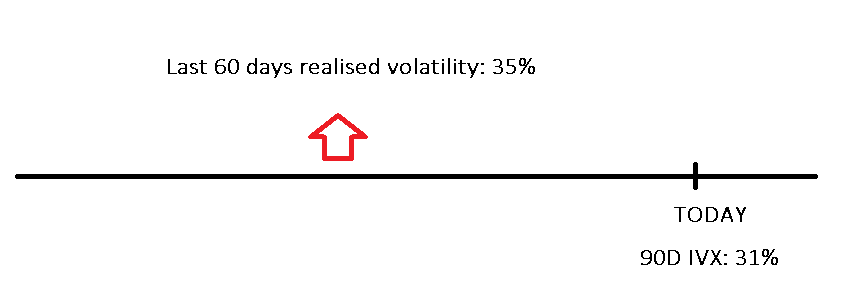
The following diagram (values not accurate, for example only) might help frame things in context: |
|
We can see that we are comparing periods of time which are not synchronous but this is the best we can do in the absence of being able to predict the future. |
The following charts show the IVX Premium for the NDX and the SPX. |
|
The NDX is negative and SPX is basically implied where it has realized. This could be read as options traders betting that volatility is more likely to be lower over the next 60 trading days than where it was for the prior 60 trading days. |
The worst performing sector for the day was consumer discretionary which closed 5.6% lower. TSLA was down 8.3%, AMZN finished 7.6% lower. Technology also underperformed down around 4.8% with names like AAPL finishing 5.6% lower and MSFT closing 4.4% lower. Utilities outperformed on the day finishing only 1% lower. |
Disclaimer - This information is provided for general information and marketing purposes only. The content of the presentation does not constitute investment advice or a recommendation. IVolatility.com and its partners do not guarantee that this information is error free. The data shown in this presentation are not necessarily real time data. IVolatility.com and its partners will not be liable for any loss or damage, including without limitation, any loss of profit, which may arise directly or indirectly from the use or reliance on the information. When trading, you should consider whether you can afford to take the high risk of losing your money. You should not make decisions that are only based on the information provided in this video. Please be aware that information and research based on historical data or performance do not guarantee future performance or results. Past performance is not necessarily indicative of future results, and any person acting on this information does so entirely at their own risk. |