20% chance that the NDX trades 14,000 within a month |
A very heavy day to start the week with NDX closing 4% lower, SPX -3.2% and DJIA -2%. Implied volatilities moved higher, the IVX was up 5 points for the NDX, 4.5 points for the SPX and 2.5 points for the DJIA. |
Looking at stocks, defensives outperformed once again with names like JNJ, AMGN or MMM gaining on the day despite the generally negative mood. JNJ finished 0.54% higher, AMGN +1.16% and MMM +1.91%. |
This creates a market that favors active traders who can navigate tumultuous markets and book profits and losses rapidly. This is in stark contrast to what had prevailed for the past few years where dip buyers were encouraged to hold on to their positions at least until new highs were established. |
If you did not have a chance to read yesterday’s market update about the importance of boring stocks, it may be worth taking a minute to read it along with other market updates. |
All single stocks in the DJIA saw their 30d IVX Â go up on the day and a lot of action happened within the index. |
First BA finished more than 10% below its previous closing price in a move that looked like capitulation as the stock broke below its recent lows to settle about 36% lower on the year so far. |
To echo a point made in the market update yesterday, CVX dropped 6.7% on the day in line with Crude oil prices correcting. Technology and Consumer Discretionary stocks also struggled with names like MSFT finishing 3.7% lower or NKE closing 2.86% below the previous day’s close. |
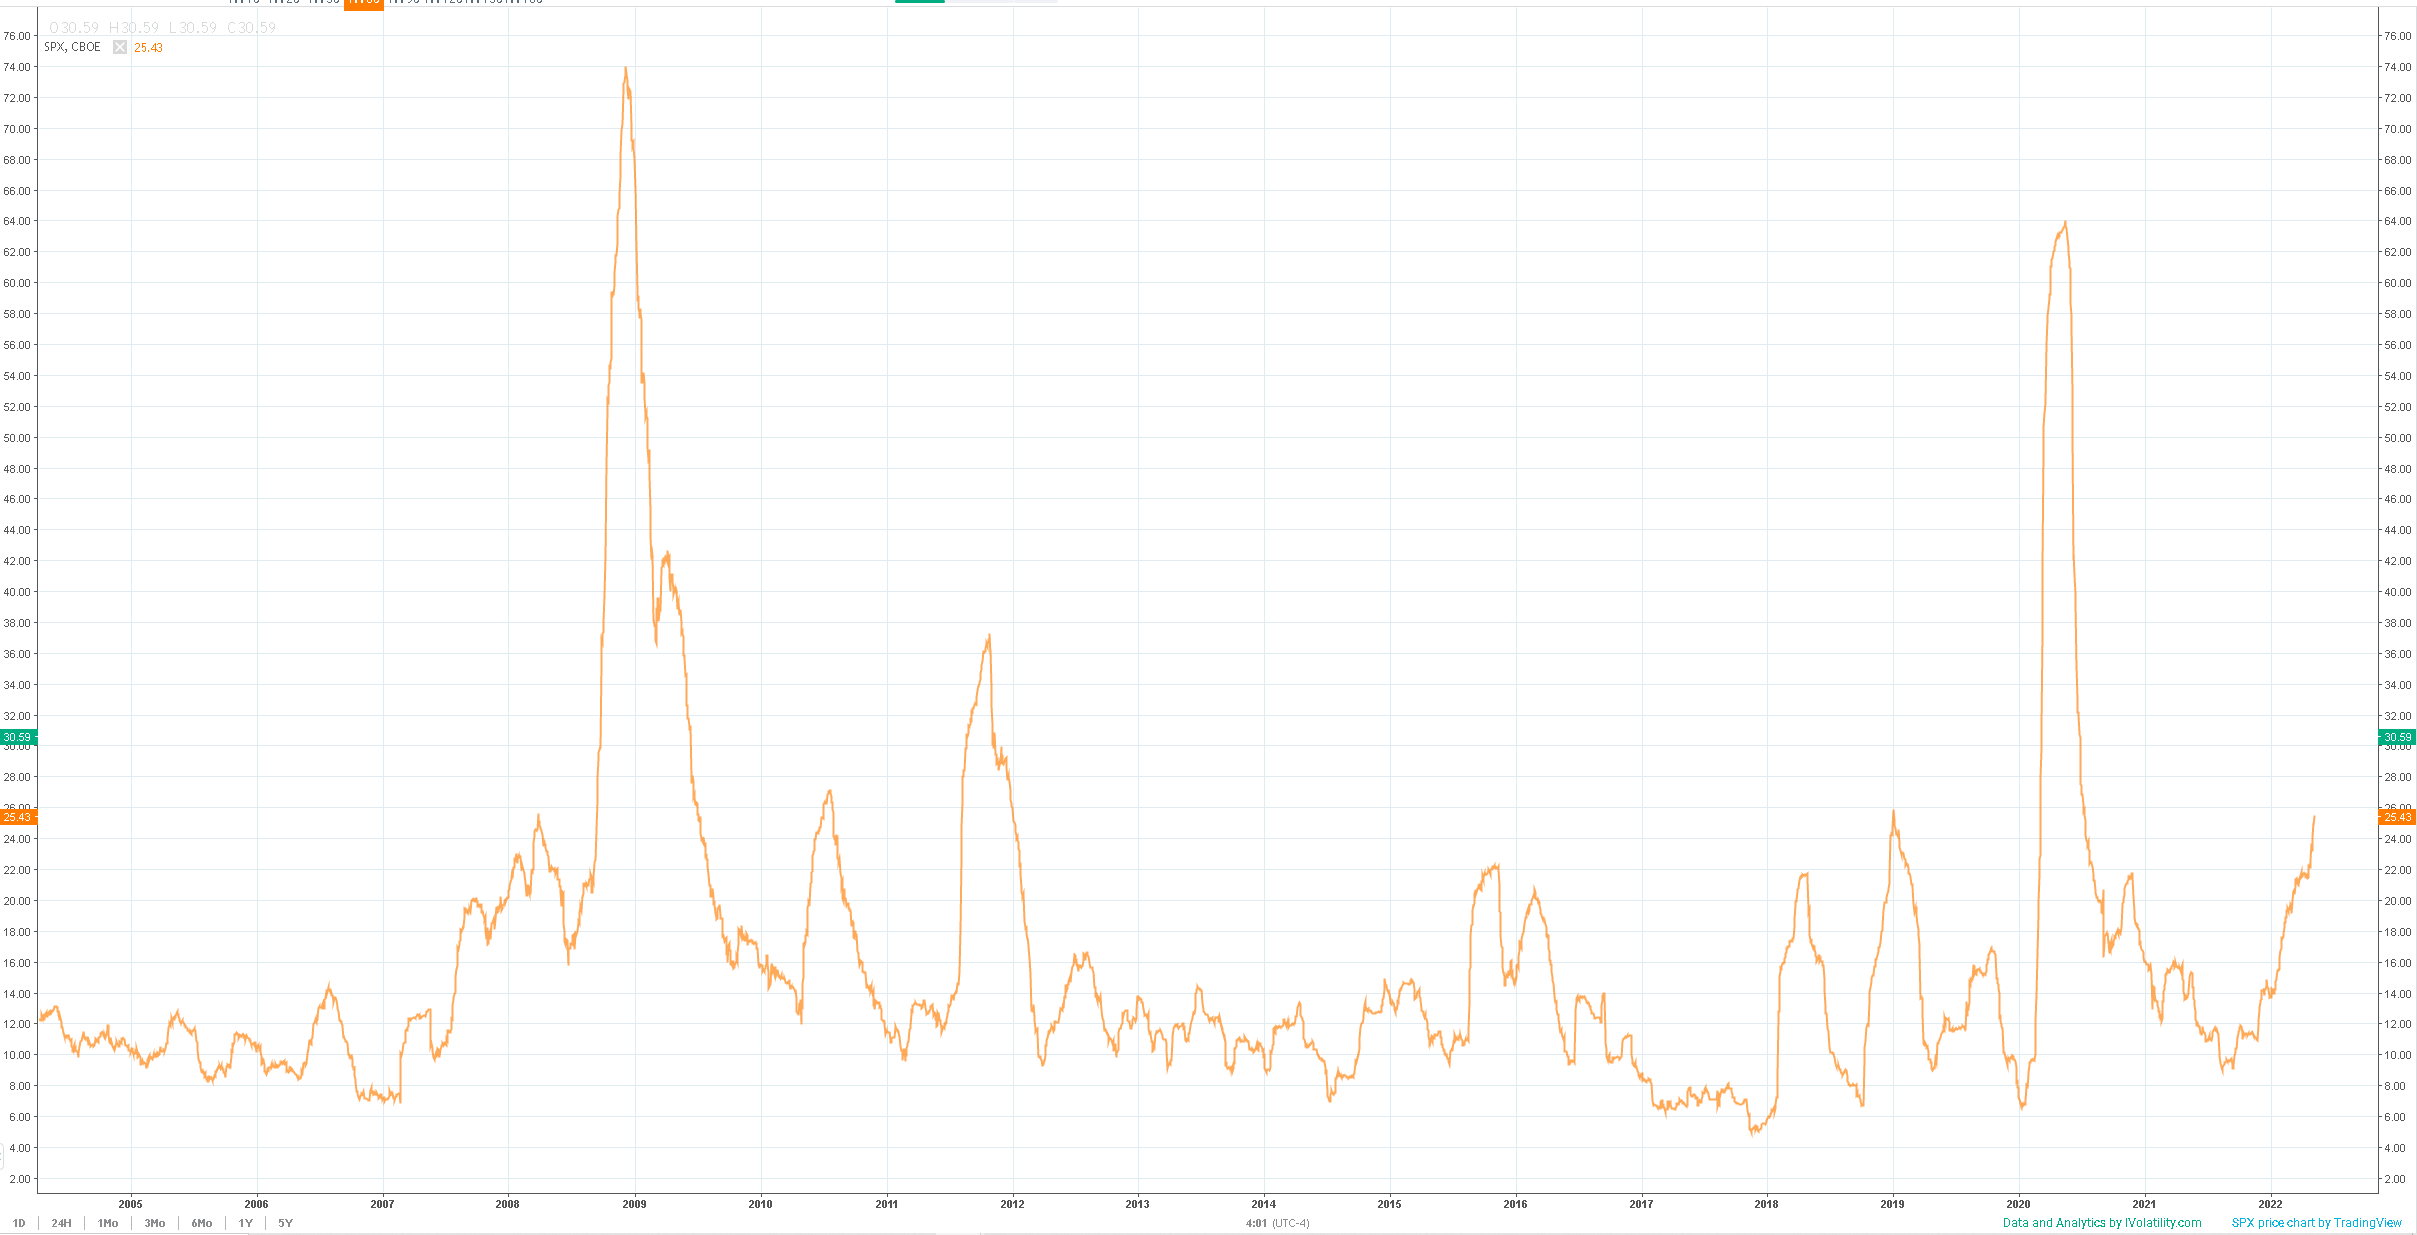
Looking at a long-term chart of 60 days realized volatility since 2005, we can see that the current expansion is already long by historical standards and has been incredibly steady compared to historical periods with a continuous increase in realized volatility that started in the middle of 2021. |
|
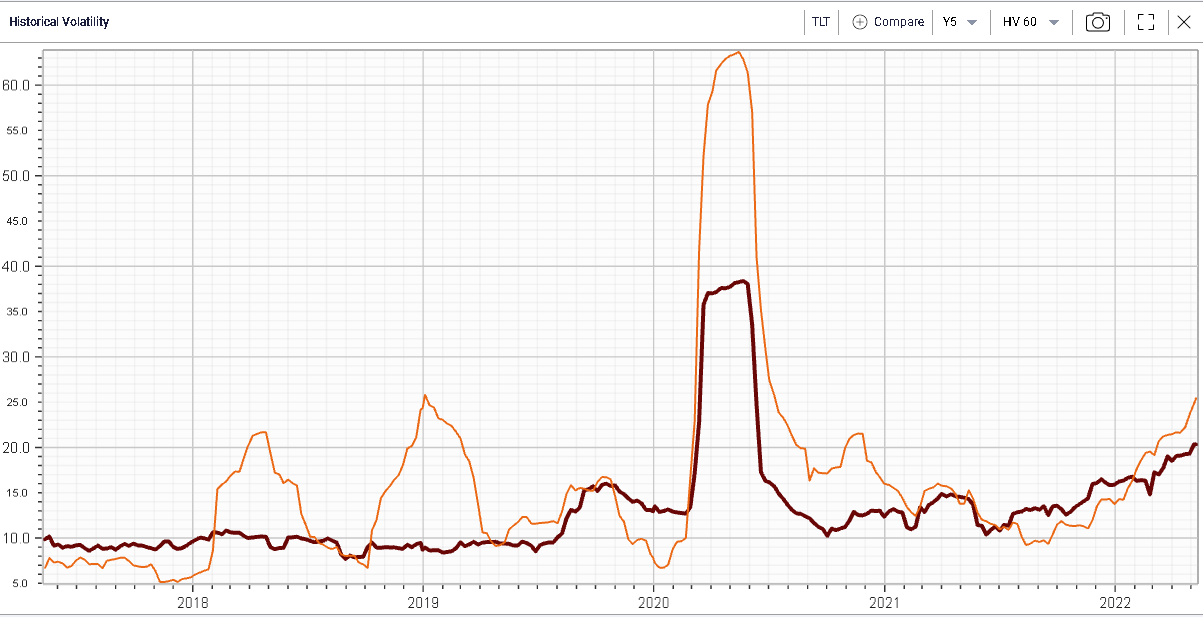
The slide in yields slowed yesterday and even reversed partly with the 10y dropping 15bps from its recent highs to finish around 3.05%. The Fixed Income market in particular on the volatility front has proved to be a driver for Equity volatility so far as shown on the below 60 days realized volatility chart for TLT in red and SPX in orange. |
|
While TLT volatility bottomed earlier during a period when the SPX realized volatility was still compressing, it gradually moved higher long before Equities caught up. The situation seems to be back in line now with both SPX realized volatility moving higher at a time where TLT realized volatility continues to expand. |
As it seems that the volatility witnessed in the Equity market is mostly exogenous so far and imported from the Fixed Income market, traders will be watching for signs that things are normalizing in that part of the world. The key question will be to understand how much of this external shock has now translated into an internal Equities problem which will most likely be addressed during Q2’s earnings season as well as with macro-economic numbers that will come over the next 2 months. |
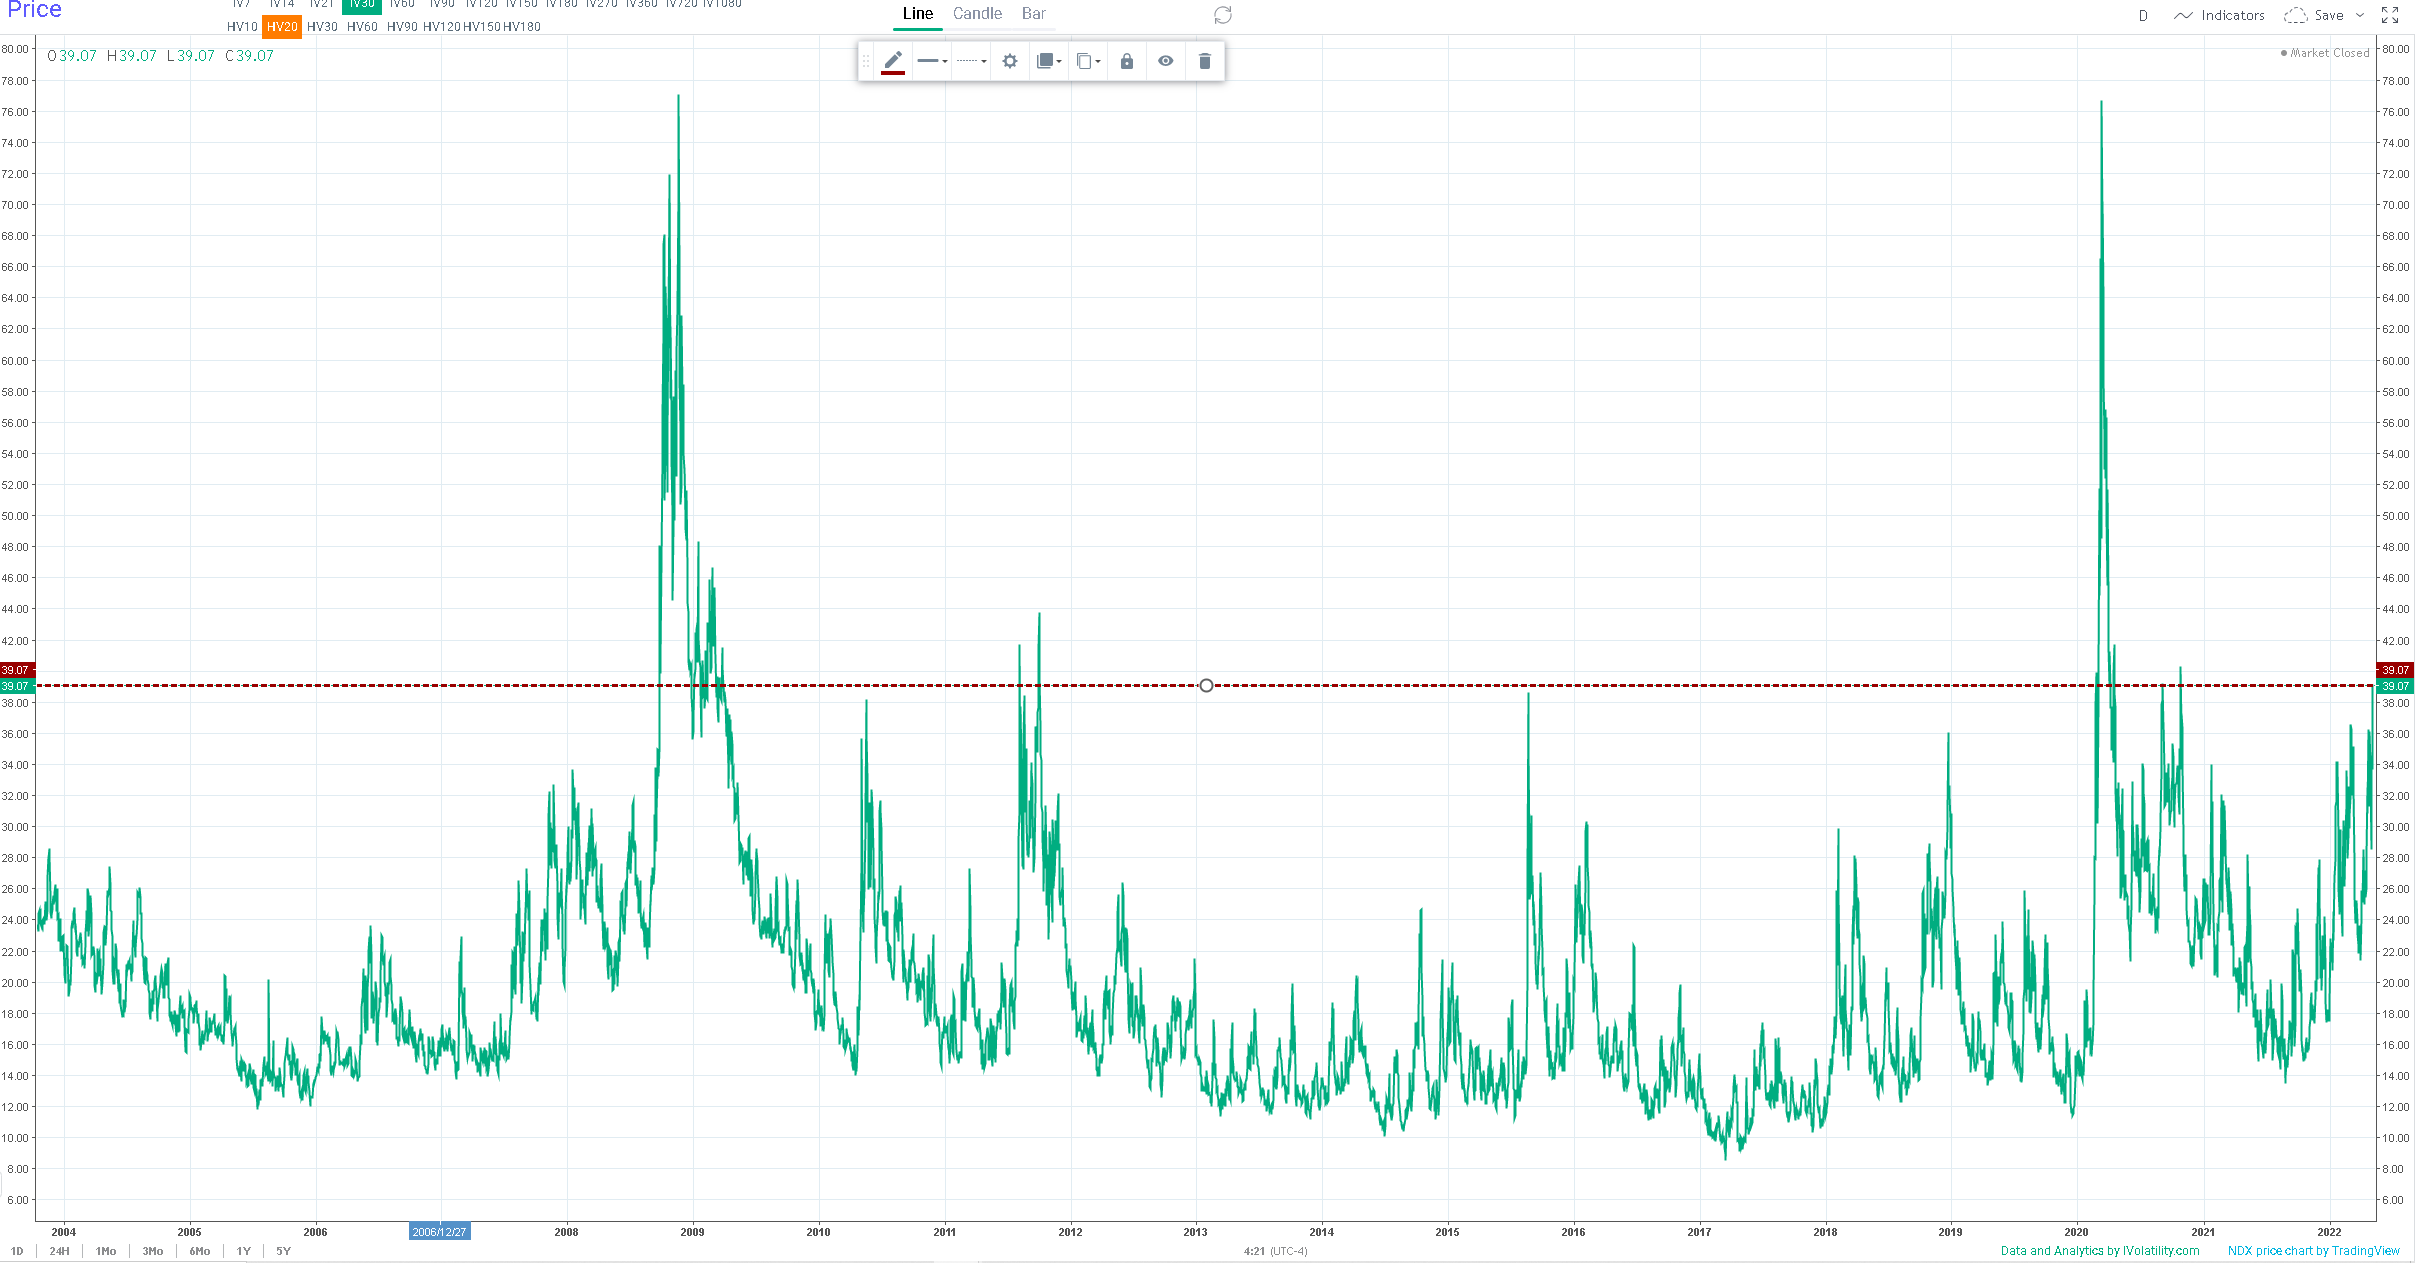
What is certain is that with implied volatilities for the next 30 days finishing around 39% on Monday, a level reached only on 4 occasions since 2004, traders need to adjust their sizes and expectations. |
|
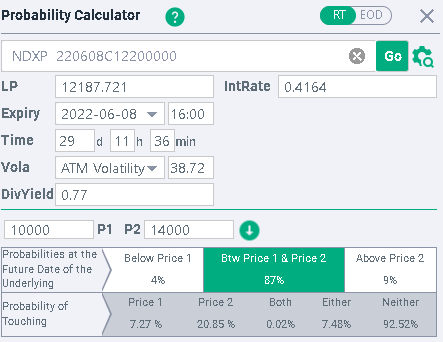
Using our probability calculator, we can estimate that there is around 4%chance of the NDX closing below 10,000 in 30 days and around 7.3% chance of the NDX touching that level at any point in time over the next month. On the upside, the options market is telling us that there is a probability of 9% that the NDX will finish above 14,000 in 30 days and 20% chance that we will touch that level at any point in time over the next month. |
|
Disclaimer - This information is provided for general information and marketing purposes only. The content of the presentation does not constitute investment advice or a recommendation. IVolatility.com and its partners do not guarantee that this information is error free. The data shown in this presentation are not necessarily real time data. IVolatility.com and its partners will not be liable for any loss or damage, including without limitation, any loss of profit, which may arise directly or indirectly from the use or reliance on the information. When trading, you should consider whether you can afford to take the high risk of losing your money. You should not make decisions that are only based on the information provided in this video. Please be aware that information and research based on historical data or performance do not guarantee future performance or results. Past performance is not necessarily indicative of future results, and any person acting on this information does so entirely at their own risk. |


