It's in the price |
Markets held steady as the SPX managed to close above the 4,000 level up 0.25%. The NDX was up 1.3% and the DJIA finished 0.26% lower. |
Sector performance was symmetrical with what we saw on Monday with defensives underperforming yesterday and technology stocks outperforming. |
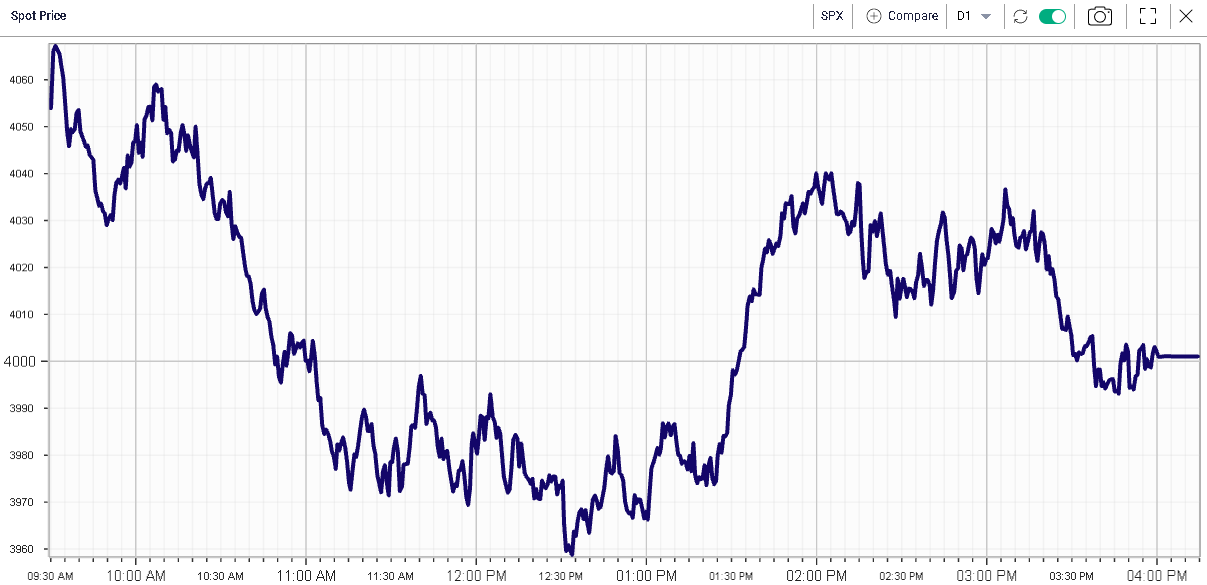
Despite an apparently quiet day, intraday volatility remained very elevated. The SPX for instance opened at its highest point of the day around 4060 before selling off to Monday’s lows at 3960. A late day rally pushed the index back around 4000. |
|
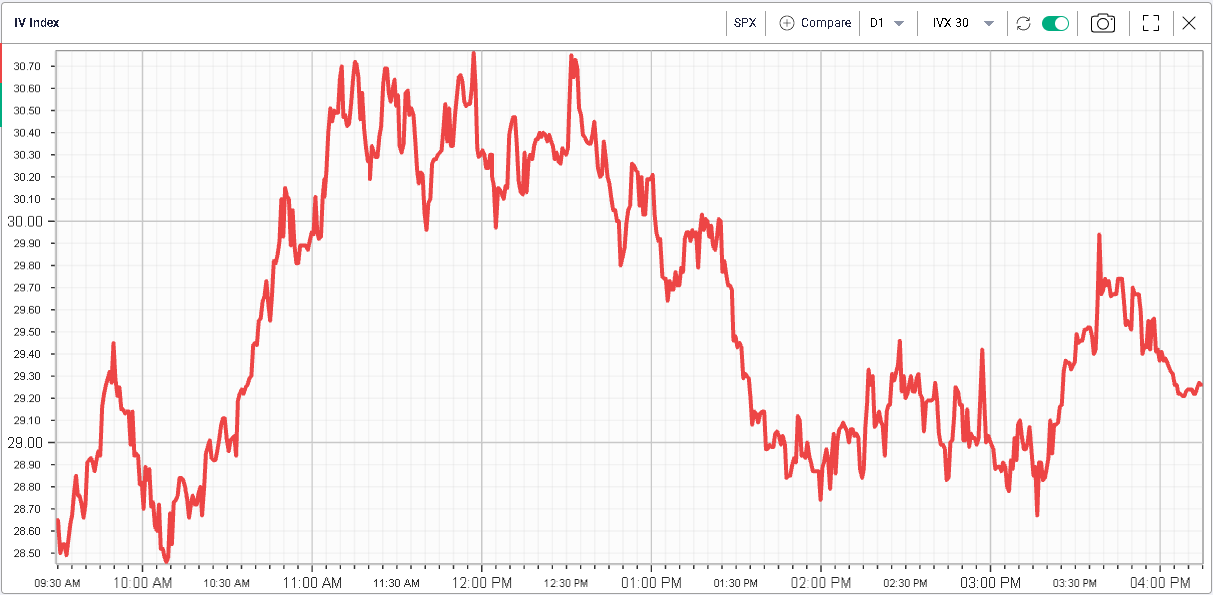
Volatilities opened around 2 points lower on the day but quickly rallied back as the index dropped. They finished the day down around 1 point in the SPX and the NDX. |
|
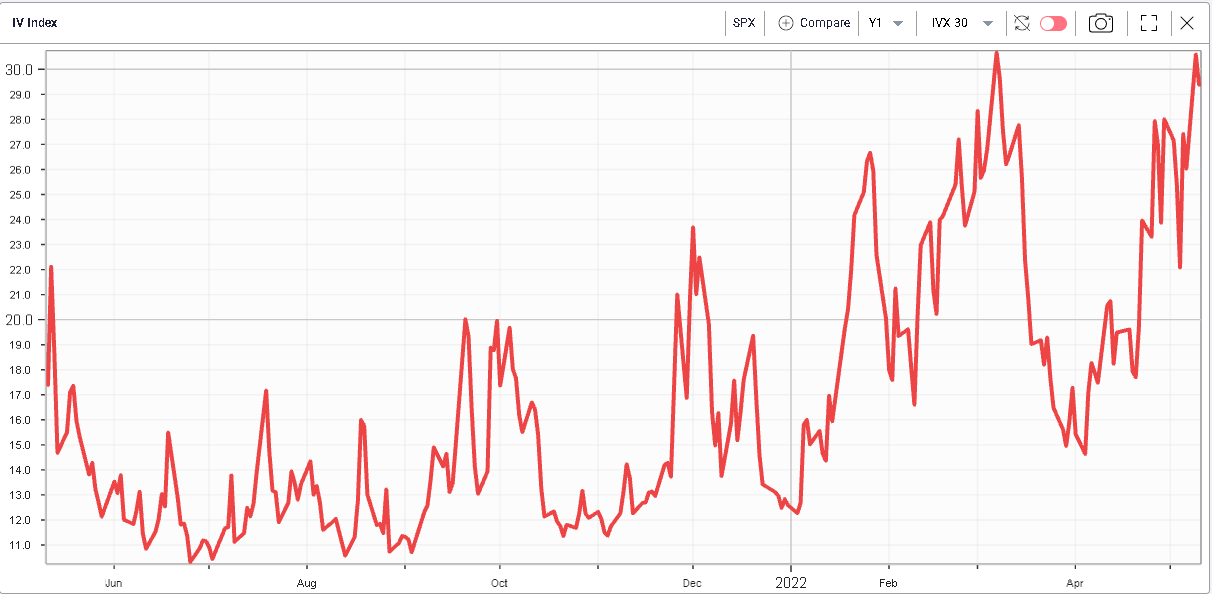
Zooming out it feels that implied volatilities have underperformed as spot went down and realized volatilities picked up. |
The below chart shows the 30d IVX over the past year which is still trading around 30, the level reached during the early March bottom. |
|
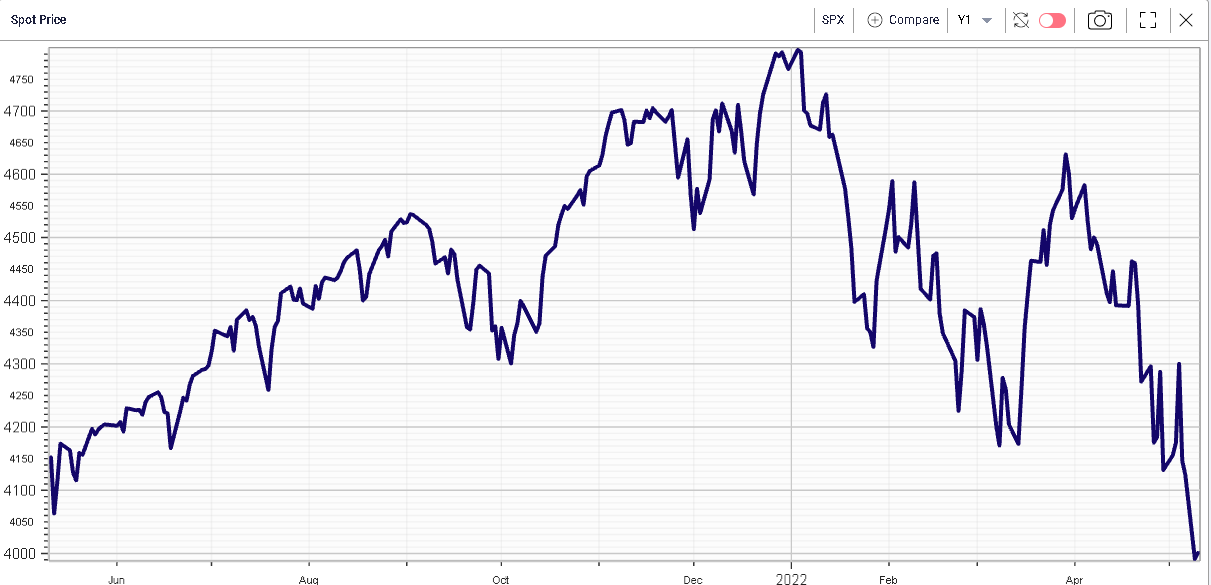
The spot market on the other hand is already much lower as shown below. |
|
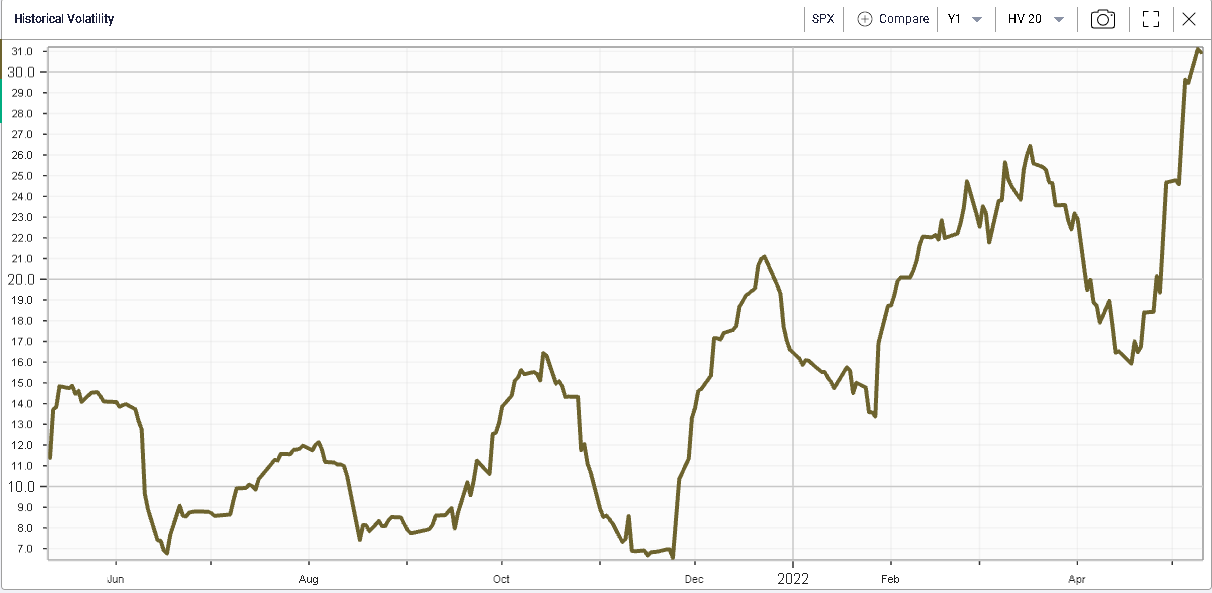
Realized volatility has also picked up meaningfully as can be seen in the next chart of 20d RV. |
|
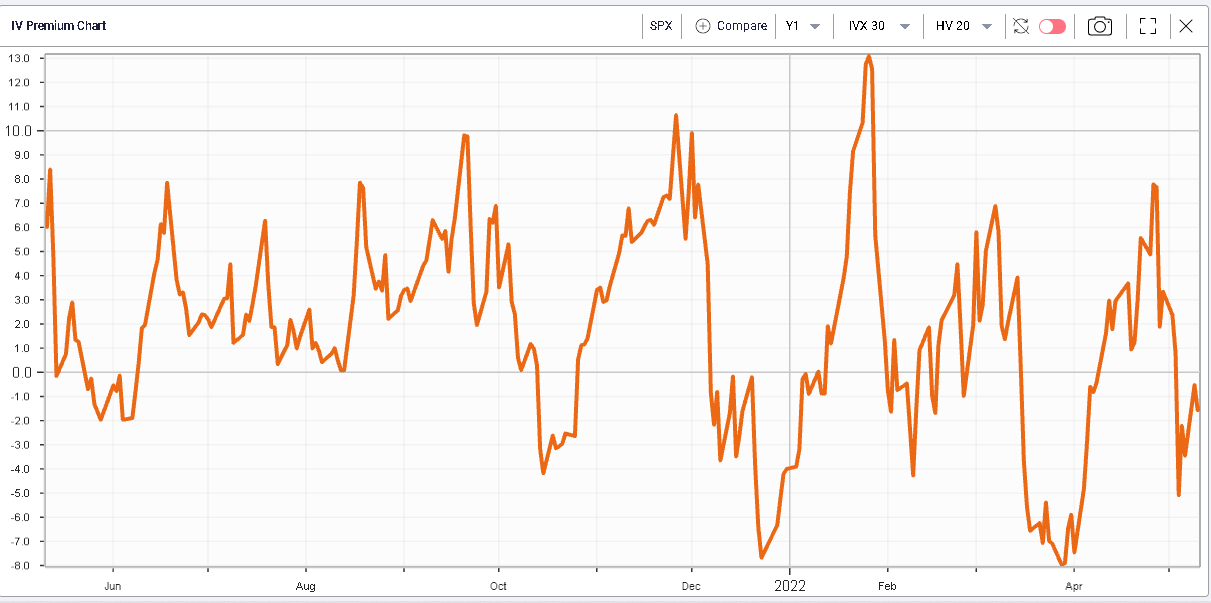
This leaves us with an IV Premium chart that looks low compared to its 12 months history. |
|
Many commentators have tried to explain this phenomenon, in particular the surprising lag that implied volatility has shown when compared with spot and realized volatility. |
In a previous market update (https://www.ivolatility.com/news.j), we described the two most important factors that drive the pricing of an option for a market maker: |
|
Point 2 refers to the uncertainty around a given situation. The Ukraine/Russia war took almost everyone by surprise. This event created a gap in volatility and forced options traders to reevaluate the possible risk associated with such an uncertain event at a time when very little was known. |
Looking at the above chart, we can see that the IV Premium jumped to 7 points, a sign that the first driver of this increase in volatility was the level of uncertainty that hit the market. |
Today things are slightly different. The negative IV Premium shows that the current implied volatility levels are much more driven by the increased realized volatility than by an anticipation of increased risks in the future. Anybody who is actively trading the market is aware of the risks involved with geopolitics, inflation or even FED hawkishness. As the old saying goes, “It’s in the price”. |
As a result, despite the volatility level in early March and early May being fairly similar, they paint highly different pictures. |
Does it mean that volatility should be sold here? Not necessarily but a tentative interpretation could be that market makers are comfortable selling options on SPX at those levels given the number of risks that are identified and discussed in the market. Should new risks arise, or some risks disappear, that evaluation would change. |
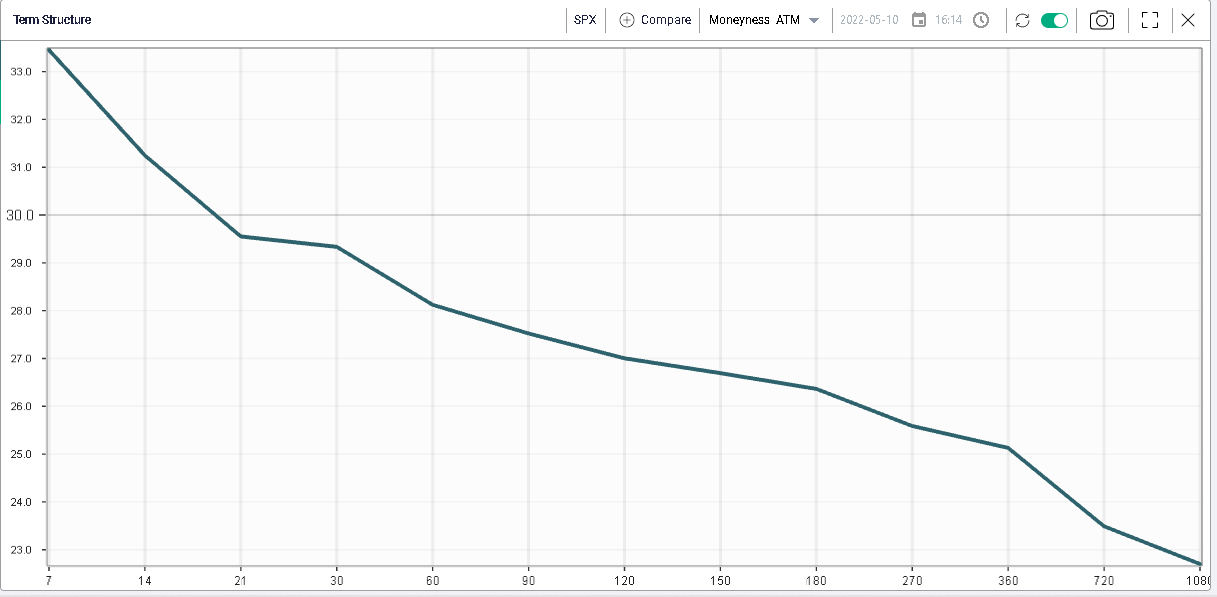
Looking at volatility by maturity, we see that the curve is downward slopping. |
|
This shows that traders seem to be assuming that some of those risks will indeed disappear over time pushing implied volatility lower. |
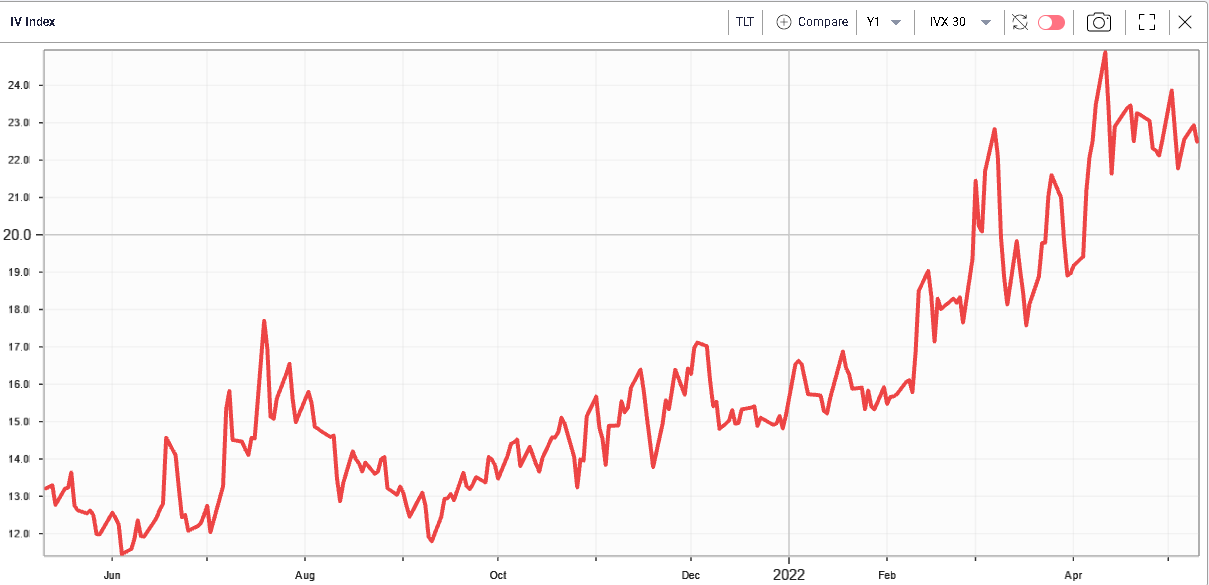
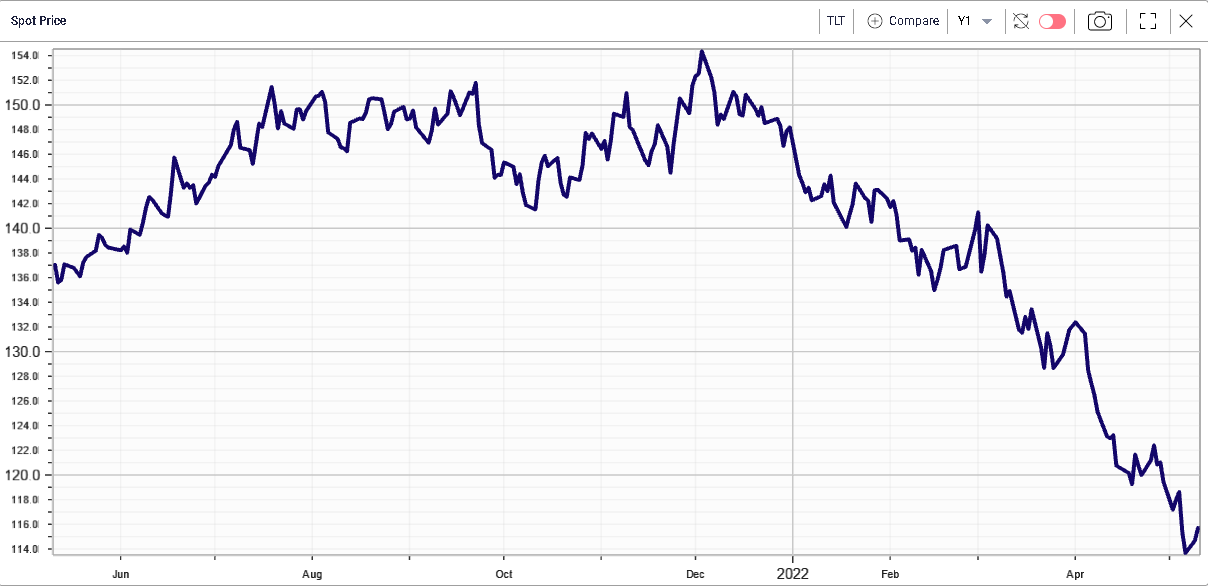
A similar phenomenon is visible in Fixed Income proxied below by the TLT ETF. Despite yields making new highs over the past days, volatility has failed to push above its recent highs. |
|
Here again, following the recent press conference by the FOMC it comes to no surprise that the FED is serious about raising rates rapidly. |
|
As a result, it may not be that surprising to see implied volatility lagging spot in the current environment. Despite a lot happening both in terms of realized volatility and macroeconomic events, a lot has already been assessed and priced by the market. |
Disclaimer - This information is provided for general information and marketing purposes only. The content of the presentation does not constitute investment advice or a recommendation. IVolatility.com and its partners do not guarantee that this information is error free. The data shown in this presentation are not necessarily real time data. IVolatility.com and its partners will not be liable for any loss or damage, including without limitation, any loss of profit, which may arise directly or indirectly from the use or reliance on the information. When trading, you should consider whether you can afford to take the high risk of losing your money. You should not make decisions that are only based on the information provided in this video. Please be aware that information and research based on historical data or performance do not guarantee future performance or results. Past performance is not necessarily indicative of future results, and any person acting on this information does so entirely at their own risk. |