Can Boeing fly again? |
Implied volatilities continue to underperform spot as US indices try to stabilize and absorb the strong selling pressure that has been observed over the past few days. |
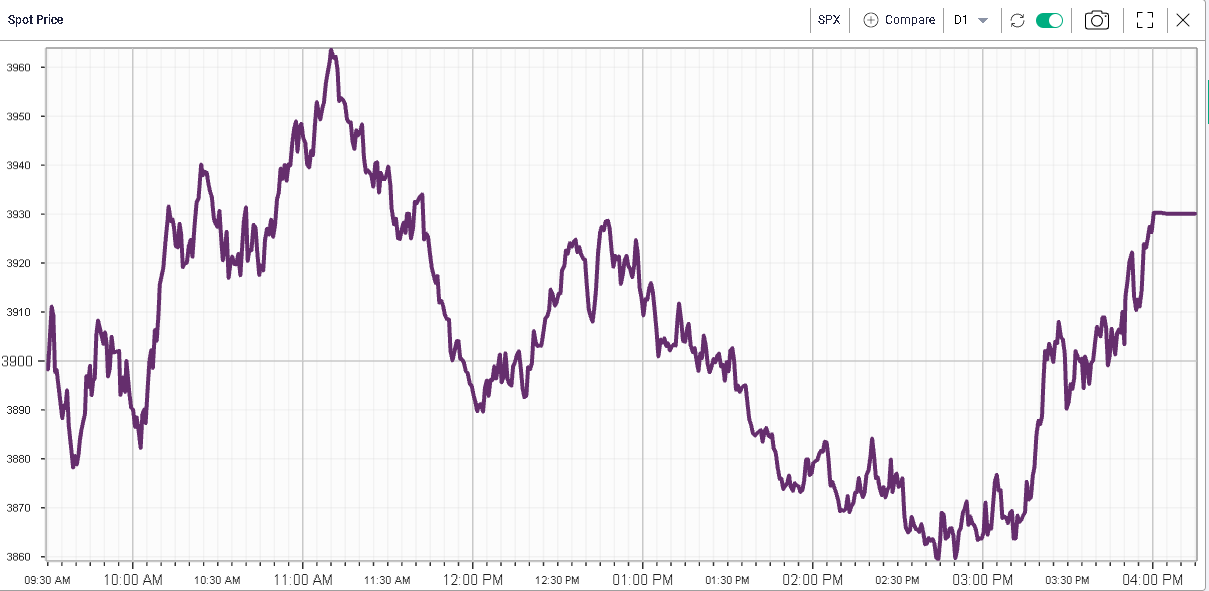
The chart below shows the 1-minute snapshot chart of SPX intraday with an intraday range greater than 100 points. We settled towards the upper end after heavy selling hit the market around 11am. |
|
|
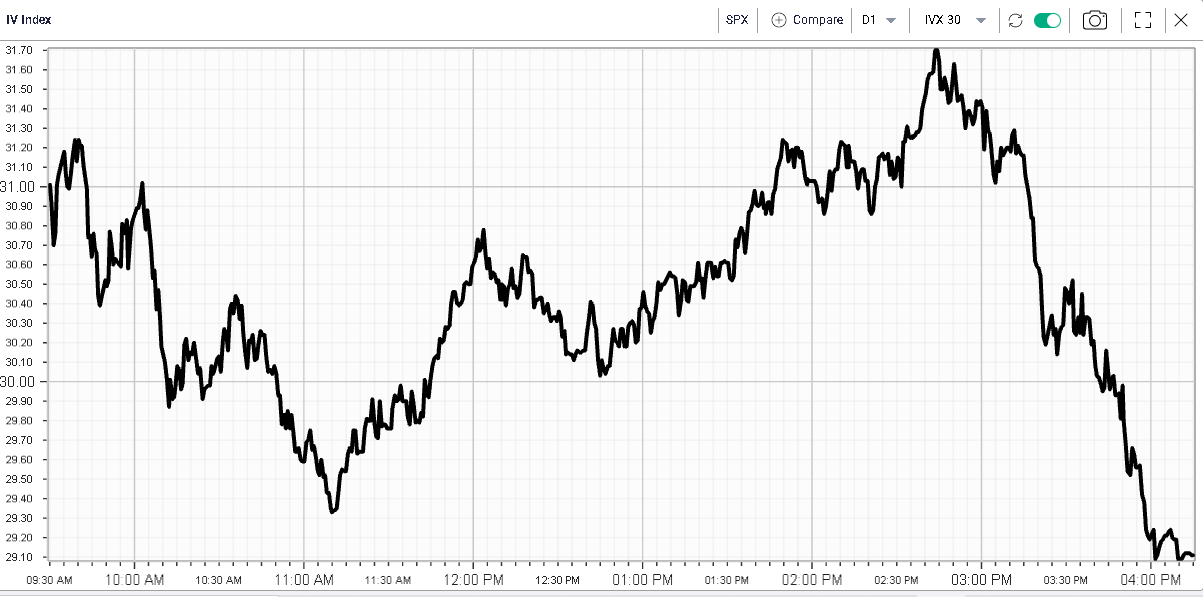
The SPX finished -0.13%, the NDX -0.18% and the DJIA -0.33%. Implied volatilities closed around 0.5 lower. |
Under the surface, some of the names that have been under intense selling pressure recently have continued to underperform despite the overall stability in the market. |
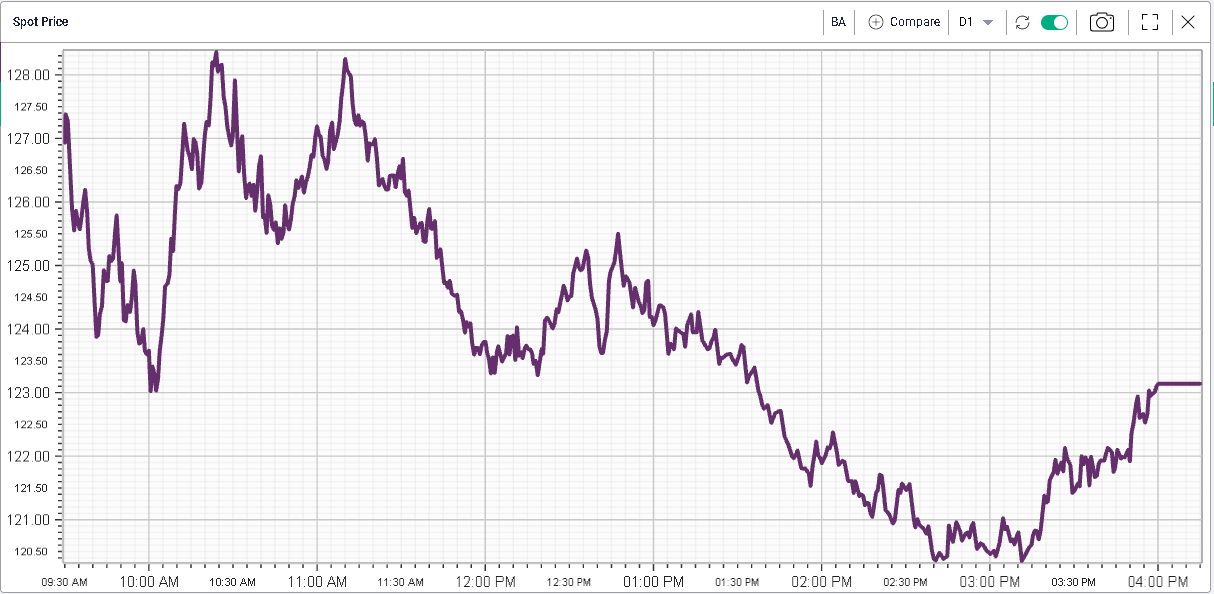
For instance, BA was down almost 5% on the day and about 41% on the year. |
|
|
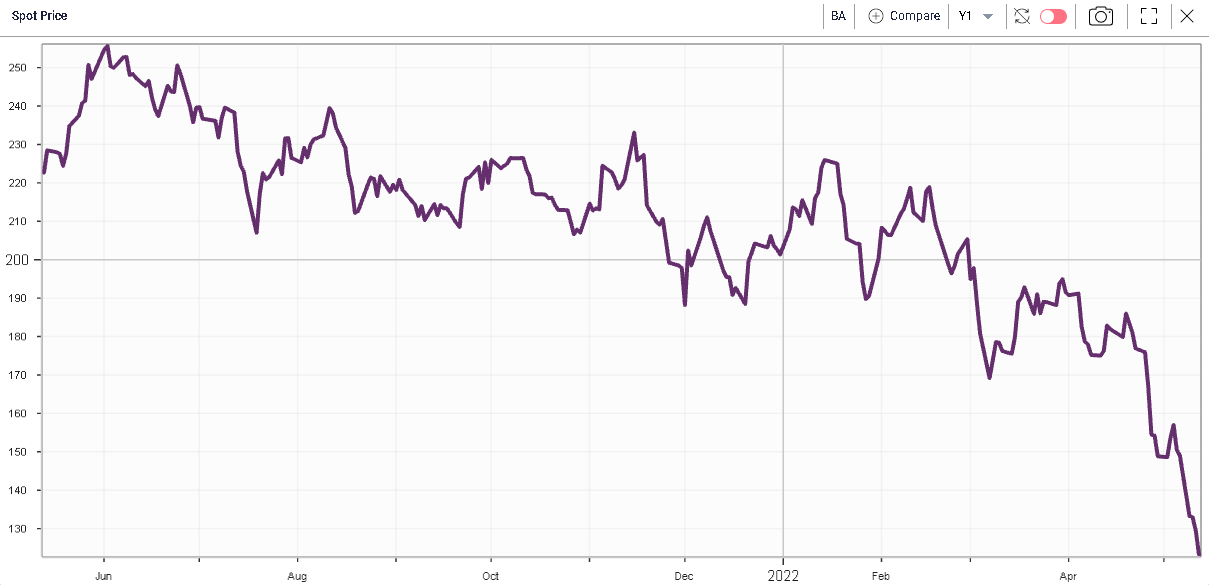
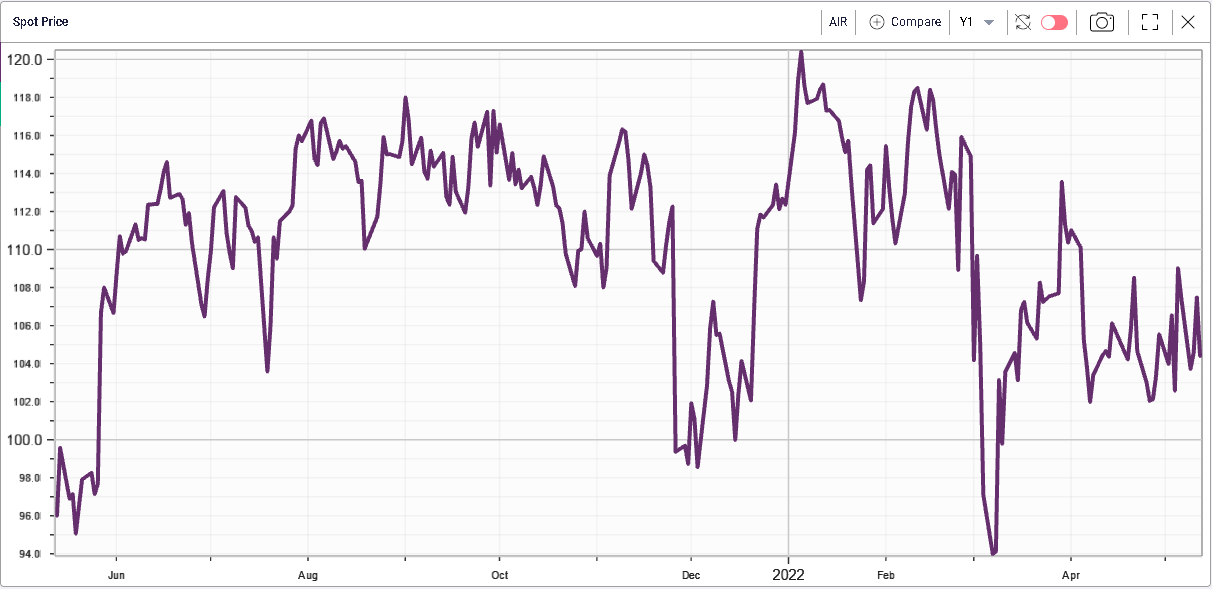
In comparison, Airbus, the European aerospace corporation has remained relatively steady as shown in the below 12 months spot price chart. |
|
That comparison shows that the issues faced by Boeing are no solely linked to the industry but are also specific to the company with Airbus seemingly gaining market share at the expense of Boeing. |
According to a Seattle Times article, deliveries for Airbus are 46% ahead of those for Boeing this year. |
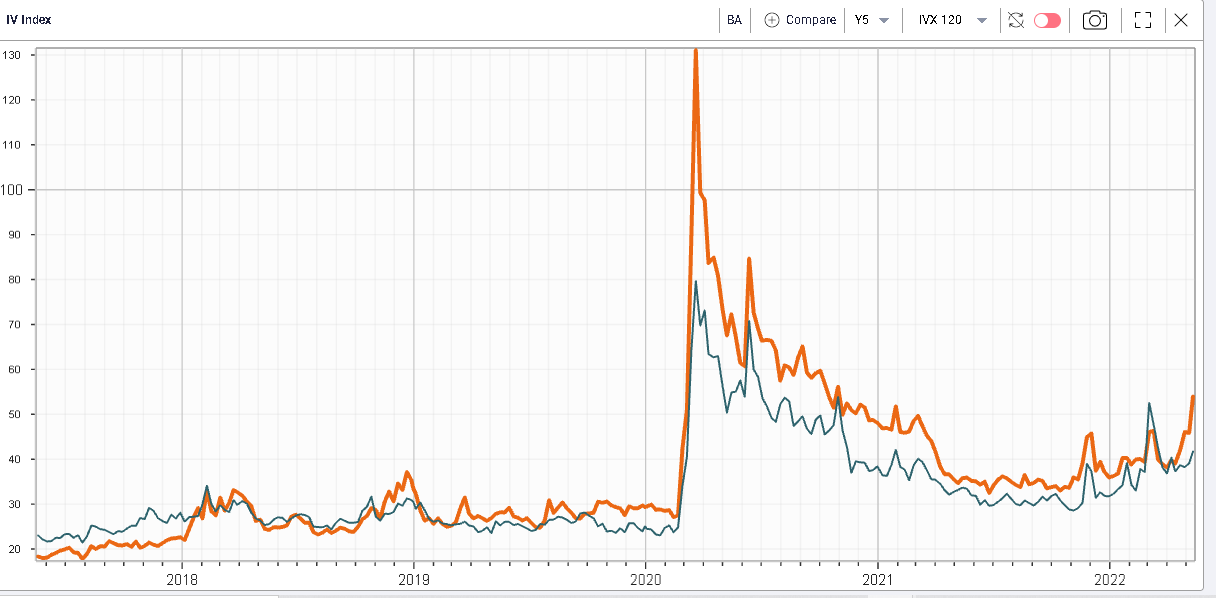
Looking at implied volatility proxied by 120d IVX shown below over 5 years, we can see that implied volatility for BA is higher than that of AIR but also that this spread has expanded recently. |
|
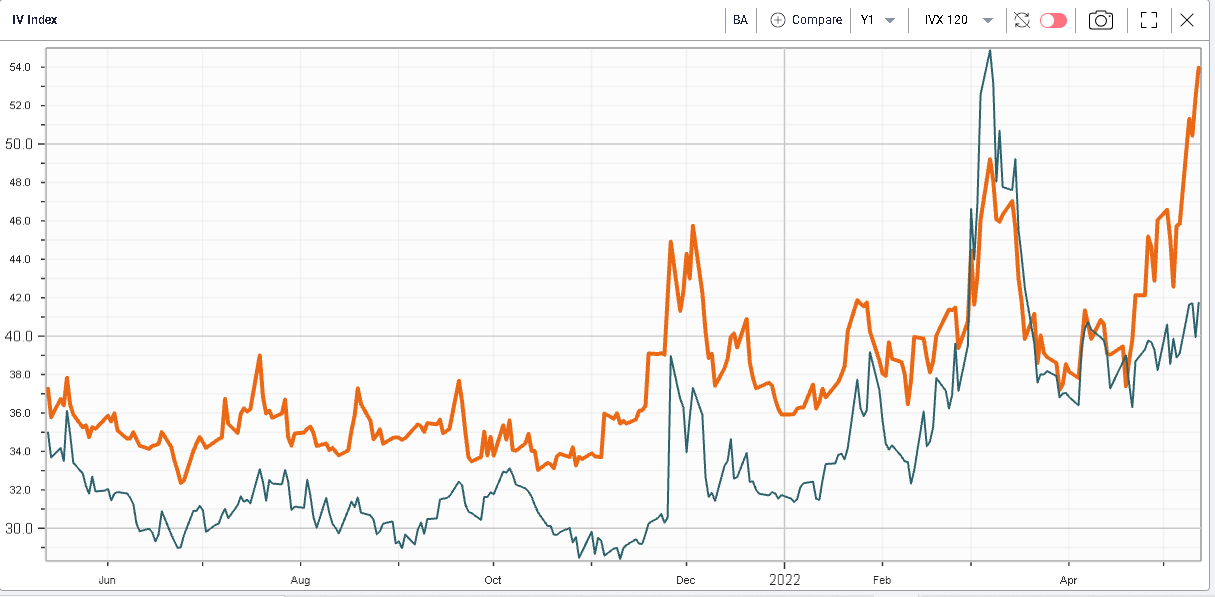
In fact, zooming in on the last 12 months shows the extent of the divergence with volatility remaining firmly under control for AIR while spiking higher in BA. |
|
This divergence impacts options prices significantly. For instance, the Mar’23 115 calls in AIR (around 110% strike) are offered at 10.34 while in BA, the Mar’23 $135 (around 110% as well) are offered at $20.8 |
In other words, a trader looking to play the spread in options for instance by buying BA calls and selling AIR calls would either need to spend 71% more premium for the BA calls compared to the AIR calls or would need to sell 1.71 calls in AIR for each BA calls that would be bought (ignoring FX effects and adjusting for the difference in spot prices). |
This may make traders more inclined to sell volatility in BA rather than buy it. Controlling the risks is key to success in options trading and finding the right structure is the first step that every trader will need to consider. |
Spreads are interesting strategies to consider especially for new traders because they help control the amount of risk taken and offer a simple approach when considering potential profits. |
Filtering spreads and finding the optimal combination from the options chain is an incredibly time-consuming task and this is the reason why we developed the RT Spread Scanner. |
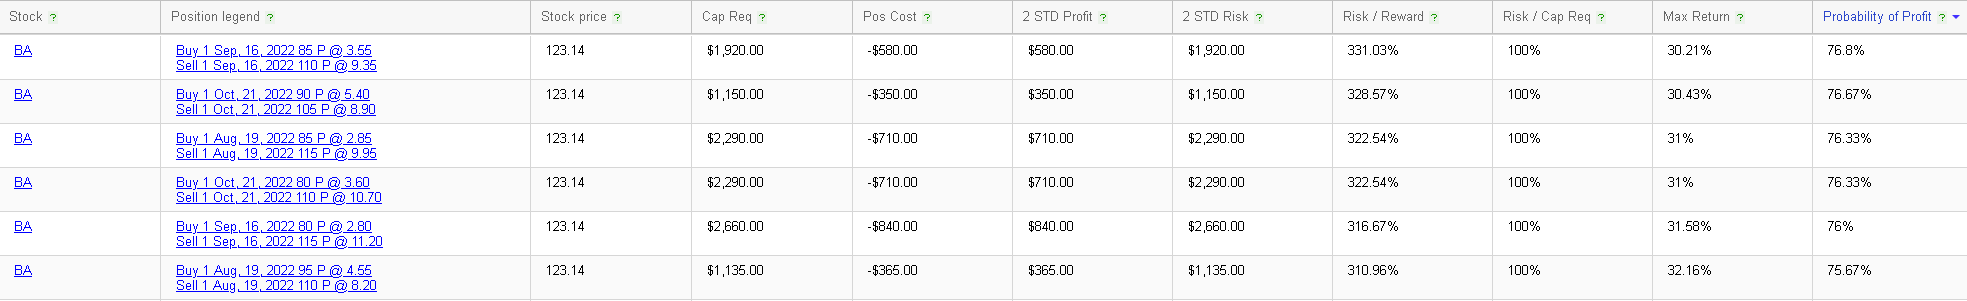
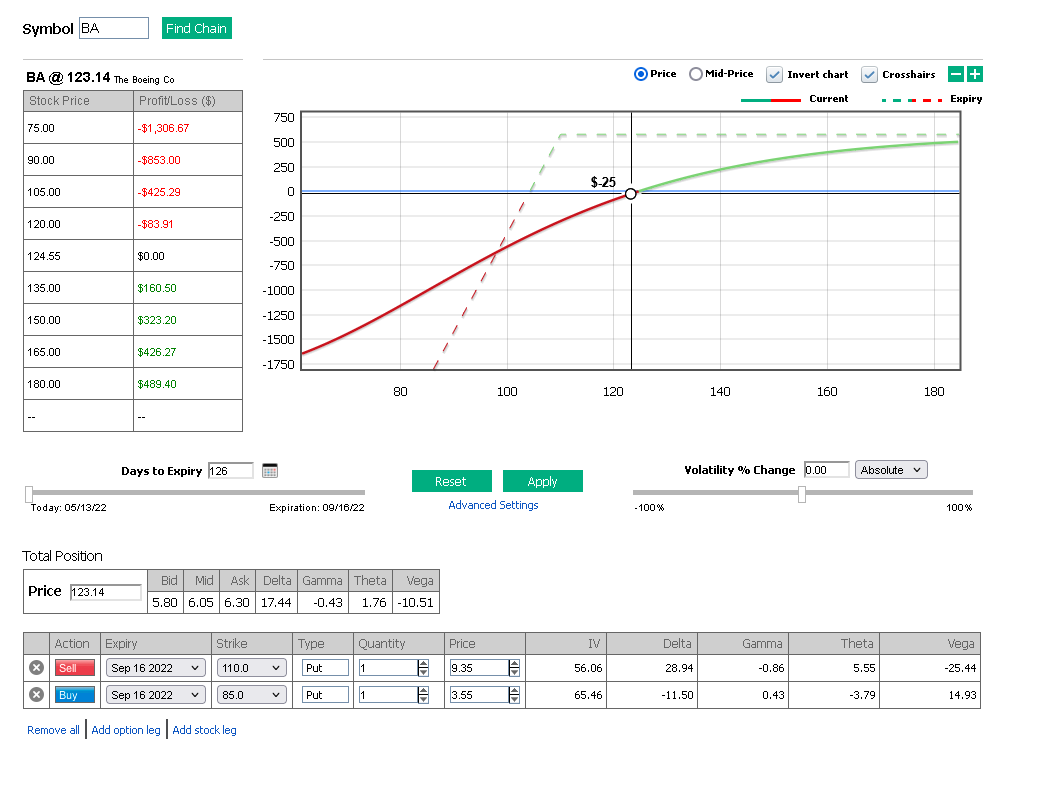
The system allows us to find the following bear vertical spreads in BA alongside their theoretical Probability of Profit. For instance, selling the September 110/85 bear vertical spread shows a theoretical probability of profit of almost 77%. |
|
The trader stands to make $580 for a potential loss of $1,920 should BA finish below 85 at expiration. |
Once a possible strategy has been identified, the trader needs to look further into his exposures. This is where the PnL Calculator steps in to help. |
The view below is an excerpt from this service, allowing the trader to rapidly evaluate his risks and to adjust his size accordingly. The system provides a visual representation of the profit and loss realized by the trader but also allows to run simulation by moving spot, time and volatility around. |
|
Disclaimer - This information is provided for general information and marketing purposes only. The content of the presentation does not constitute investment advice or a recommendation. IVolatility.com and its partners do not guarantee that this information is error free. The data shown in this presentation are not necessarily real time data. IVolatility.com and its partners will not be liable for any loss or damage, including without limitation, any loss of profit, which may arise directly or indirectly from the use or reliance on the information. When trading, you should consider whether you can afford to take the high risk of losing your money. You should not make decisions that are only based on the information provided in this video. Please be aware that information and research based on historical data or performance do not guarantee future performance or results. Past performance is not necessarily indicative of future results, and any person acting on this information does so entirely at their own risk. |