An interesting signal on US stocks |
A very green day to conclude the week with the NDX leading the pack and closing 3.7% higher on the day. The SPX was up 2.4% and the DJIA up 1.47%. Over the week stocks still finished in the red but bounced from their intra-week lows. The NDX settled 0.6% lower, the DJIA -1.5% and the SPX -1.4%. |
Europe and Asia were also strong with the German DAX finishing +2.1%, the French CAC +2.52%, the Japanese Nikkei +2.64% and the Chinese HSCEI +3.2%. Over the week, Europe outperformed with the DAX up almost 3% over the past 5 days and the CAC up 2.5%. |
Last week, implied volatilities were largely unchanged with 30d IVX finishing at the same level as a week ago. For the NDX 30d IVX gained 0.8 points and for the DJIA 30d IVX lost 1.7 points. |
Looking at the DJIA components, the dispersion in the overall performance remained elevated with BA finishing the week around 15% lower. AAPL was the second worst performing stock in the DJIA finishing around 7% lower on the week. AXP, CAT and MSFT all finished around 5% lower on the week. |
On the upside, defensives continued to do well with AMGN up 2.5% on the week and more than 7% on the year. MRK finished up more than 2% on the week and is now up almost 18% on the year. |
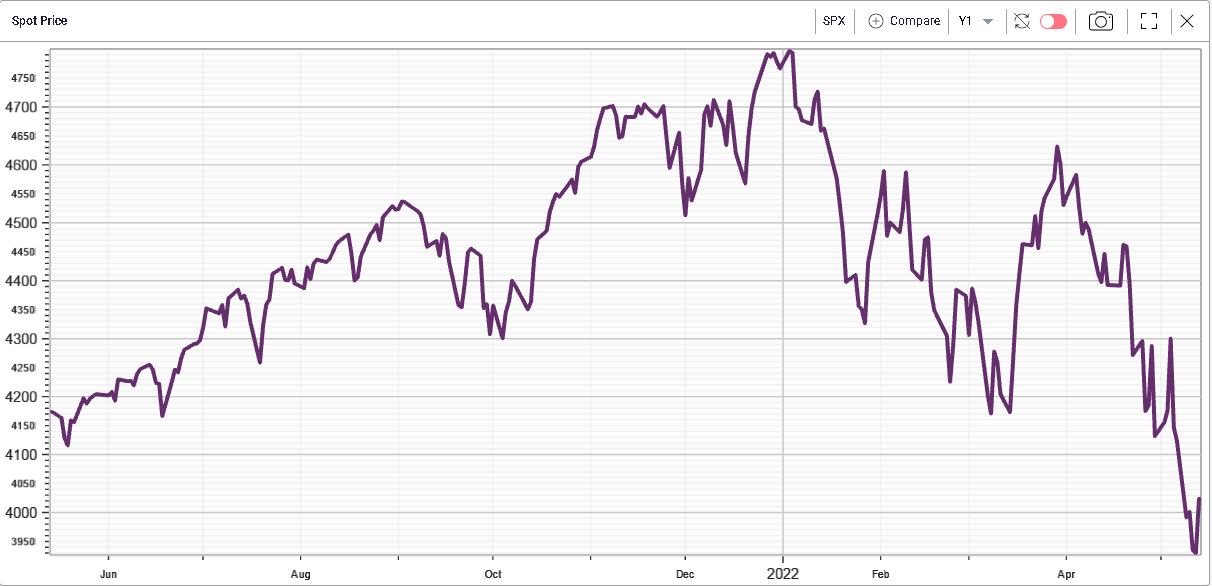
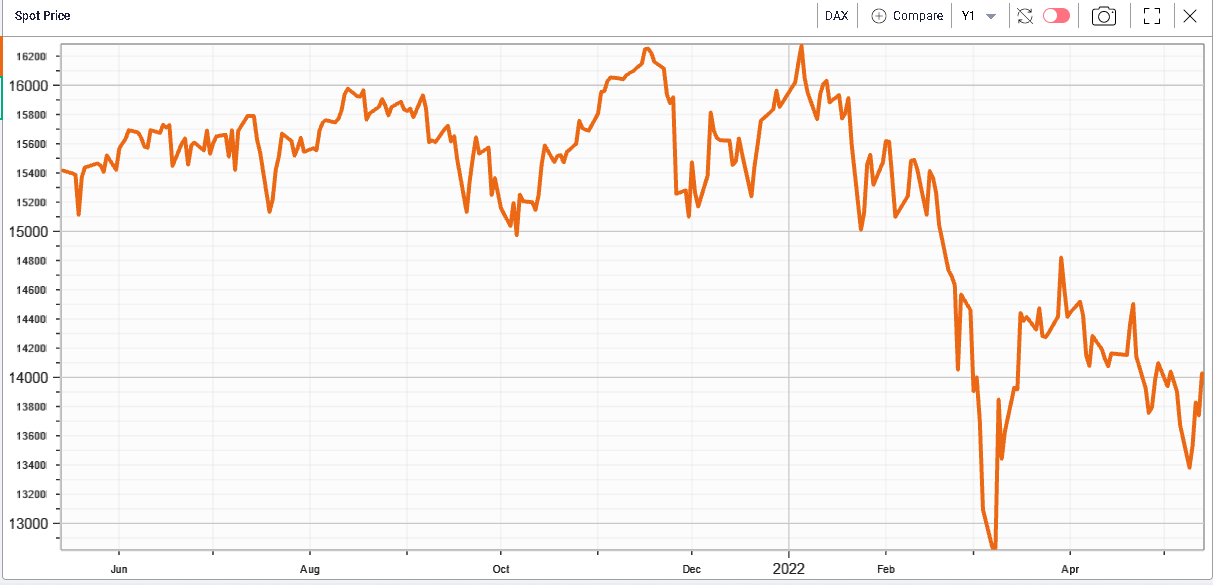
Interestingly European equities which had initially underperformed on the back of the war between Russia and Ukraine are now outperforming their US counterparts with the German DAX around 12.5% lower for the year and the SPX around 16% lower. |
The charts below show the performance over the last 12 months of both indices. |
|
|
This shows how much the market’s attention is currently directed towards the FED and that at least for now, traders seem to view the situation in Europe and in the US as very different from an inflation’s perspective. |
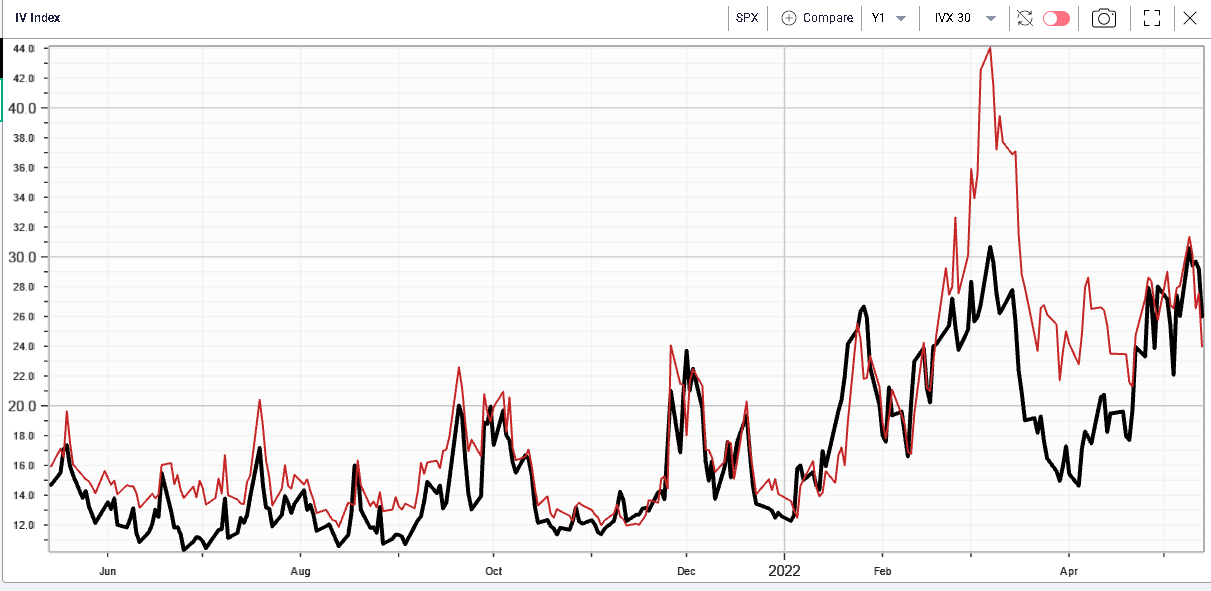
The chart below shows the volatility in black of the SPX measured by the 30d IVX alongside the DAX in red. |
|
Both measures have been fairly close over the past 12 months and the impact of the geopolitical tensions is quite visible on the chart. It is also interesting to see how implied volatility for the SPX has caught up with that of the DAX over the past month. |
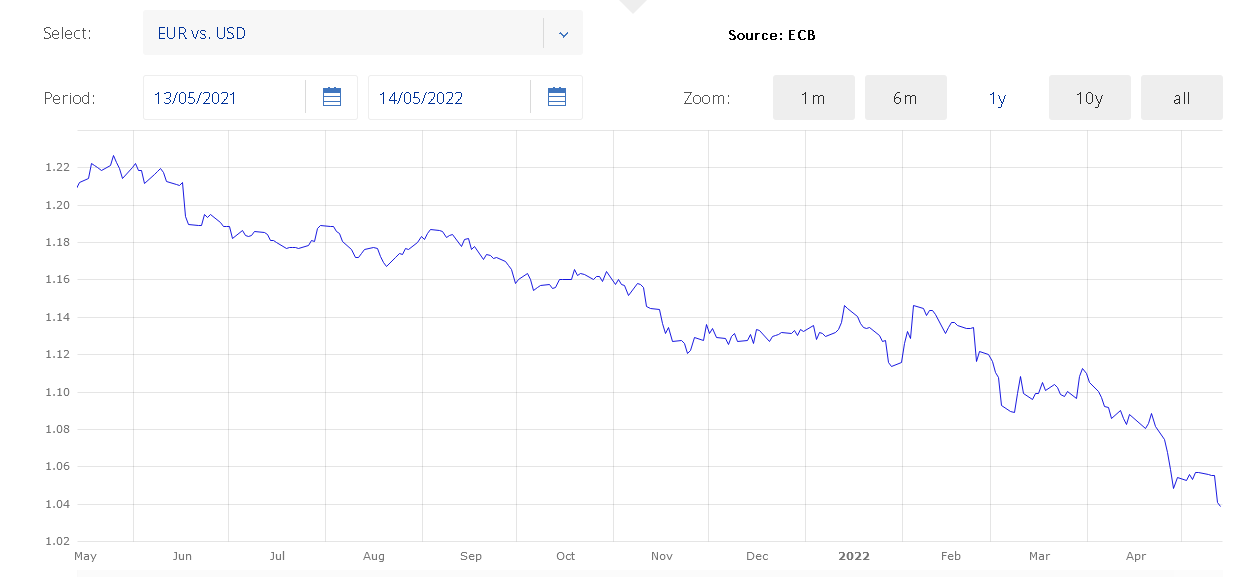
This divergence in the perception by market participants of the future of monetary policy in Europe and in the US is also visible in the EUR/USD exchange rate shown below. |
|
In fact, in 2022 the euro has lost more than 8% to the dollar and now has FX traders looking at parity as a real possibility in 2022. This shows that despite inflation in Europe running very high, the ECB is perceived as more likely to ere on the side of caution after years of extremely low inflation in the zone (and even deflation). It is also important to remember that consciously or not, the ECB has de facto added an unofficial objective to its mandate of maintaining price stability. This new objective is almost a political one and is to try and control spreads and borrowing rates within the zone. |
One of the key risks for European governments as interest rates start to move higher again is to see borrowing rates for the weaker countries start to increase as investors worry that the debt load may not be sustainable. During the sovereign crisis in the early 2010s, the ECB took steps to ensure that borrowing rates remained under control and this has remained an important measure for them. |
Considering the amount of debt that has been added during the COVID pandemic, it will be interesting to see whether this worry makes a comeback over the next few months or if the ECB will manage to keep it under control. |
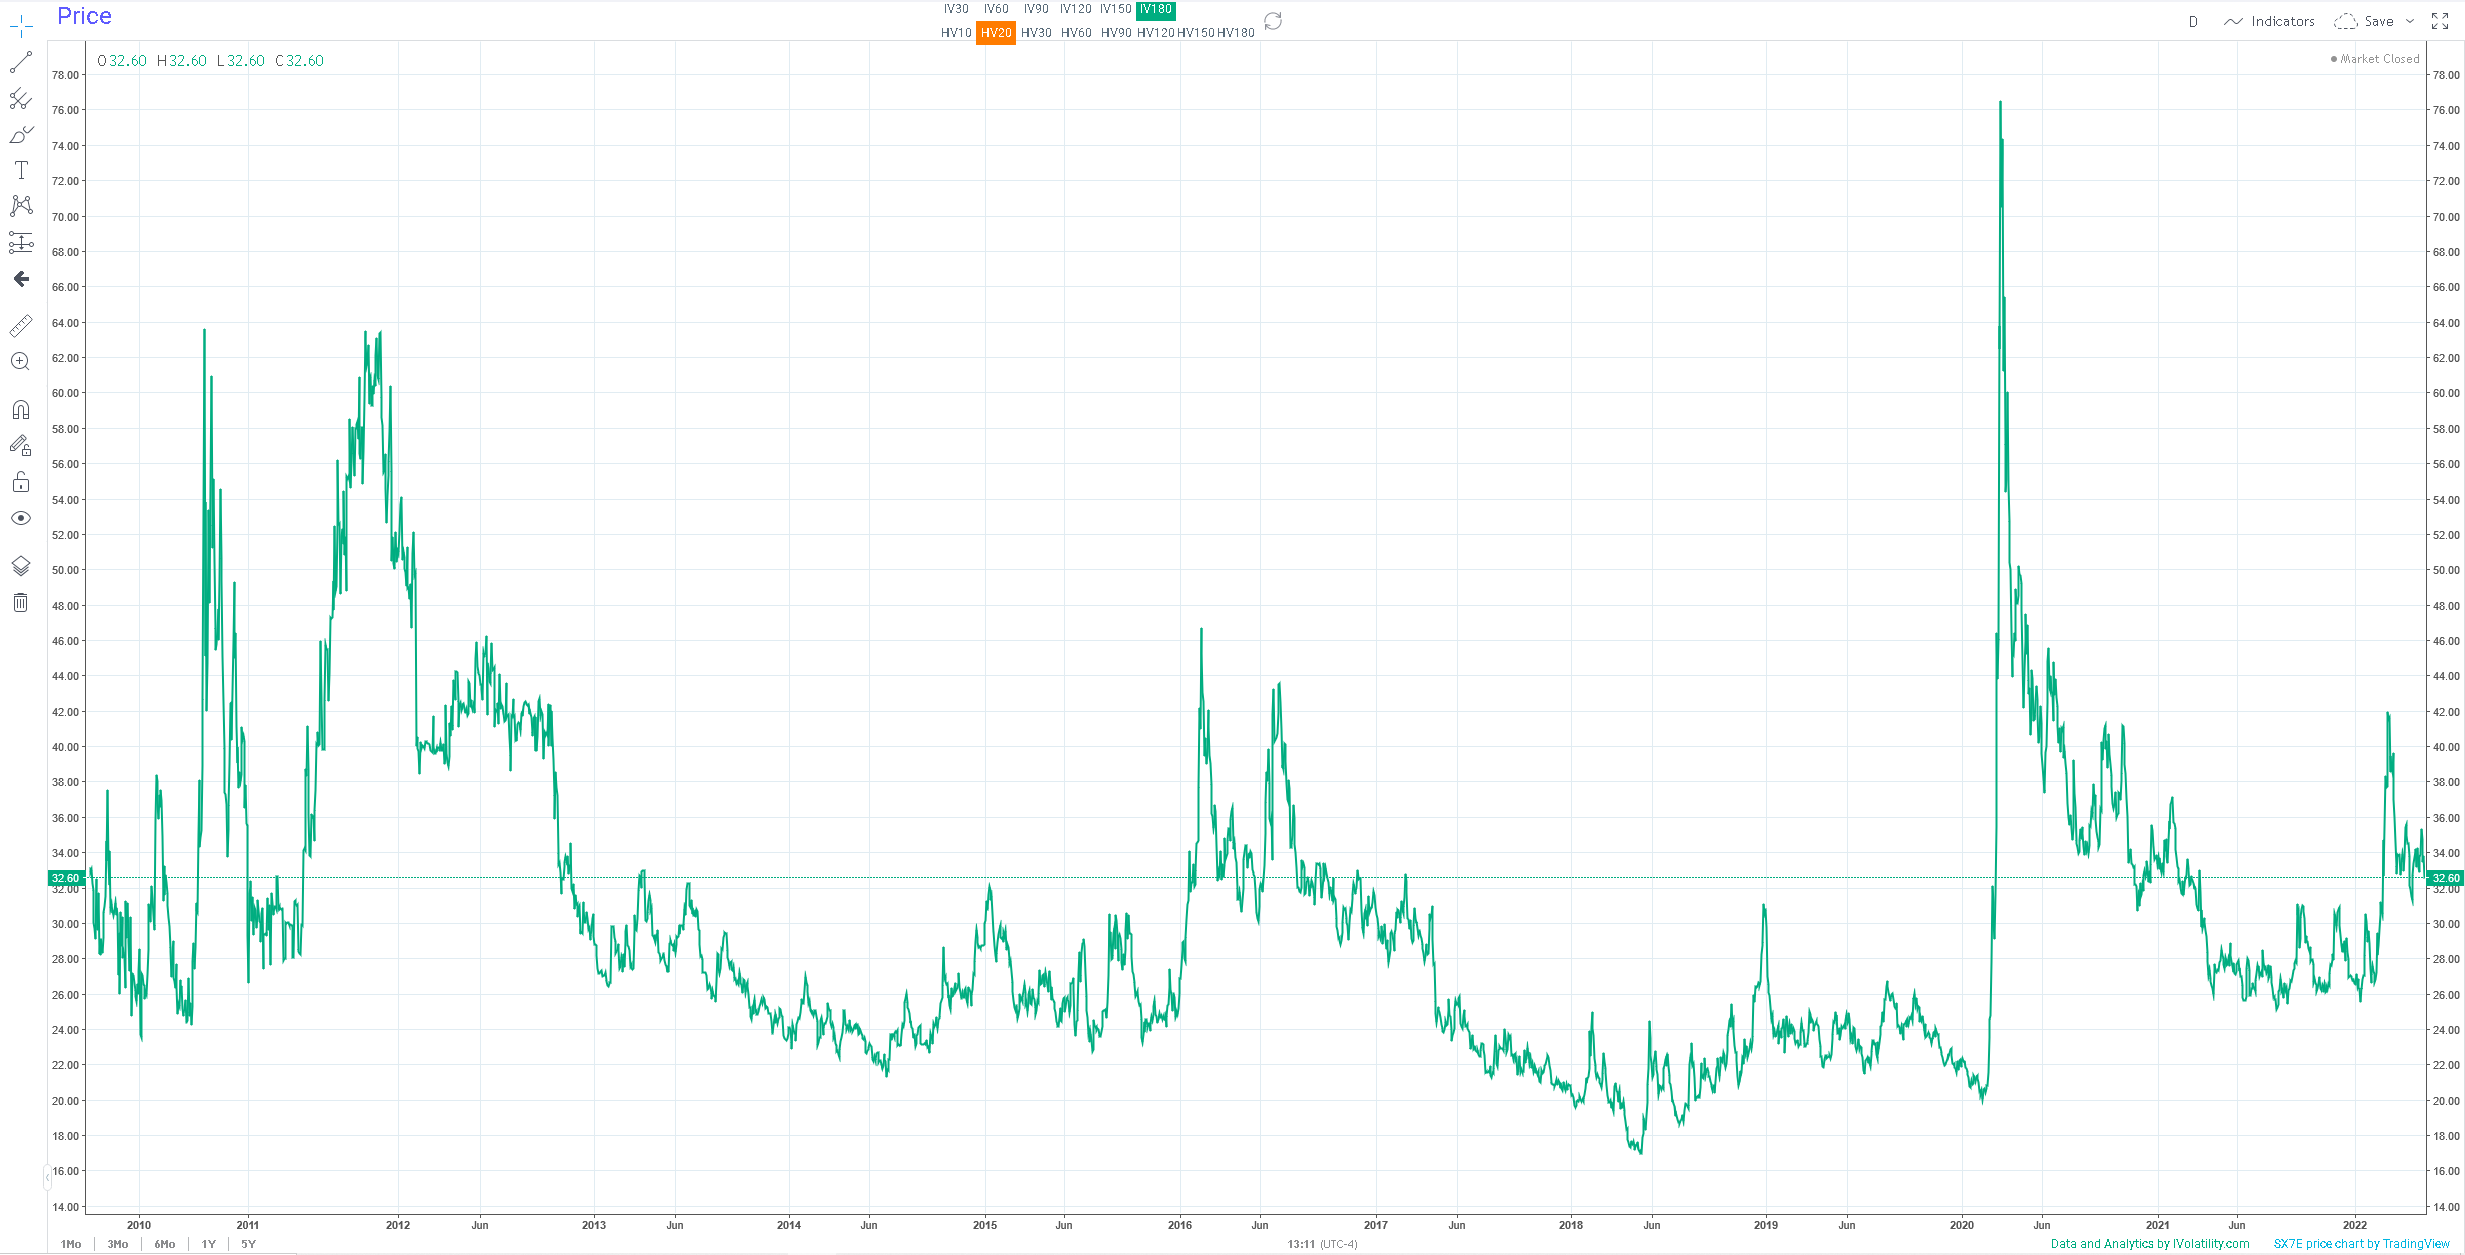
This risk is not really being considered in the market at the moment as shown on the 5-year chart of the 360d IVX in the SX7E (Eurozone Banks sector). |
|
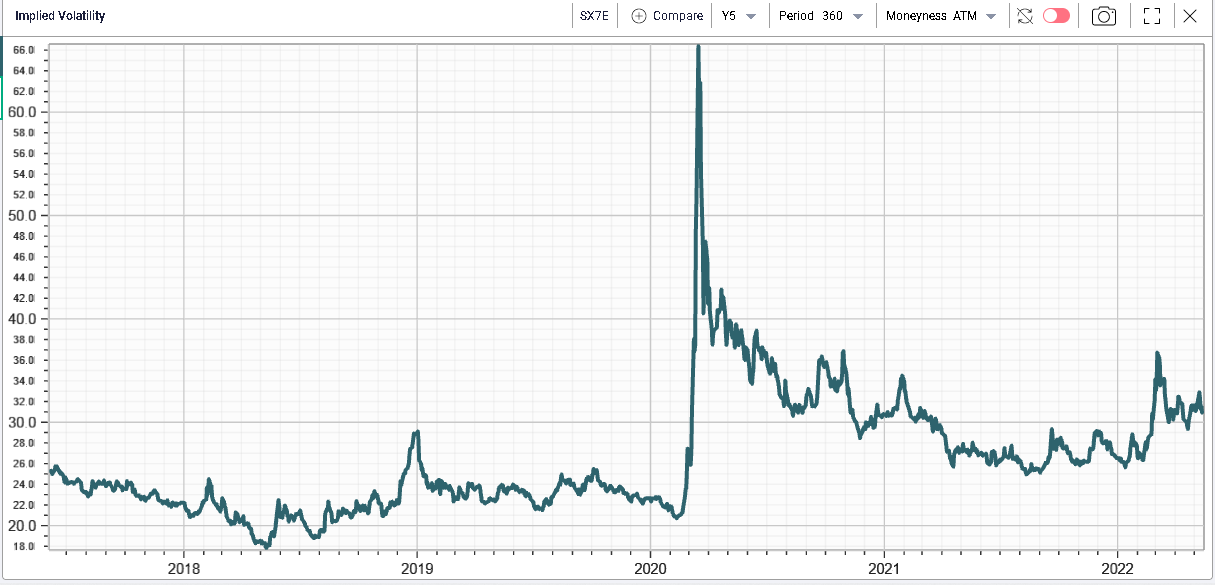
The volatility is elevated historically but is nowhere near extreme levels that had been seen historically as shown on the long-term chart of the 180d IVX below. |
|
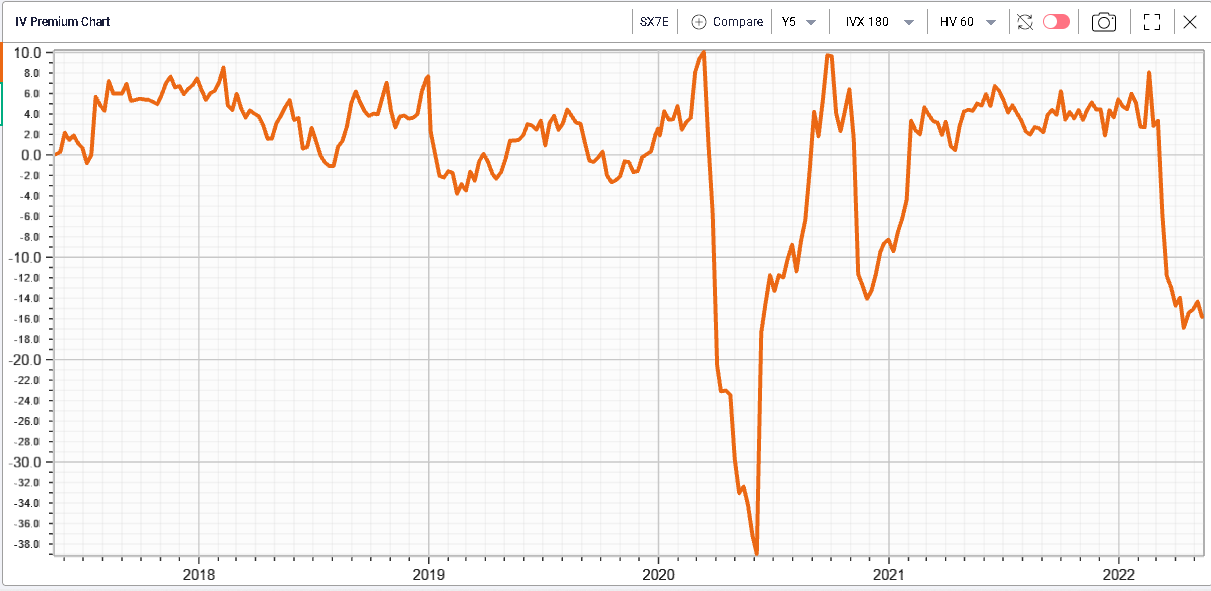
Finally, this increase in implied volatility is first and foremost driven by an increase in realized volatility over the past few weeks as shown on the below IV Premium chart showing the 180 IVX compared with 60 realized volatilities. The spread is trading at its lowest level since the COVID crisis, a sign that the market is expecting current realized volatilities to drop over the next few months. |
|
Looking back at the last week in the US, an interesting theme started to emerge where some of the companies that performed the worst in 2022 seemed to have found a bottom. |
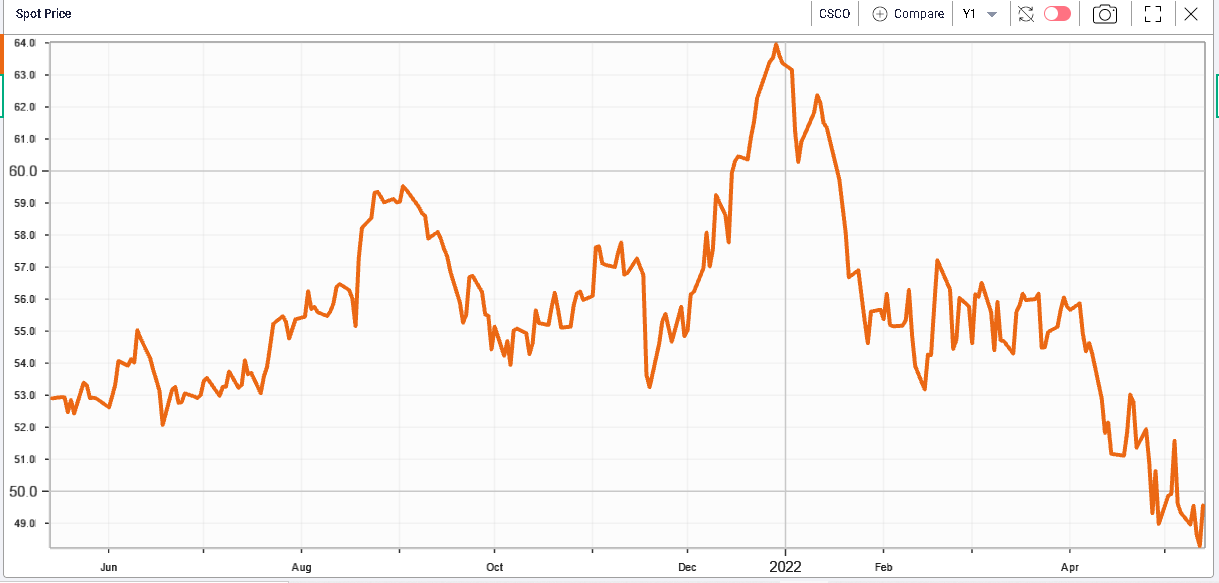
Names like NKE and CRM managed to limit their losses while others like HD and CSCO actually finished up on the week. |
We show below the 12 months spot price in CSCO which has so far managed to hold over the week and finish up slightly less than a percent. |
|
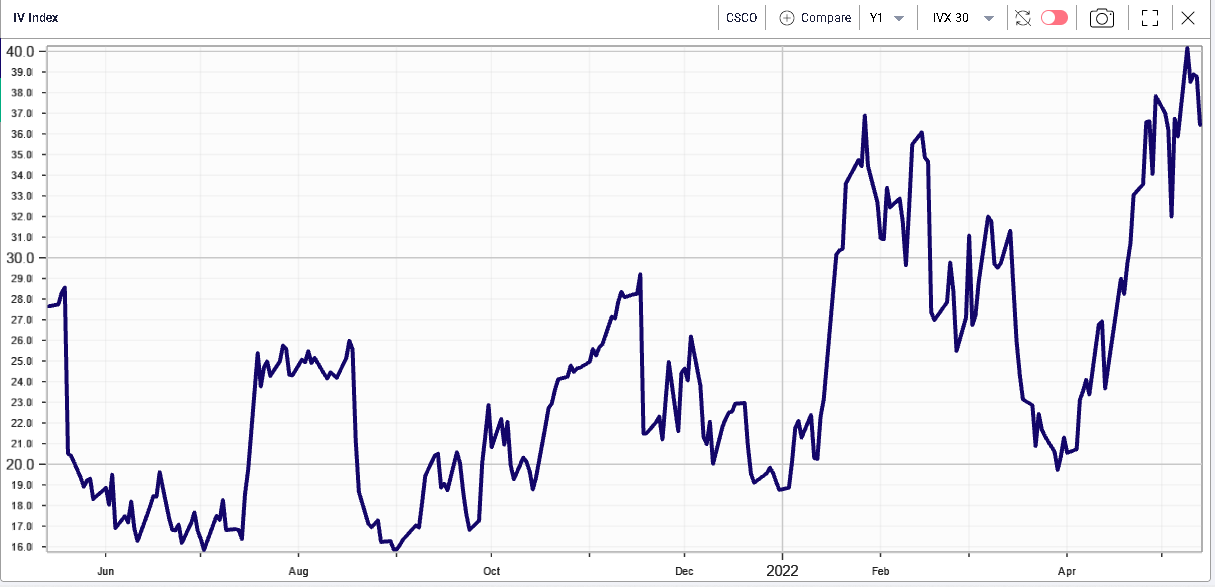
Looking at implied volatility to try and understand what options traders are telling us is an important step. Below we show the 30d IVX over the past 12 months. |
|
We can see that for now implied volatility has hardly dropped. It is important to keep in mind that CSCO will be reporting earnings next week and that single phenomenon may make options market maker less inclined to offer volatility lower. |
This type of price action combined with a well identified risk event is interesting for traders who know the company and are willing to take risks in the name. |
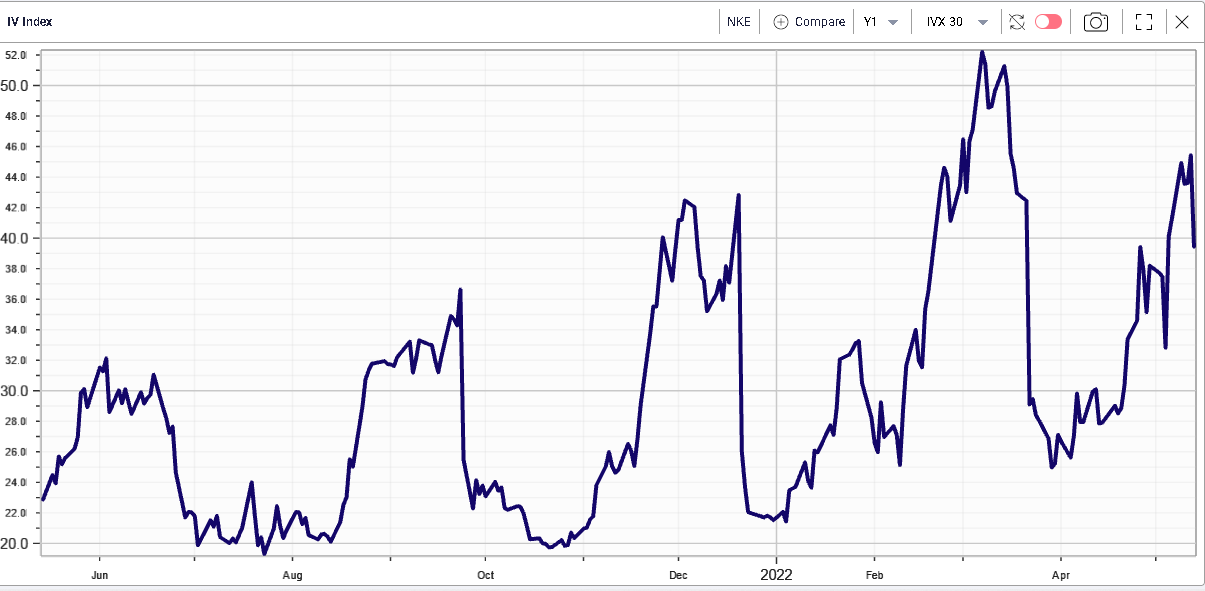
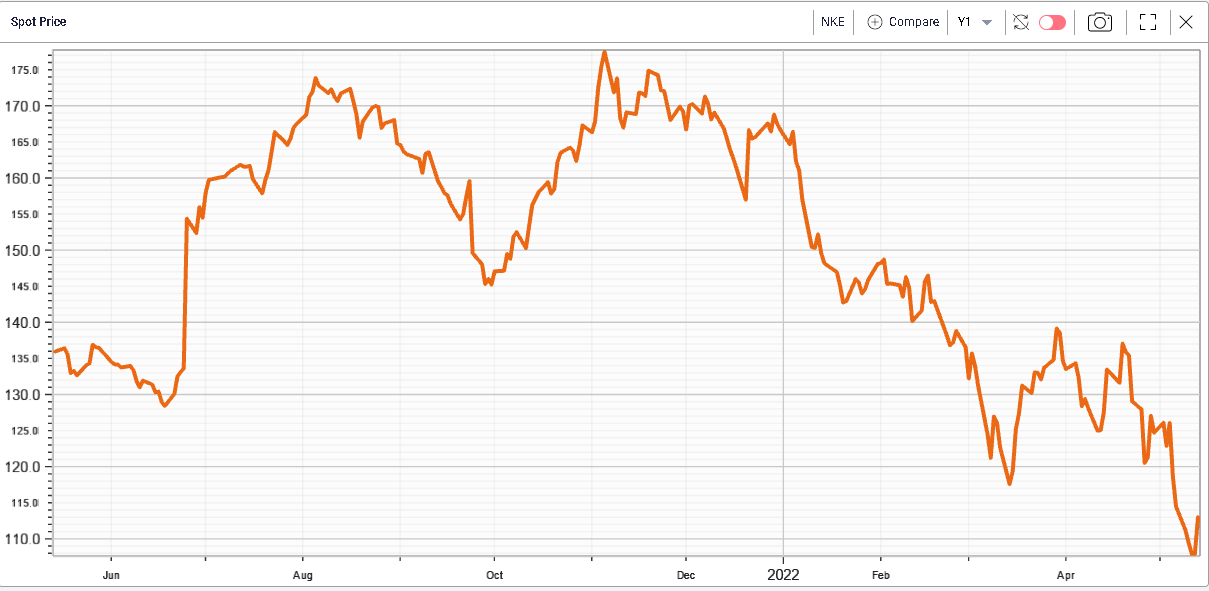
Other stocks may be sending different signals, for instance in NKE we can spot the divergence between implied volatility and spot prices and here again traders with an interest in the name may want to keep watching it to see how things evolve and react in the next few days. |
|
|
Disclaimer - This information is provided for general information and marketing purposes only. The content of the presentation does not constitute investment advice or a recommendation. IVolatility.com and its partners do not guarantee that this information is error free. The data shown in this presentation are not necessarily real time data. IVolatility.com and its partners will not be liable for any loss or damage, including without limitation, any loss of profit, which may arise directly or indirectly from the use or reliance on the information. When trading, you should consider whether you can afford to take the high risk of losing your money. You should not make decisions that are only based on the information provided in this video. Please be aware that information and research based on historical data or performance do not guarantee future performance or results. Past performance is not necessarily indicative of future results, and any person acting on this information does so entirely at their own risk. |