Are options traders complacent? |
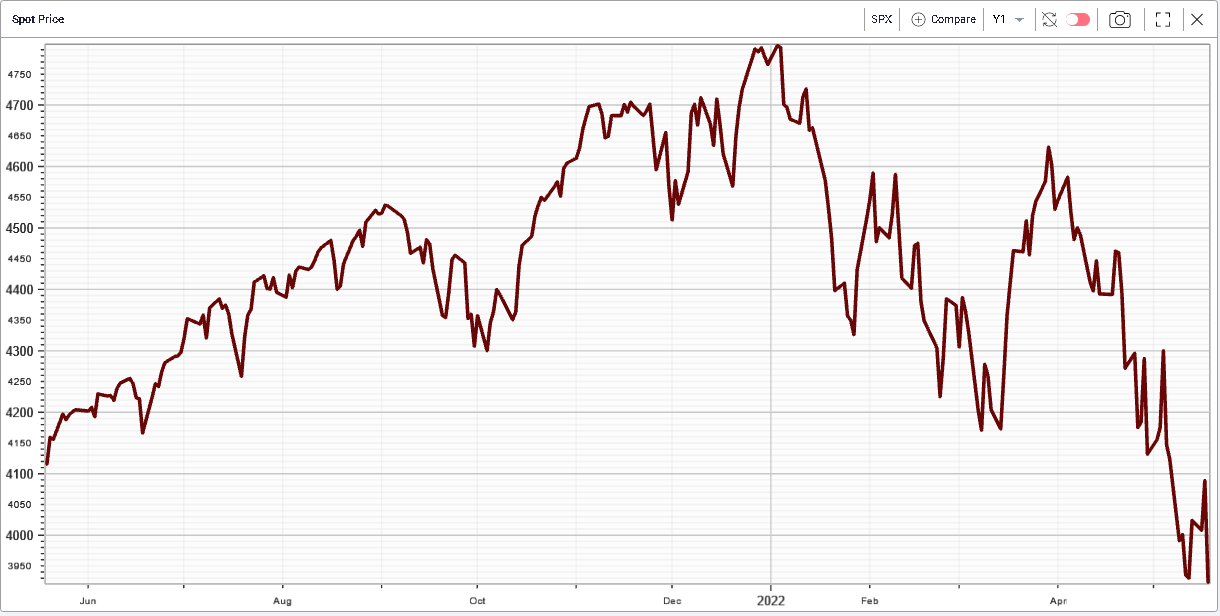
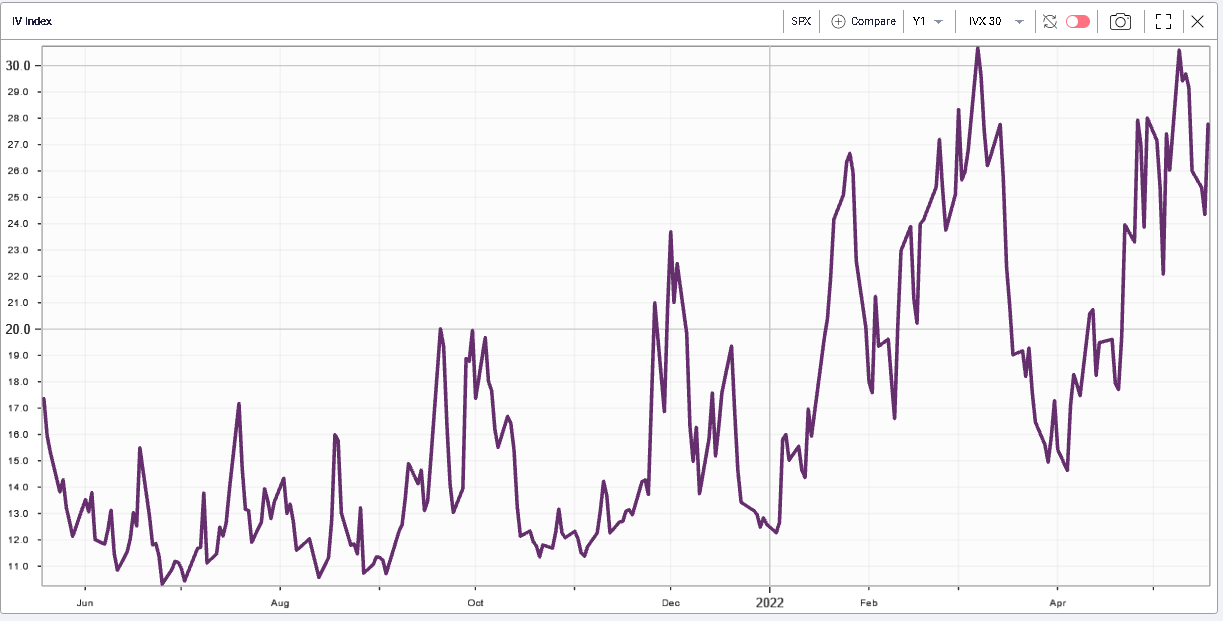
The liquidation resumed yesterday and NDX finished 5% lower, SPX 4% and the DJIA around 3.6%. Despite this aggressive move lower, implied volatilities continue to lag as shown on the 12 months chart below of both spot and 30d IVX. |
|
|
We can see that at the close yesterday the 30d IVX was still around 2 points below its previous highs reached when spot was around the same spot level on the 12th May’22. |
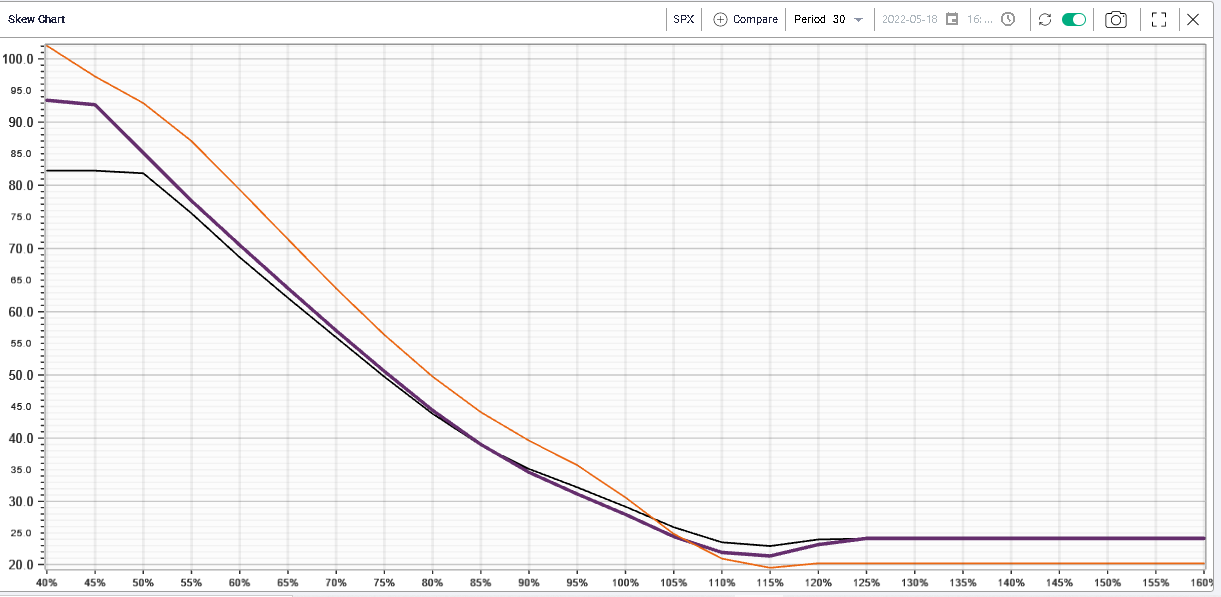
Looking at the below skew chart on 30d SPX on three different dates, we can see how volatilities by strikes have evolved over the past few weeks. |
|
In orange, the curve is snapped as of the 7th Mar’22 at the peak of the Ukraine/Russia crisis. In black we have the curve as of the 12th May’22 which corresponds to the last time the market traded the current spot level. In purple we show the current curve as of yesterday’s close. |
Looking at the 100% strike, we can see that 30d at the money volatility was fairly close on all three instances. Looking at the 80% puts now, we can see that the orange curve stands out. This is probably driven by the fact that the market was caught by surprise and market makers became very reluctant to sell options as they feared a wall of hedging might hit the market pushing implied volatility higher for puts. |
The current situation is quite different with market makers happy to offer options around 5 points lower for the 80% than where they were back in March 2022. |
On the upside the situation is slightly messier. Back in March, options traders were happy to sell calls with the 30d implied volatility for the 115% strike around 20, more than half of the volatility of the 85% put. Looking at the current situation, over the past few days, it seems that options traders have become more comfortable again offering upside options in the SPX. |
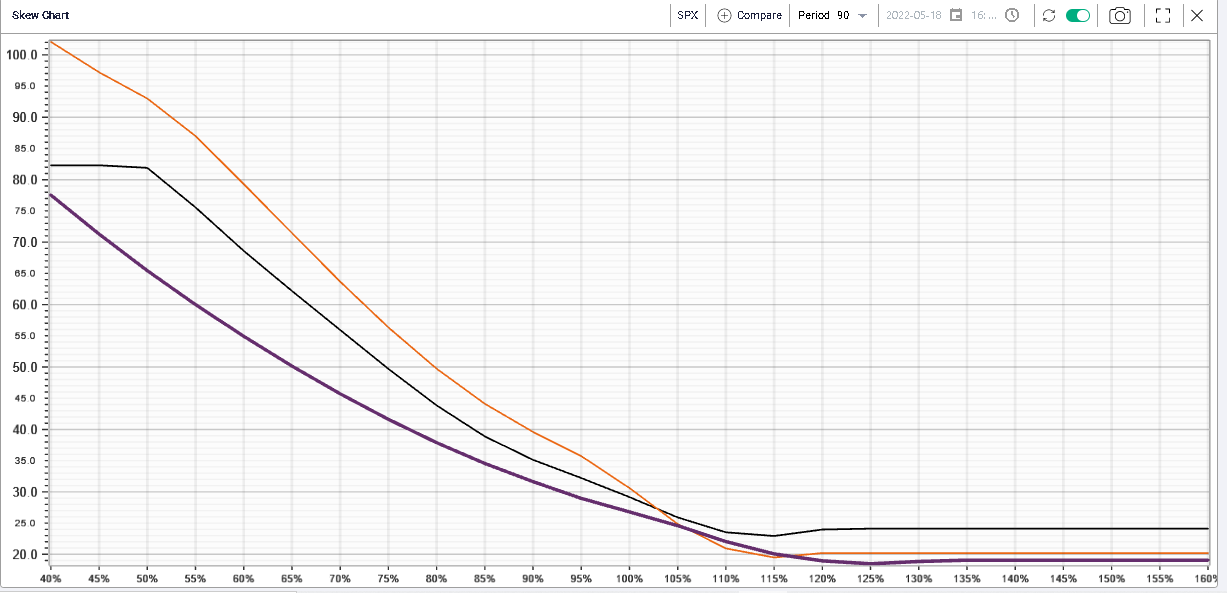
In terms of options activity, the call side has increased steadily as the spot has been trending lower as shown on the below chart displaying in bold the options outstanding open interestLooking further out at 90 days volatility, we get an even cleaner picture. We find that the 80% puts seem to be getting cheaper. For upside calls, they also got a lot cheaper over the past few days as shown below. |
|
This phenomenon is almost as important as the fact that implied volatility in the SPX is underperforming realized in the current market environment. |
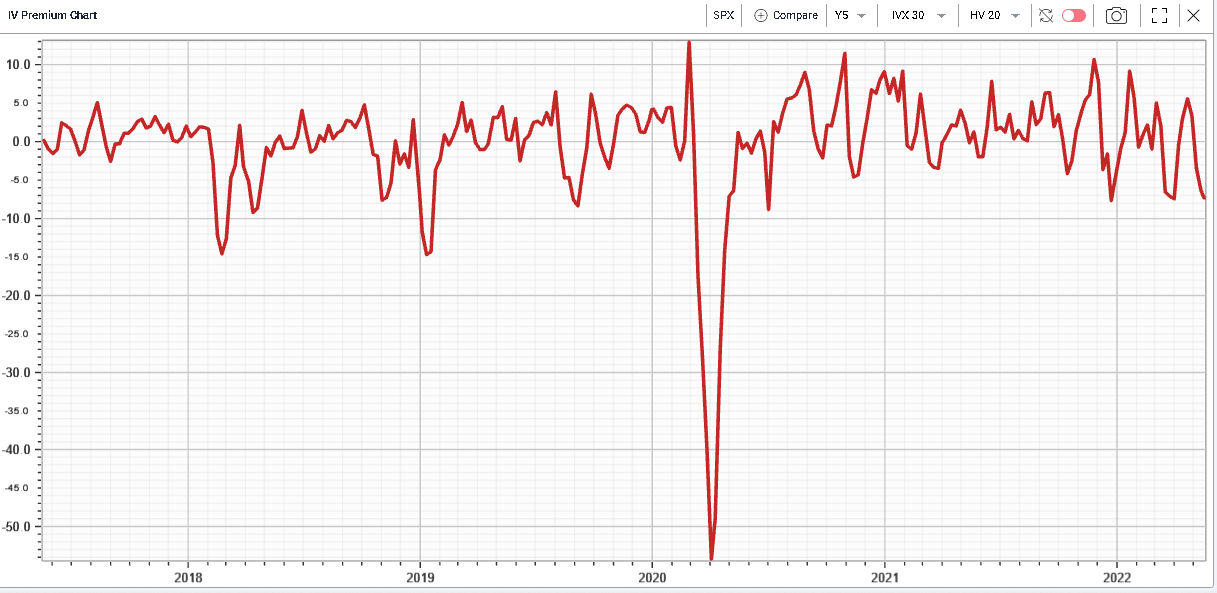
Below we show the 30d/20d IV Premium chart and can see that implied volatility when compared with current level of realized volatility has reached very low levels over the past 5 years. |
|
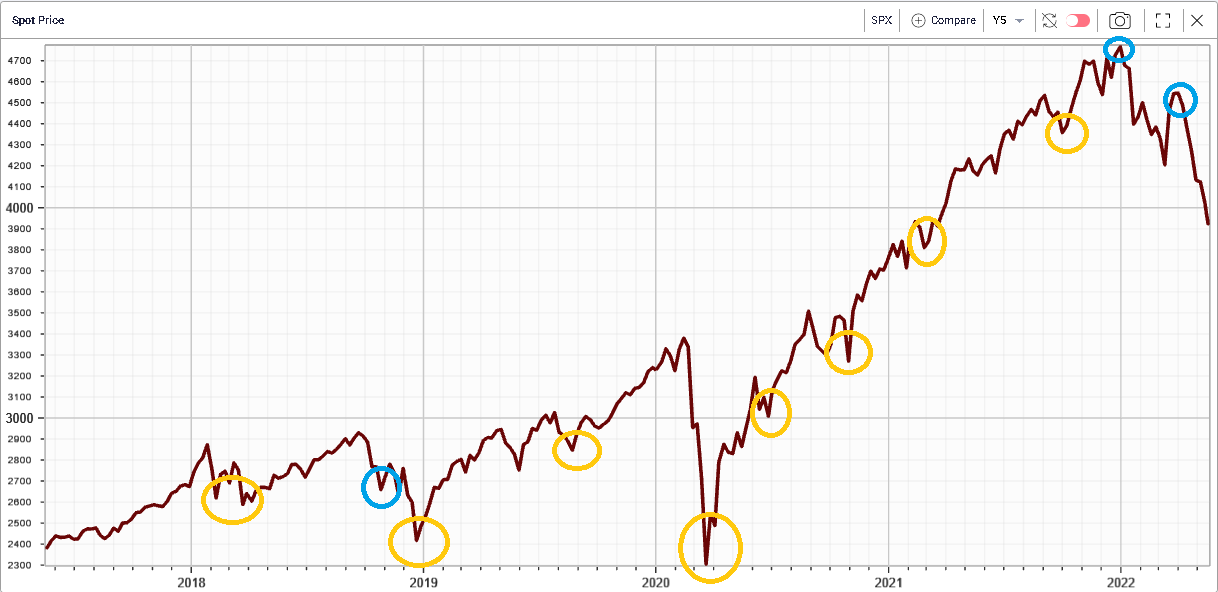
That signal has historically been associated with turning points in the market after a selloff had occurred. Below we try to highlight spot levels over the past 5 years when levels around or lower levels on IV Premium were reached. |
|
In yellow we flag the levels that happened around a local low while in blue those that gave an incorrect signal. In most instances, that signal allowed traders to buy the dip slightly after the bottom had been made except for one time in 2018. |
So far this year though, this approach has failed to produce any qualitative signal and would even have led investors to buy the market twice pretty much at the local highs. |
A tentative explanation would be to think that people are simply hedged already. After all, a lot of traders and investors had been warning about the extreme levels reached by valuations and the number of outstanding risks in the market. If people were acutely aware of those risks, then it is possible that they would have hedged themselves and would not have had to meaningfully shift their portfolio as equities started to slide. |
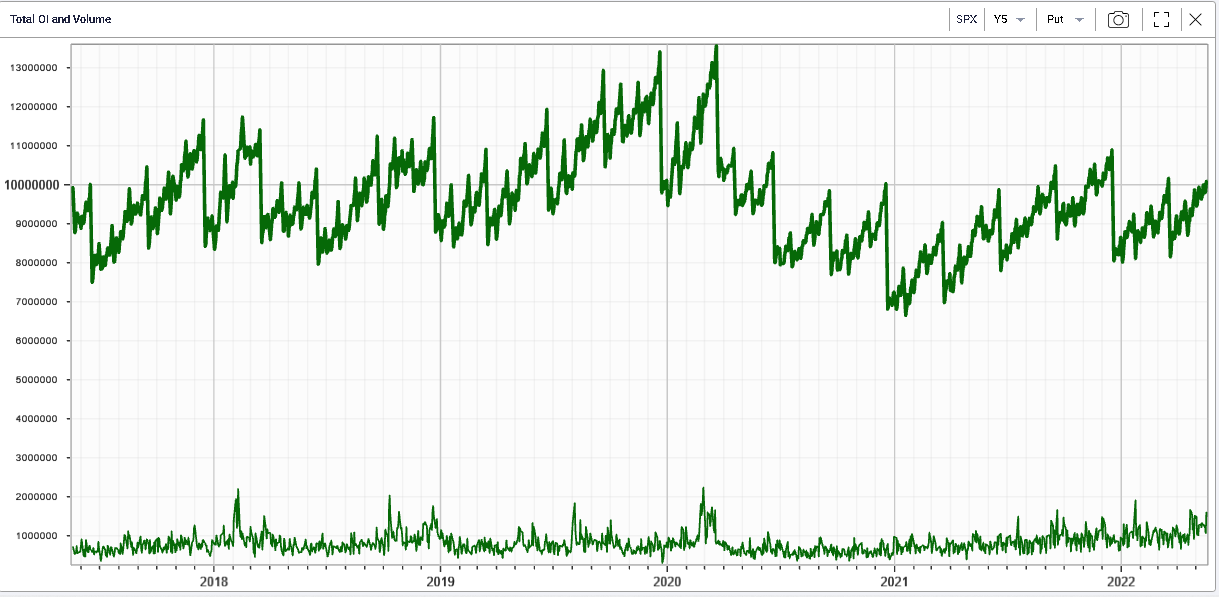
Looking at put volumes on the SPX over the past 5 years, it is difficult to argue that those have been particularly elevated so far this year. The outstanding open interest (top line) has increased in 2022 but not in a way that would lead us to think that a large amount of buying has taken place in the market. |
|
If traders / investors did not buy puts to protect themselves then it is possible that they simply reduced the size of their positions. This could easily have happened either on the initial selloff induced by geopolitics in Q1 or during the bounce during the second part of the month of March. |
Investor sentiment surveys have shown that the amount of bearish traders and investors has increased over the year so that would tend to give some credit to the idea that positions have been reduced as the market activity and volatility picked up. |
It is also entirely possible that options traders are complacent and happy to sell puts with implied volatilities that may look low historically simply because holding puts has not paid off particularly well so far in 2022. |
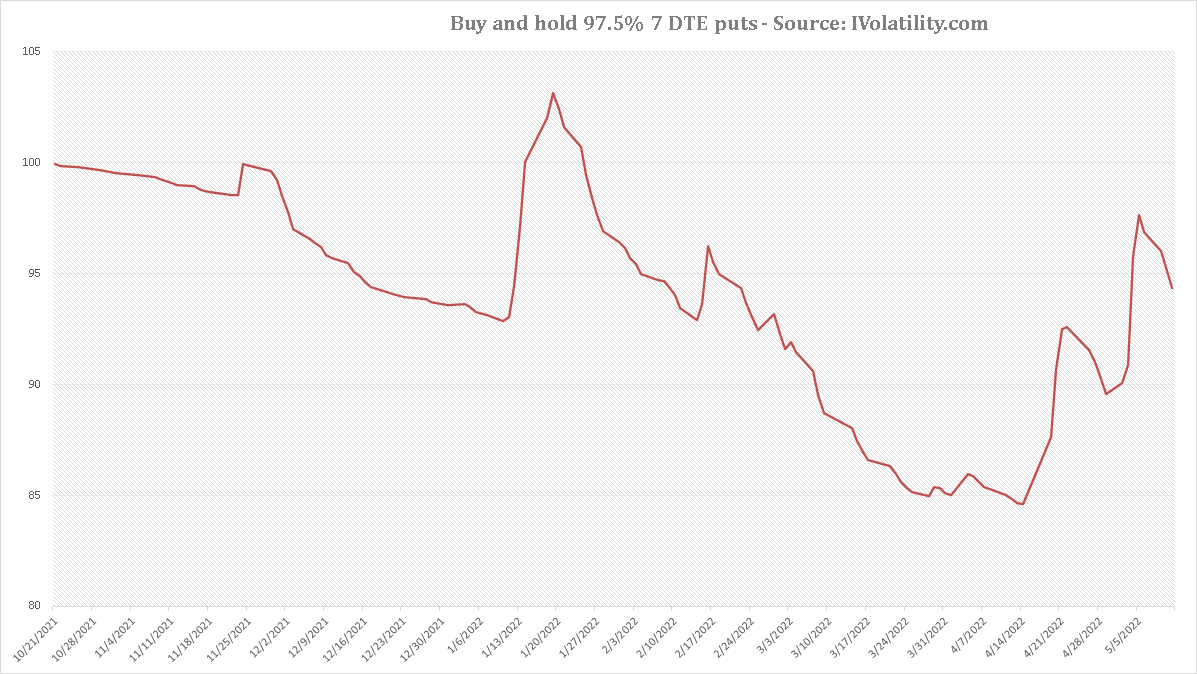
Below we show the performance of a strategy that would have bought each trading day a 97.5% 7 DTE put and held until expiration. Despite a 18.2% move down on the year, the strategy would still have lost money in 2022. |
|
Disclaimer - This information is provided for general information and marketing purposes only. The content of the presentation does not constitute investment advice or a recommendation. IVolatility.com and its partners do not guarantee that this information is error free. The data shown in this presentation are not necessarily real time data. IVolatility.com and its partners will not be liable for any loss or damage, including without limitation, any loss of profit, which may arise directly or indirectly from the use or reliance on the information. When trading, you should consider whether you can afford to take the high risk of losing your money. You should not make decisions that are only based on the information provided in this video. Please be aware that information and research based on historical data or performance do not guarantee future performance or results. Past performance is not necessarily indicative of future results, and any person acting on this information does so entirely at their own risk. |