How likely is the TWTR deal? |
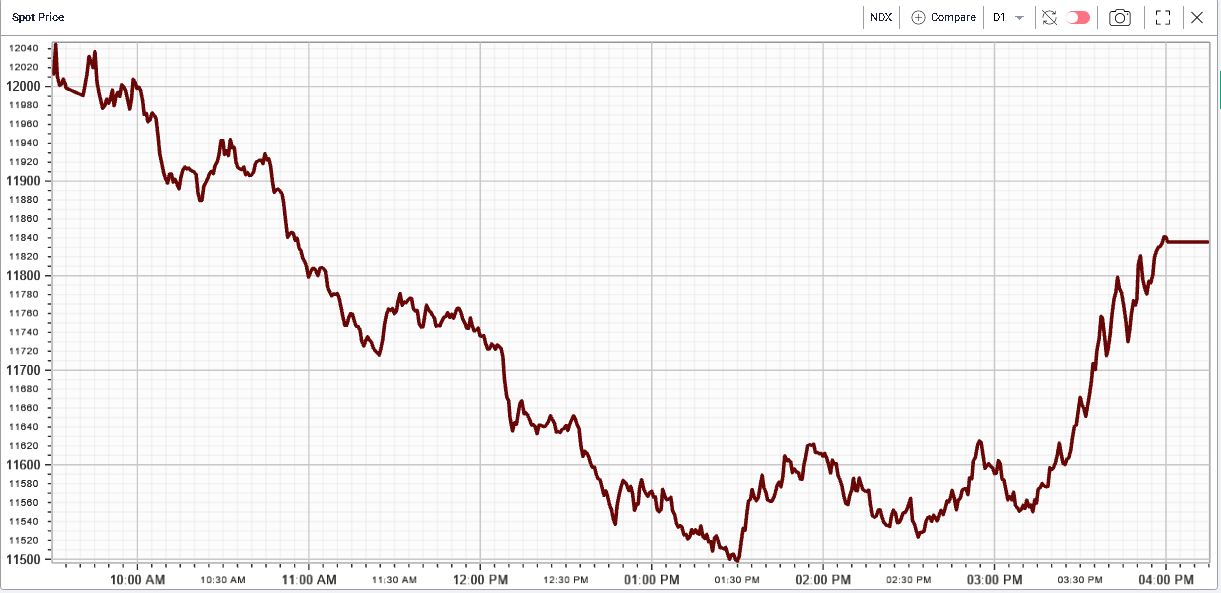
Thanks to a late turnaround in equities, the SPX and the DJIA finished unchanged on the day and the NDX lost only 0.35%. |
At one point the NDX was losing more than 3% but after the lunch break, buying picked up and managed to push indices back towards the equilibrium. |
|
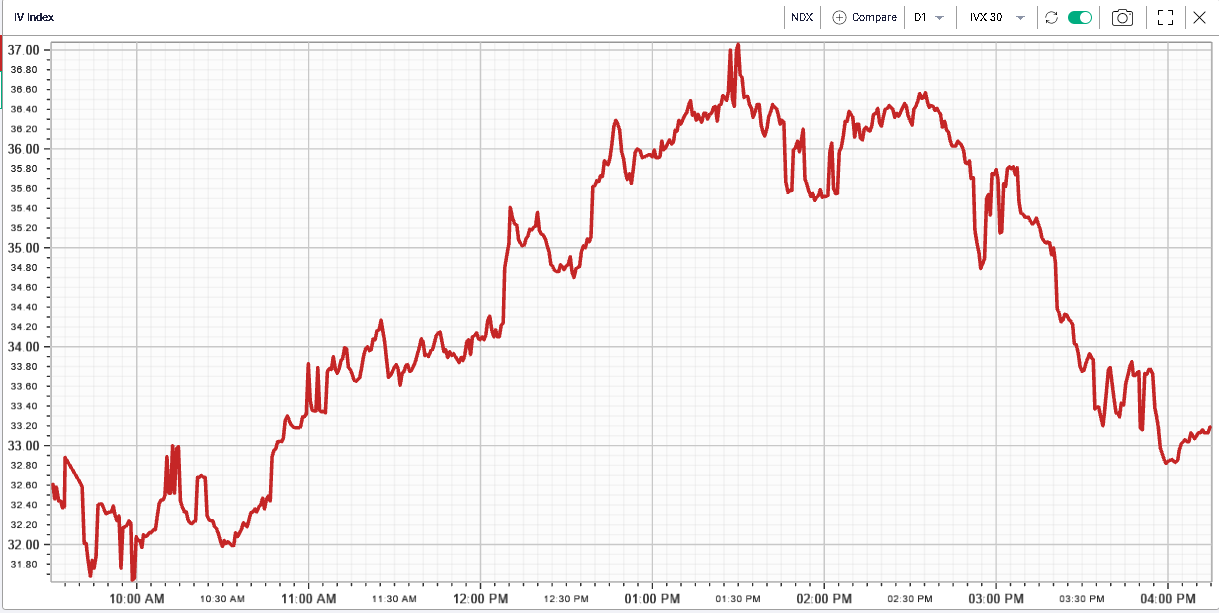
Implied volatility performed in line with spot as shown on the below chart. |
|
In terms of sectors, Consumer Discretionary stocks dropped almost 5% at one point on Friday before turning around to finish 2% lower on the day. Most of the underperformance of the sector was attributable to TSLA which finished 6.4% lower. In contrast, AMZN which is the largest component of the sector managed to finish in positive territory. Over the last month, TSLA has lost more than 34%. On the upside, the healthcare sector was once again the best performing space on the day gaining 1.2%. |
At the single stock level, we also saw BA break lower and finish around 5% down on the day. The stock bounced alongside the market and managed to close above $120 but it spent more than half of the day below that mark and finished 42% lower on the year. |
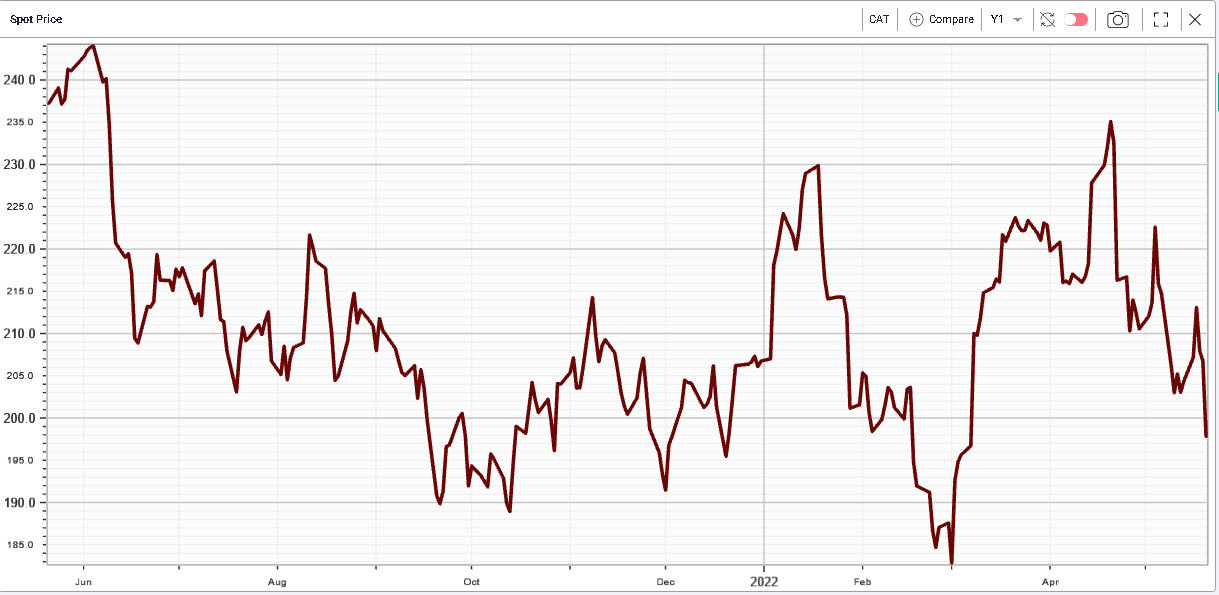
CAT saw a fairly negative day on Friday with a close lower of 4.3%. This stock has been fairly defensive in 2022 as the name was pretty much flat on the year up until Friday. |
|
On the upside, CSCO was the best performing stock of the DJIA closing almost 3% higher. The stock is still 13.5% lower over the past week. |
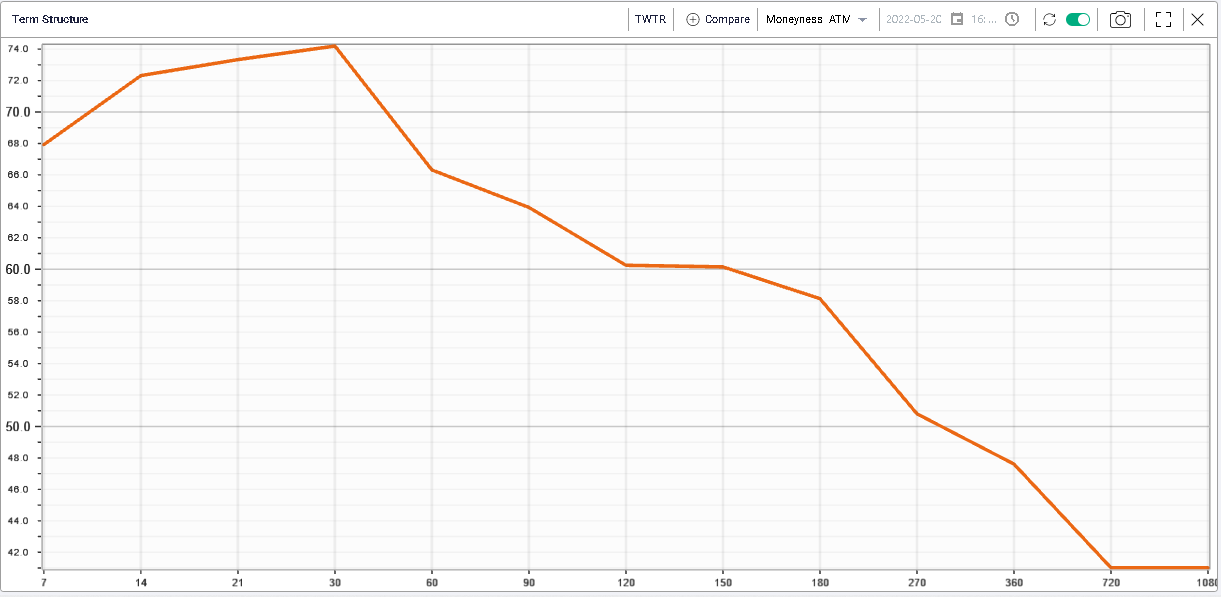
Looking at the term structure of volatility we can identify stocks where the market is most worried about a possible move happening in the short term. We highlighted Zoom as an example in a previous market update but other names seem to be attracting a lot of attention from options traders. |
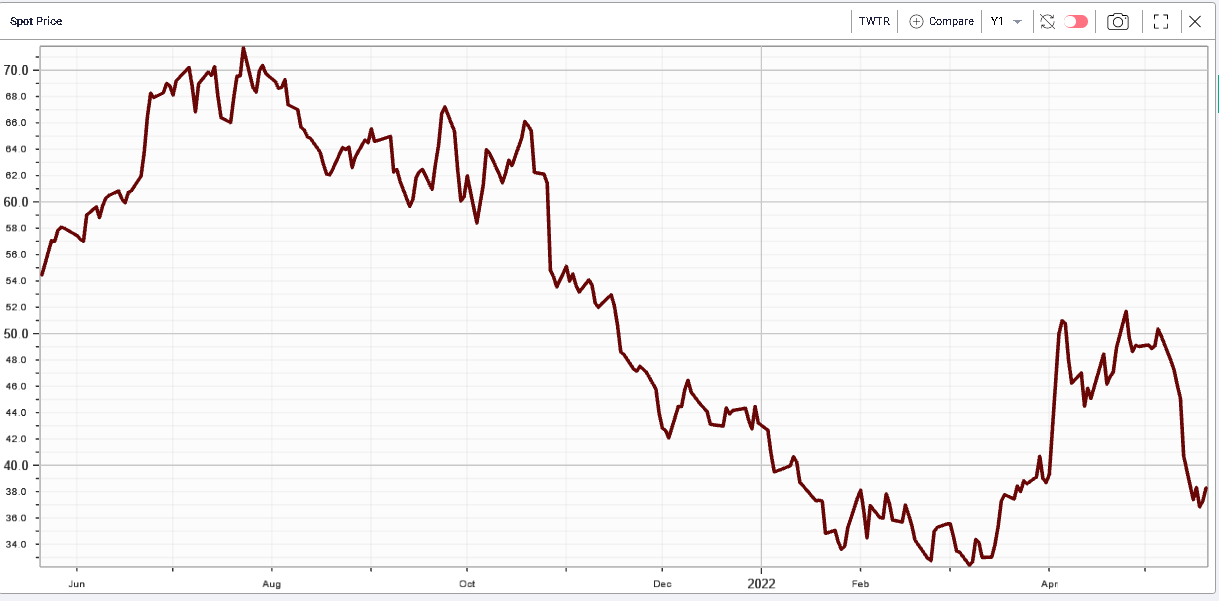
Twitter is such an example with its term structure displayed below: |
|
Following the bid by Elon Musk, the stock jumped above $50 but never really reached the $54.2 bid level. |
|
As the most recent rhetoric from Elon Musk has given investors concerns about the possibility that the deal might not go through, the stock price of TWTR has dropped back below $40. |
The market is now getting ready for a possible one-off large move in either direction and this is expected to happen relatively shortly as shown by the inverted term structure. |
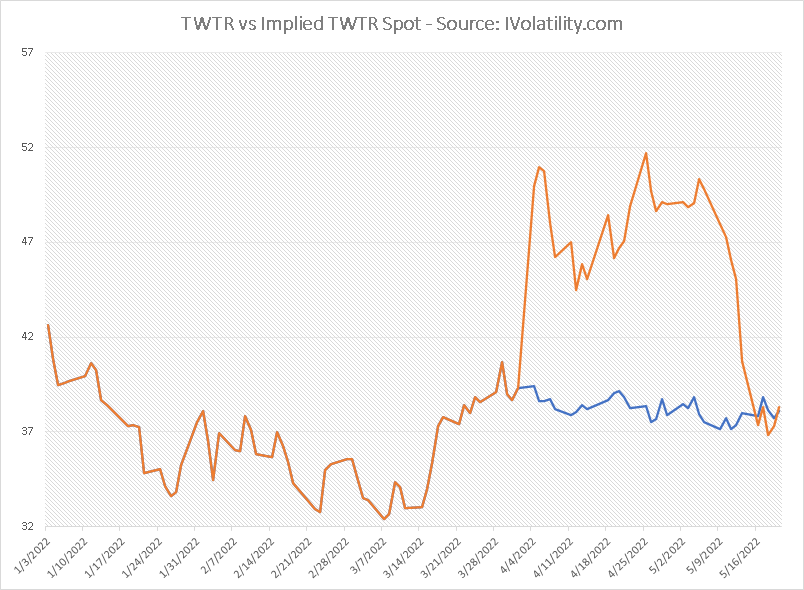
When dealing with special situations as is the case with TWTR it is always useful to try and use a reference point that helps to understand what other market participants are pricing. Here we calculate the theoretical value of TWTR based off a basket of stocks in order to track the difference between that theoretical value and the market value. |
|
In orange we show the market price of TWTR, in blue our best guess of where the stock would have been had the deal not been announced. Both lines diverge from the 4th of Apr’22 when Elon Musk was announced as the largest shareholder of the company and the stock suddenly jumped 27% on the day. |
Interestingly, it seems that market value as well as theoretical value are now at the same level suggesting that the market is not assigning a large probability to a deal happening, at least at the original price of $54.2. |
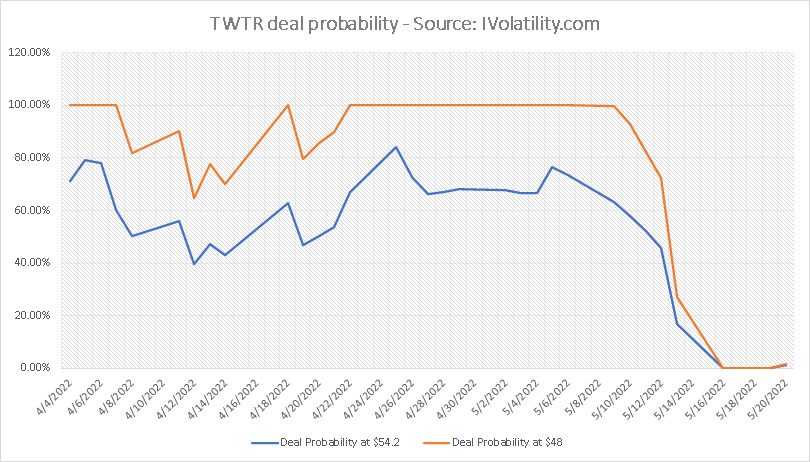
Working out that probability, we can see two important points: |
|
This is obviously a very simplistic approach that aims only to help users understand how users can use IVolatility.com data when trying to make sense of such a special situation. |
It is entirely possible that the market is considering many more options and not just, deal or no deal. For instance, it is possible and has happened on several occasions that the deal happens albeit at a lower price. In the chart below, we try to show the probability of the deal happening for instance at $48 which was priced at 2% on Friday vs a probability of around 0% that the deal happens at the original price of $54.2. |
|
Given this consideration, it is worth thinking about what an option on TWTR represents with the prospect of the deal happening. |
Taking a simplistic view that the deal either happens at $54.2 or does not, then an out of the money option represents a possible claim only in the event that the deal does not happen. Should the deal happen then options would stop to produce their effects and settle at the intrinsic value. |
As a result, the more the market expects the deal to happen, the less attractive options become and conversely. As volatility is, in such a case, the only floating parameter that can help adjust the price of options, we can imagine that implied volatility would be an inverse function of the probability of success of the deal. |
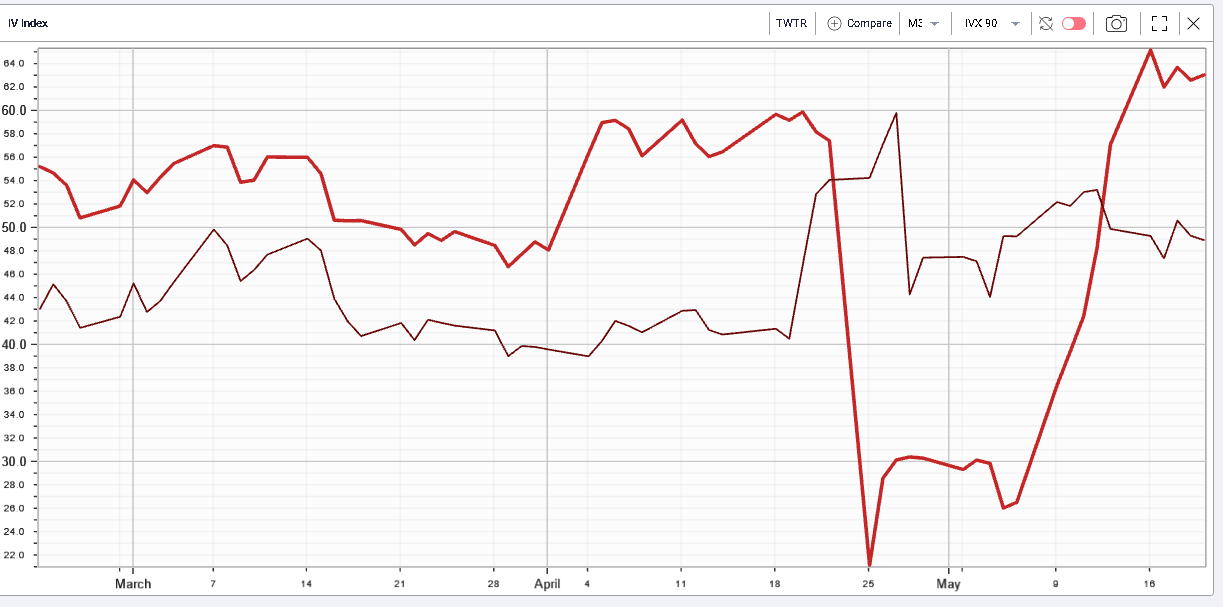
Looking at the 90d IVX as a proxy for implied volatility we show in red the 90d IVX for TWTR and in purple the 90D IVX for FB. |
|
We can see that from the moment the deal gets approved by TWTR, the implied volatility of TWTR drops significantly from around 60 to less than 30. As the probability of the deal happening drops, the implied volatility has moved back up again and is now pretty much in line with where it was relative to FB prior to the deal being announced. |
Disclaimer - This information is provided for general information and marketing purposes only. The content of the presentation does not constitute investment advice or a recommendation. IVolatility.com and its partners do not guarantee that this information is error free. The data shown in this presentation are not necessarily real time data. IVolatility.com and its partners will not be liable for any loss or damage, including without limitation, any loss of profit, which may arise directly or indirectly from the use or reliance on the information. When trading, you should consider whether you can afford to take the high risk of losing your money. You should not make decisions that are only based on the information provided in this video. Please be aware that information and research based on historical data or performance do not guarantee future performance or results. Past performance is not necessarily indicative of future results, and any person acting on this information does so entirely at their own risk. |