Bargain Hunters stepping in? |
A strong day overall in continuation to what was seen late on Friday with one notable exception being China which finished lower by around 1.5% on the day. The SPX finished 1.86% higher, the NDX was 1.68% and the DJIA 1.98%. |
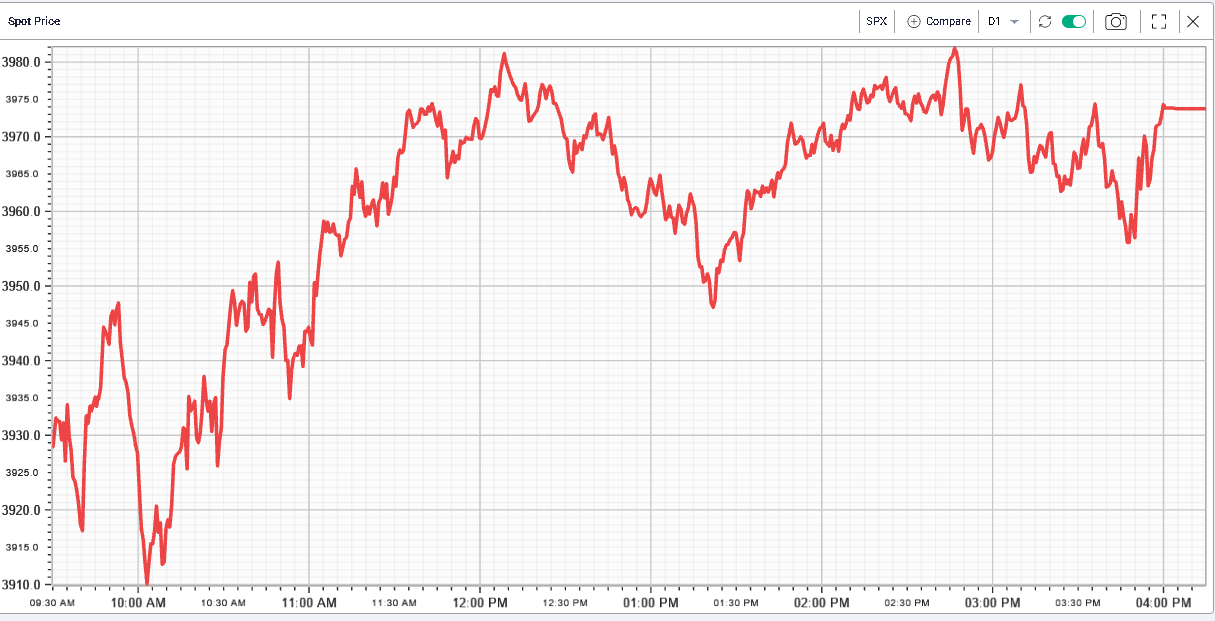
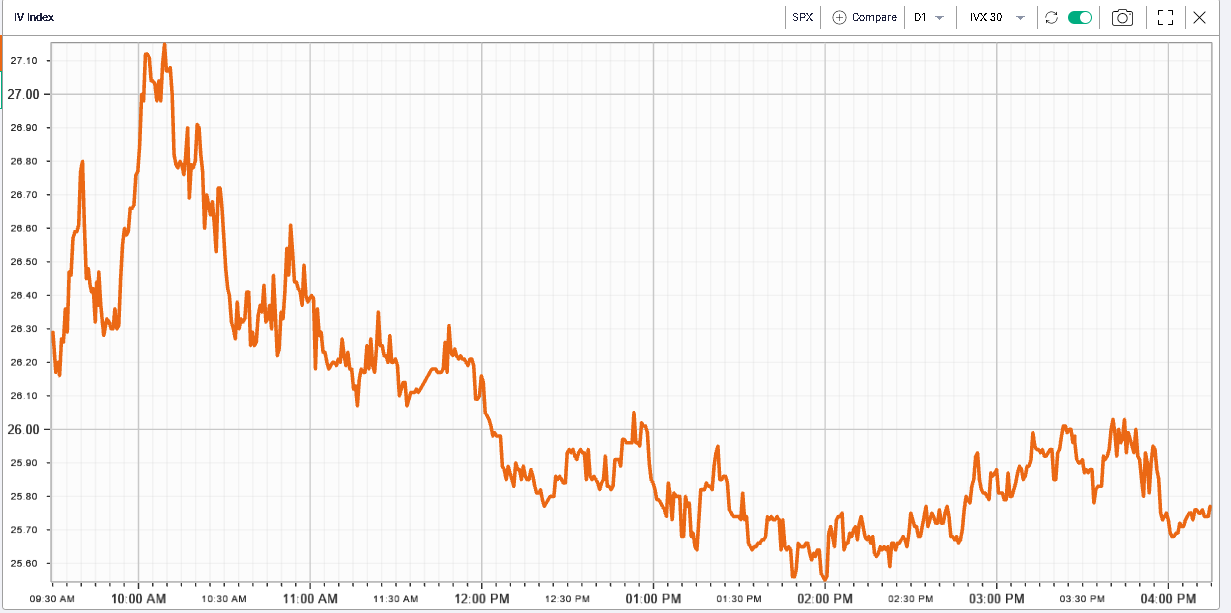
In the first hours of trading, it seemed that implied volatility was outperforming spot prices. Implied volatilities took longer to deflate than spot took to rally but by the end of the session both had converged. |
|
|
In terms of sector performance, Financials performed best yesterday. This is interesting as the sector has rarely been the best performer in 2022 and it will be interesting to see how this performance was realized and if it has the potential to mark the beginning of a new trend. |
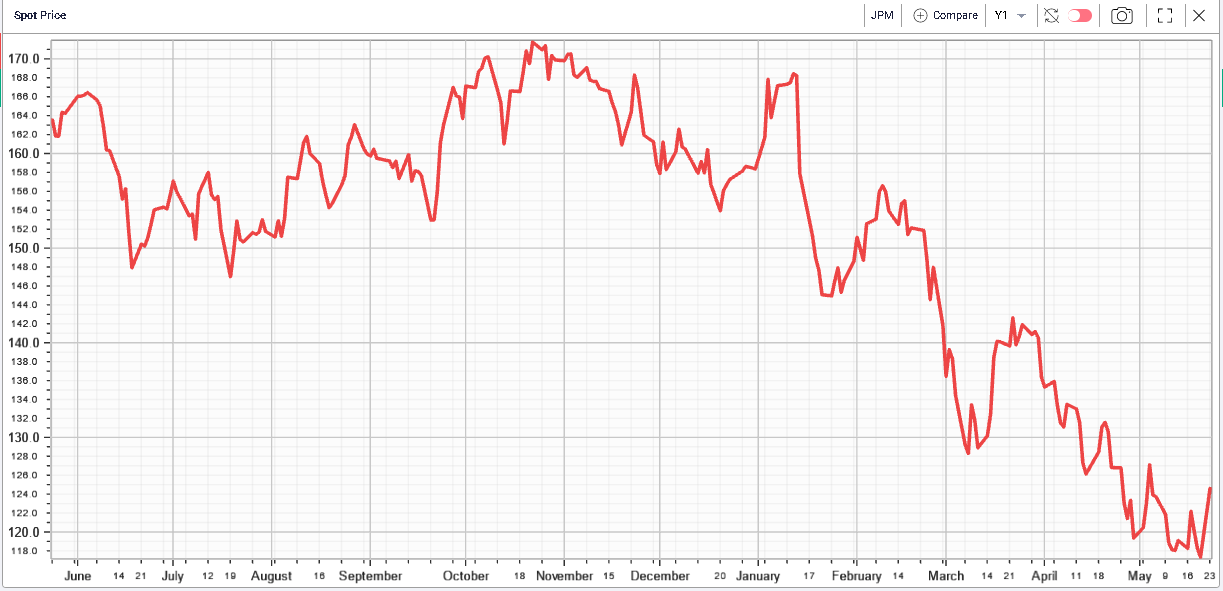
On the year, Financials are still 14% lower as a whole. Within the sector, the performance of JPM was notable with the bank closing 6.2% higher on the day. The name is still almost 23% lower on the year. |
|
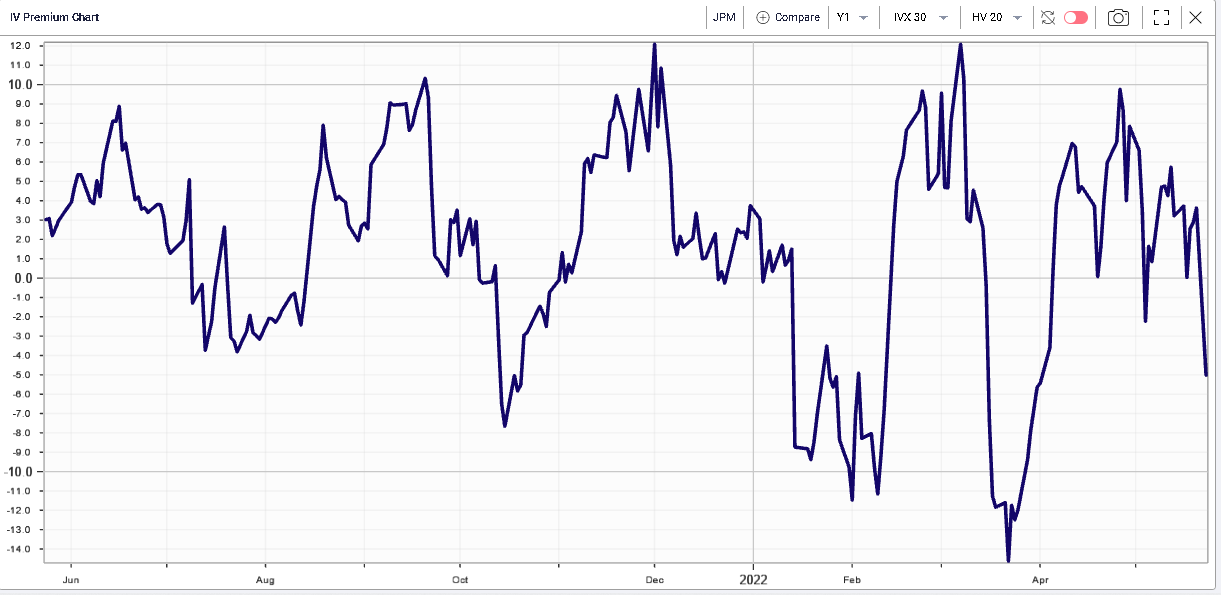
Compared to realized volatility, 30d implied volatility seems to be low as shown on the below IV Premium chart currently in negative territory and slightly lower than average in the 12 months of history displayed in the following chart. |
|
Considering this last point, it seems that option market makers are expecting implied volatility to drop from its most recent realized levels. This gives traders who disagree with this view a good entry point from a volatility perspective as market makers are now happy to sell implied volatility below realized. |
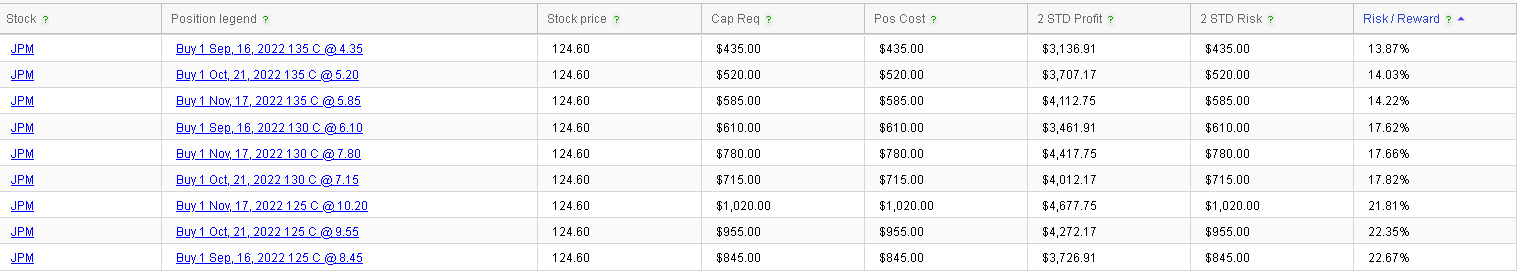
Looking at the RT Spread Scanner and searching for the most attractive naked call to buy based on risk to reward, we find the following list: |
|
For instance, the most attractive calls seen by our scanning system are the Sep 135 Calls costing $4.35. Based on a 2 standard deviation move, the system then proceeds to estimate a potential profit of 3,137 giving a risk to reward ratio of 13.87%. In other words, for every 14 cents of risk the trader is willing to take he stands to make $1 in profit. |
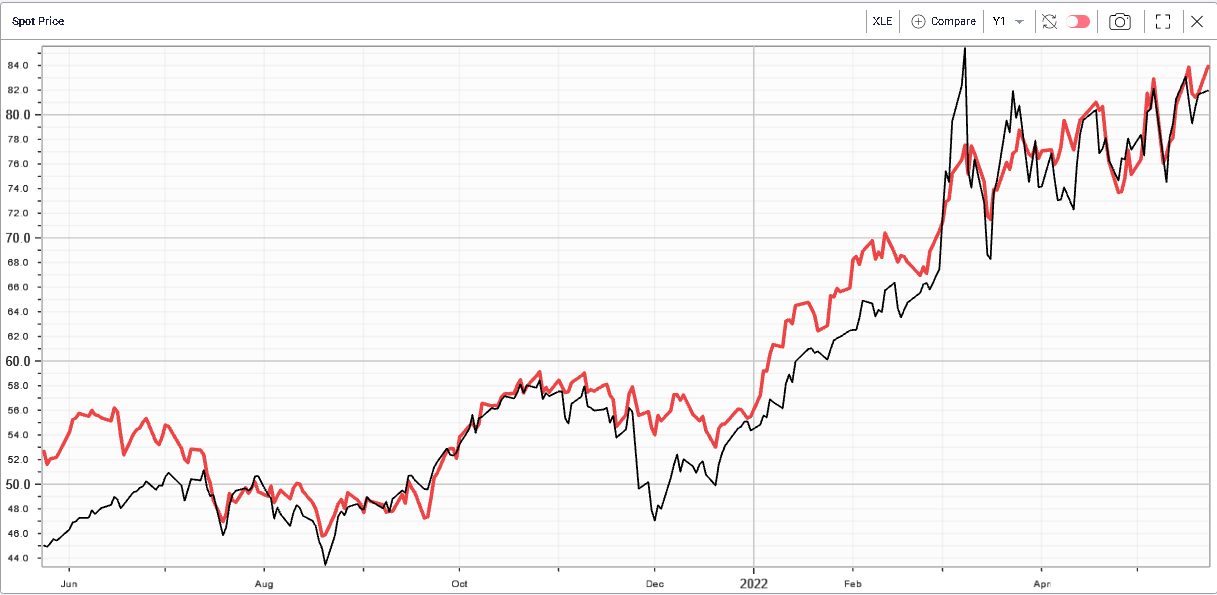
Outside of Financials, the Energy space has remained quite strong tracking almost perfectly the underlying moves in Oil as shown in the below spot price chart displaying in red the energy sector and in black the USO. |
|
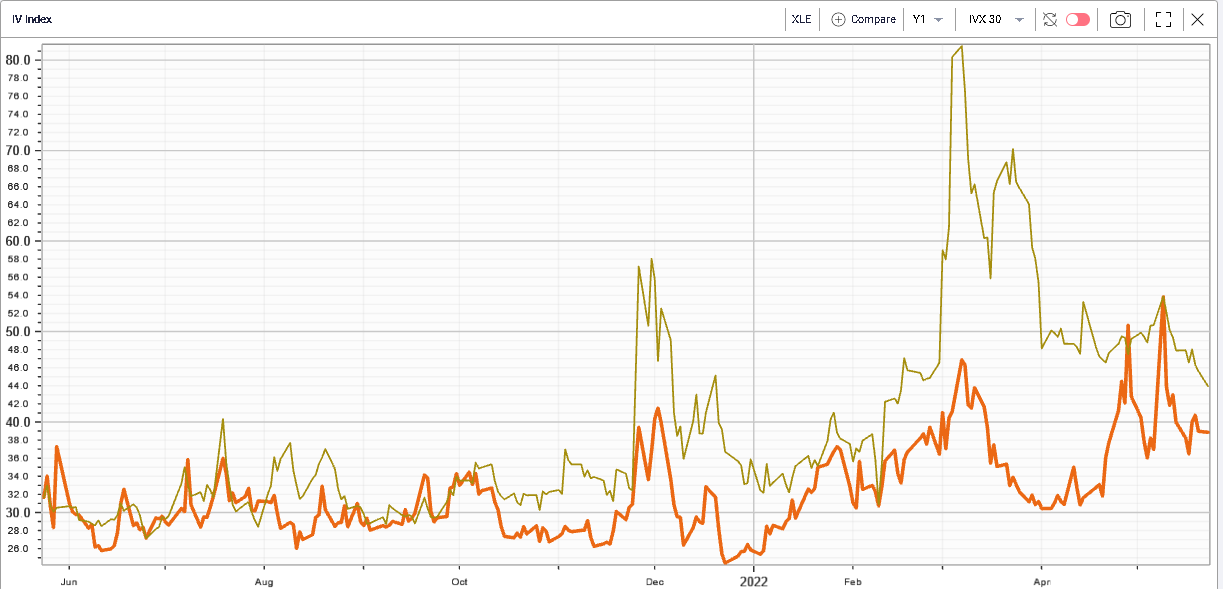
Implied volatilities seem to be converging mostly driven by a move lower in USO volatility in yellow below while the Energy space implied volatility remains steady for now (in orange below). |
|
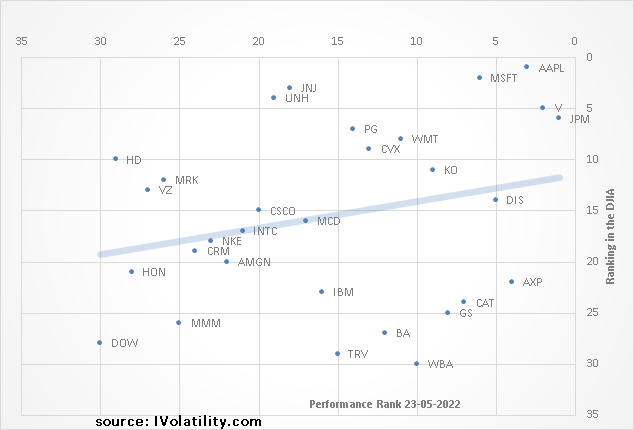
Looking at the components of the DJIA it is very clear that investors and traders were happy to add more risky bets yesterday with names like JPM, V or AAPL all outperforming and up more than 4% on the day. |
Names that underperformed are the more defensive ones with the likes of MRK and JNJ doing slightly worse than the overall index. This being said, traders do not seem focused yet on rotating out of defensive stocks and into riskier names. All but 3 stocks in the DJIA finished up on the day. |
Rather it may be the case that, following Friday’s expiration, traders were putting money to work which may explain the distribution of performance within the index with some of the largest components of the DJIA outperforming on the day. |
|
This is obviously not an exact science and stock specific stories would have modified this overall picture. Another important point is that overall, the stock that performed best yesterday were those that had underperformed on the year. Here again there are plenty of exception but names like JPM, AAPL, DIS or MSFT have been under pressure on the year and showed some strength yesterday. |
Disclaimer - This information is provided for general information and marketing purposes only. The content of the presentation does not constitute investment advice or a recommendation. IVolatility.com and its partners do not guarantee that this information is error free. The data shown in this presentation are not necessarily real time data. IVolatility.com and its partners will not be liable for any loss or damage, including without limitation, any loss of profit, which may arise directly or indirectly from the use or reliance on the information. When trading, you should consider whether you can afford to take the high risk of losing your money. You should not make decisions that are only based on the information provided in this video. Please be aware that information and research based on historical data or performance do not guarantee future performance or results. Past performance is not necessarily indicative of future results, and any person acting on this information does so entirely at their own risk. |