Is the selloff finished? |
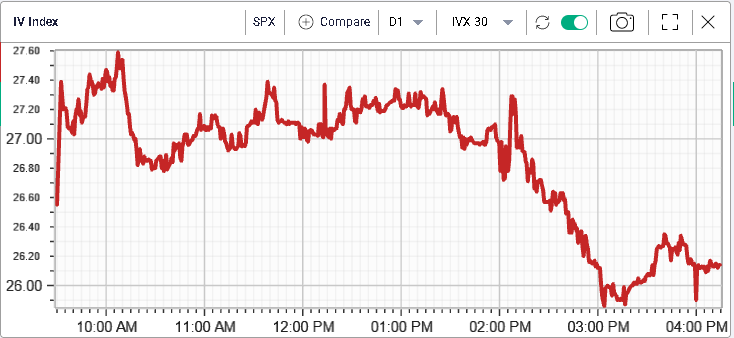
Markets held yesterday with the SPX closing about 1% higher on the day, the NDX finished 1.5% higher and the DJIA 0.6%. Implied volatilities were under pressure throughout the session and the SPX 30d IVX closed around 26. |
|
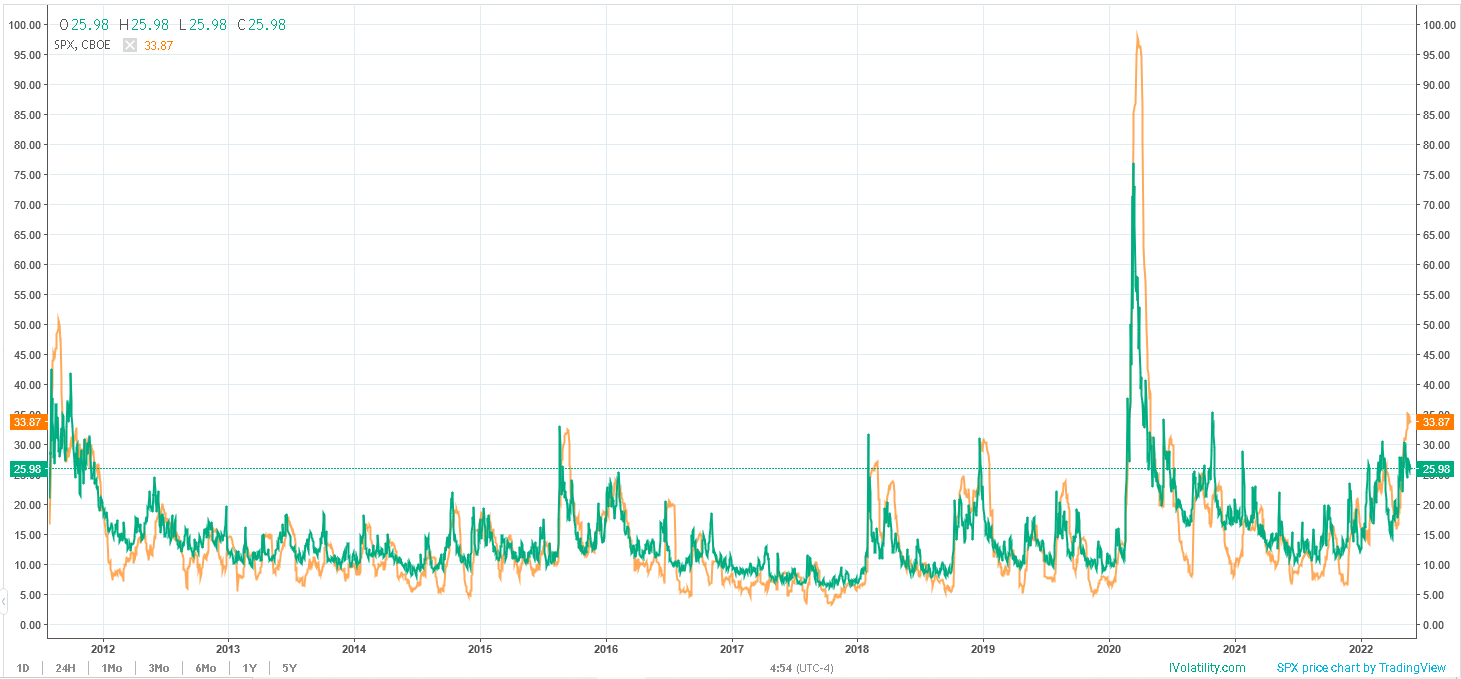
Looking at a long-term volatility chart both for implied in green and realized in orange, we can see that while implied volatilities have stopped going up, realized continue to grind higher reaching levels only seen during meaningful crisis such as the pandemic or the European sovereign crisis. |
|
This disconnects creates a situation where, at least optically, implied volatility in the US looks as cheap as they have been relative to realized volatility over the past 12 months with 30d IVX trading around 8 vols lower than the 20 realized. |
|
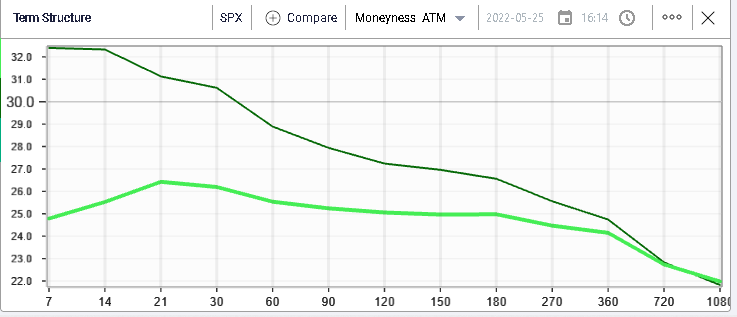
This continued confidence by market makers that volatility will converge back lower is visible in the term structure shown below where we show in dark green the term structure as of the 7th Mar’22 and in light green the term structure as of yesterday. |
|
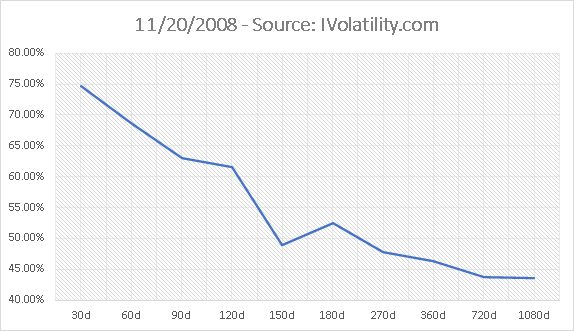
Just as an example, we show below the shape of the term structure as of Nov’08. Although the shape resembles that of early Mar’22, we can see that the levels are vastly different. |
|
The current shape looks flatter and does not show any particular sign of stress from options traders. |
Looking under the surface, yesterday’s price action was fairly pro-risk with the Consumer Discretionary space outperforming the wider market and finishing almost 3% in the green. AMZN was strong +2.6%, and TSLA gained 5%. |
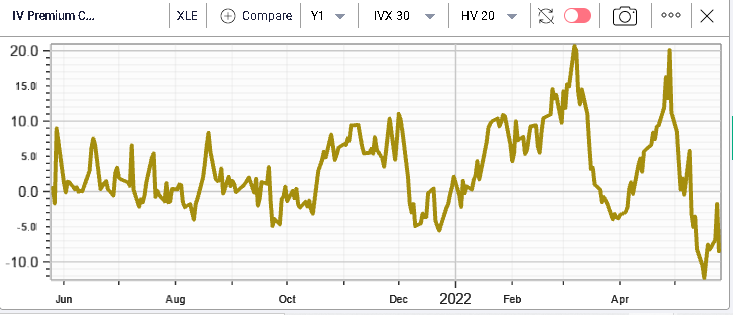
As Oil holds steady, the Energy space continued to push higher and has gained 16.5% over the past month. Despite this advance, the implied volatility in the space continues to screen as good value contrary to what we saw and flagged in early March when it seemed that traders were caught by surprise and scrambled to buy volatility. |
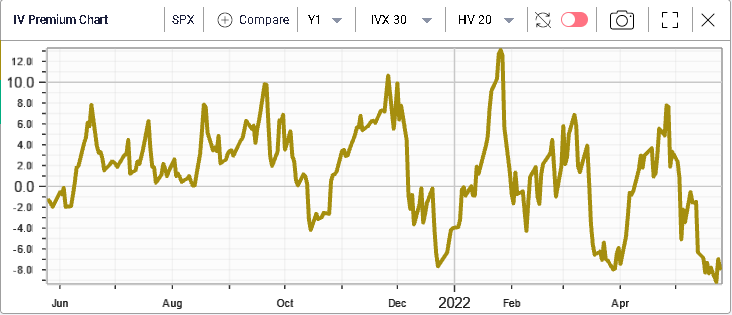
The 30d / 20d IV Premium screens as being very low when compared to its 12 months history as shown below. |
|
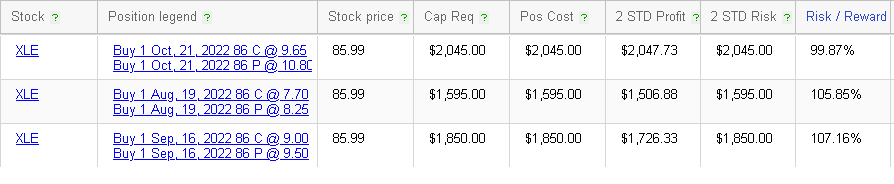
Using the RT Spread Scanner and searching for attractive straddles to own, we get the following 3 proposals. The Aug’22 86 Straddles are priced at $15.95, the Sep’22 86 Straddles at $18.5 and the Oct’22 86 Straddles at $20.45. |
|
As a reminder, we have moved $12.2 over the last month and almost $30 on the year. |
Some sector rotation was visible yesterday with the more defensives names struggling while more risky stocks seemed to be bought. |
PG finished 1.65% lower and was the worst performing stock within the DJIA. JNJ and MRK were both almost 1% lower on the day. |
On the upside, AXP outperformed the DJIA closing 3.2% higher on the day and BA also tried to bounce and settled 2.28% higher. |
A question on many traders’ mind is whether the current bounce we have witnessed this week is the sign that a firm bottom is in place or not. Although it is almost impossible to answer that question at this stage, the upcoming end of the month is an interesting point to consider. |
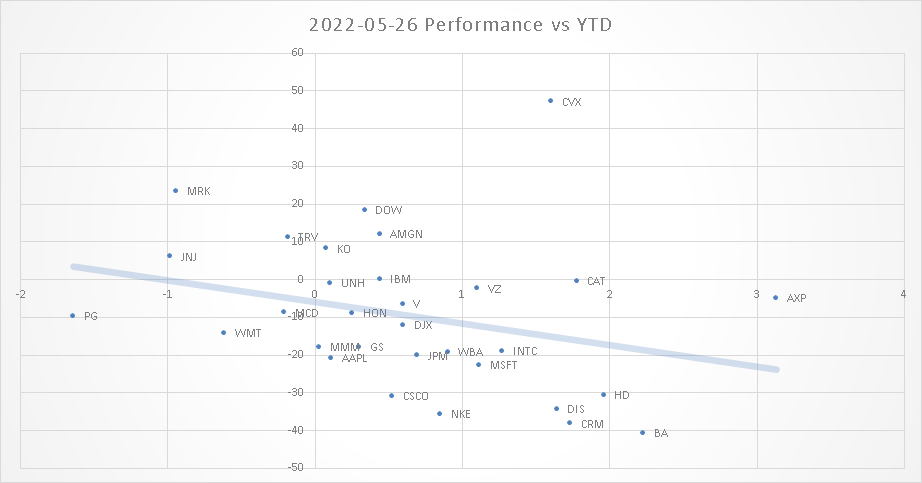
Month-end is typically an important period for portfolio managers and may trigger a rebalancing of portfolios. Looking at the performance of stocks yesterday when compared with their performance for the entire year, we find that some of the best performing stocks on Wednesday were some of the worst performers on the year. |
|
For instance, looking at the BA/HD/DIS/CRM cluster shows 4 names that were more than 30% down on the year that all finished in the green on Wednesday. It is obviously not an exact science but worth noticing anyway. |
It is entirely possible that this type of flow continues over the next few days and until the end of the month without marking a significant reversal in the overall picture of the market. |
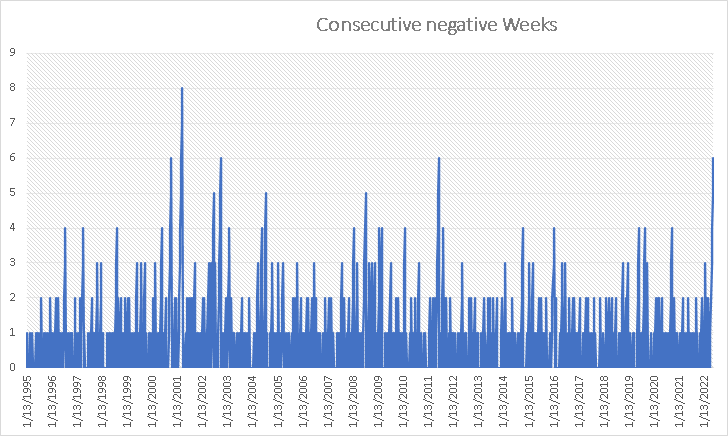
Another important point to consider to evaluate the performance this week is the number of consecutive negative weeks. |
|
Last week we reached an important 6 consecutive weeks of negative returns for the SPX a first since 2011 and a very rare phenomenon over the almost 30 years of history we display above. |
In most instances (think 2008-2009), aggressive and local selloffs were punctuated by very sharp short covering squeezes. Over the past few weeks, we have not seen such a phenomenon happen and the current week would be the 7th consecutive if it ended negative, an event only seen once during the Tech bubble unwind in 2001. |
This should be a reminder that it is entirely possible for the market to catch its breath slightly without marking a significant reversal in the overall picture. |
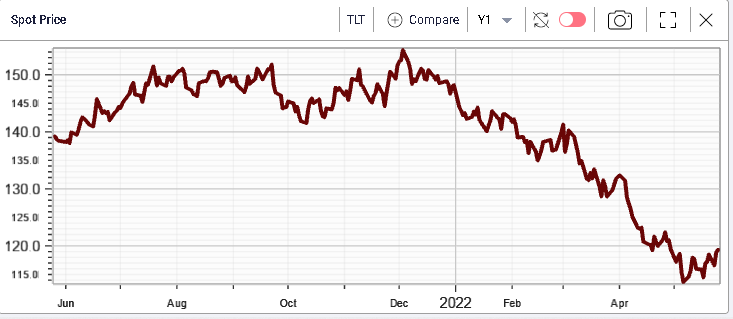
This being said, it is worth keeping an eye on some of the moves happening in other markets, for example in Fixed Income. We have discussed in many markets updates this year how the Fixed Income market seemed to have anticipated the current situation far better than stocks did. |
The US Treasury market started to selloff earlier than stocks did as you can see on the below chart but it also seems to have found a bottom for the time being with 10-year yields moving from 3.14% to 2.74% as of last night. |
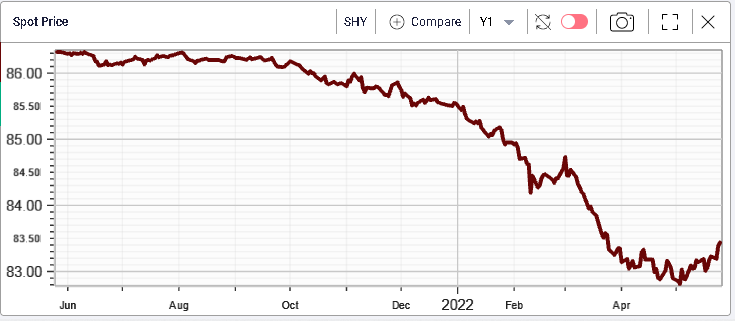
The move has been led by the front end where it seemed that traders decided to reduce the number of hikes they expect over the short run as evidenced with the price of SHY, an ETF that tracks treasuries with a maturity of 1 to 3 years. |
|
We have not removed much but an inflection in that space seems to have happened. |
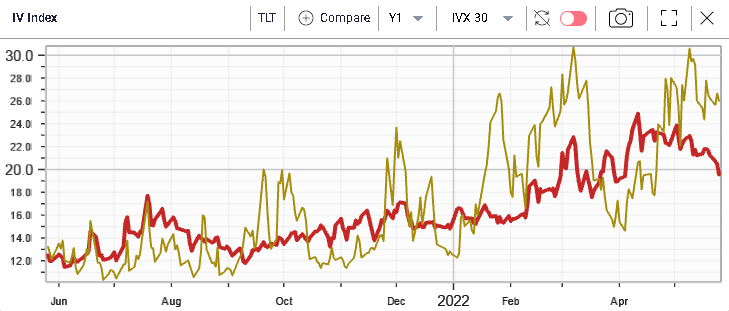
Looking at Fixed Income volatility in red below compared with the SPX volatility in yellow, we can also see that the volatility of treasuries (proxied by TLT) has started to compress quite aggressively while that of the SPX has remained flat for now. |
|
It is possible that this price action is alsolinked to technical elements in Fixed Income but it is an important market to track as it has shown during this move to be slightly ahead of Equities. |
Since the worries we are dealing with are mostly focused on interest rates, inflation and the FED, it is not entirely surprising that the Fixed Income market would take the lead in this scenario and traders would do well to keep monitoring that space. |
|
Disclaimer - This information is provided for general information and marketing purposes only. The content of the presentation does not constitute investment advice or a recommendation. IVolatility.com and its partners do not guarantee that this information is error free. The data shown in this presentation are not necessarily real time data. IVolatility.com and its partners will not be liable for any loss or damage, including without limitation, any loss of profit, which may arise directly or indirectly from the use or reliance on the information. When trading, you should consider whether you can afford to take the high risk of losing your money. You should not make decisions that are only based on the information provided in this video. Please be aware that information and research based on historical data or performance do not guarantee future performance or results. Past performance is not necessarily indicative of future results, and any person acting on this information does so entirely at their own risk. |