280,000 calls on GME |
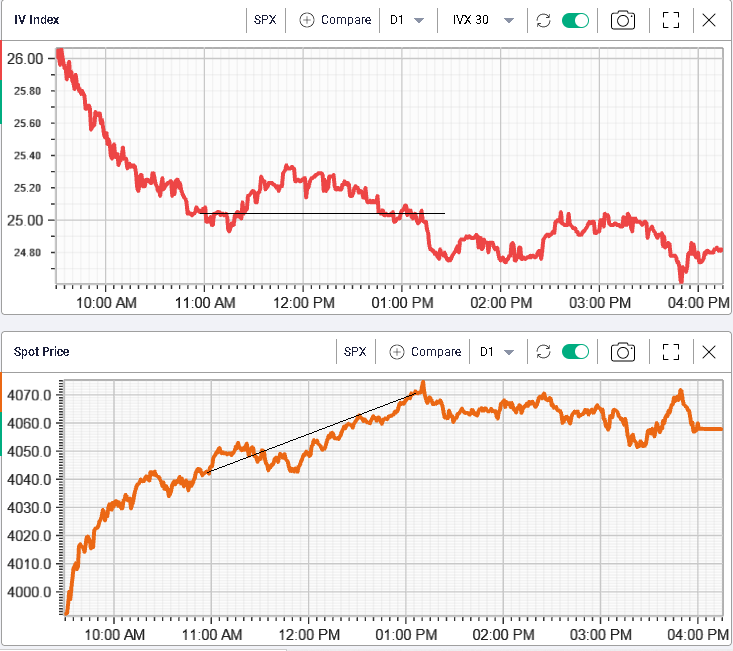
Markets rallied again yesterday with the SPX closing 2% higher, the NDX gaining 2.8% and the DJIA up 1.6%. Interestingly implied volatilities seemed to outperform spot, at least during the first half of the day. Between 11am and 1pm, implied volatility in the SPX remained sticky despite the underlying index gaining more than 30 points. |
|
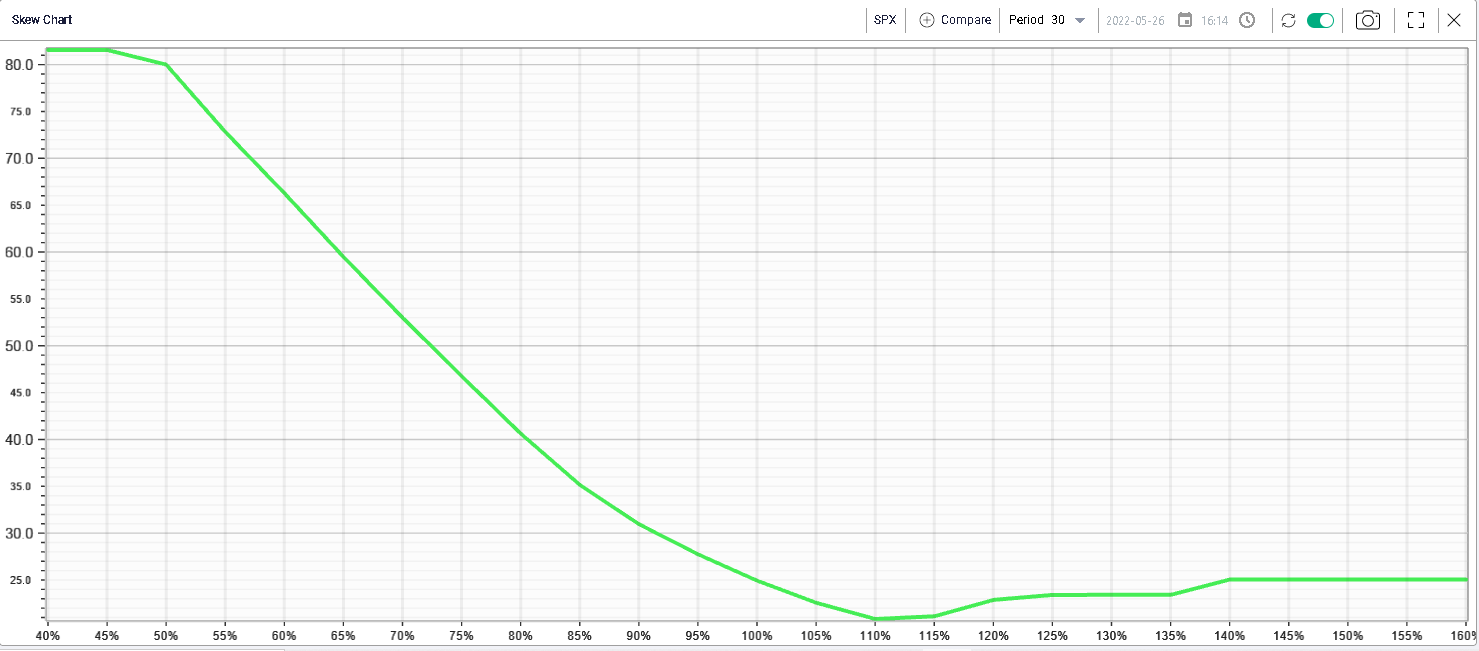
Looking at the skew curve for the SPX, we see that it is very steep on the downside but fairly flat on the upside. For instance, the at the money volatility is worth around 25, the 90% is around 31 and the 110% is sub 21. |
|
A move like the one witnessed yesterday creates a difficult situation for market makers, especially in the front-end. As the market accelerates higher and gains 2%, it sustains a high level of realized volatility which is one of the primary drivers of how implied volatility curves are constructed. |
At the same time, the move higher in spot associated with a reduction in the risk perceived by participants should see implied volatilities compress in order to better reflect the lower risk environment. |
Looking at sectors, Consumer Discretionary stocks outperformed on the day closing almost 5% higher led by TSLA which bounced 7.5% on the day and settled above $700. Tech, Communications and Financials performed well closing up 2.2% on the day. All sectors were in the green except for Real Estate which finished 0.11% lower on the day. |
One name that was in focus yesterday was GME with a large number of call contracts trading, specifically around 280k. |
|
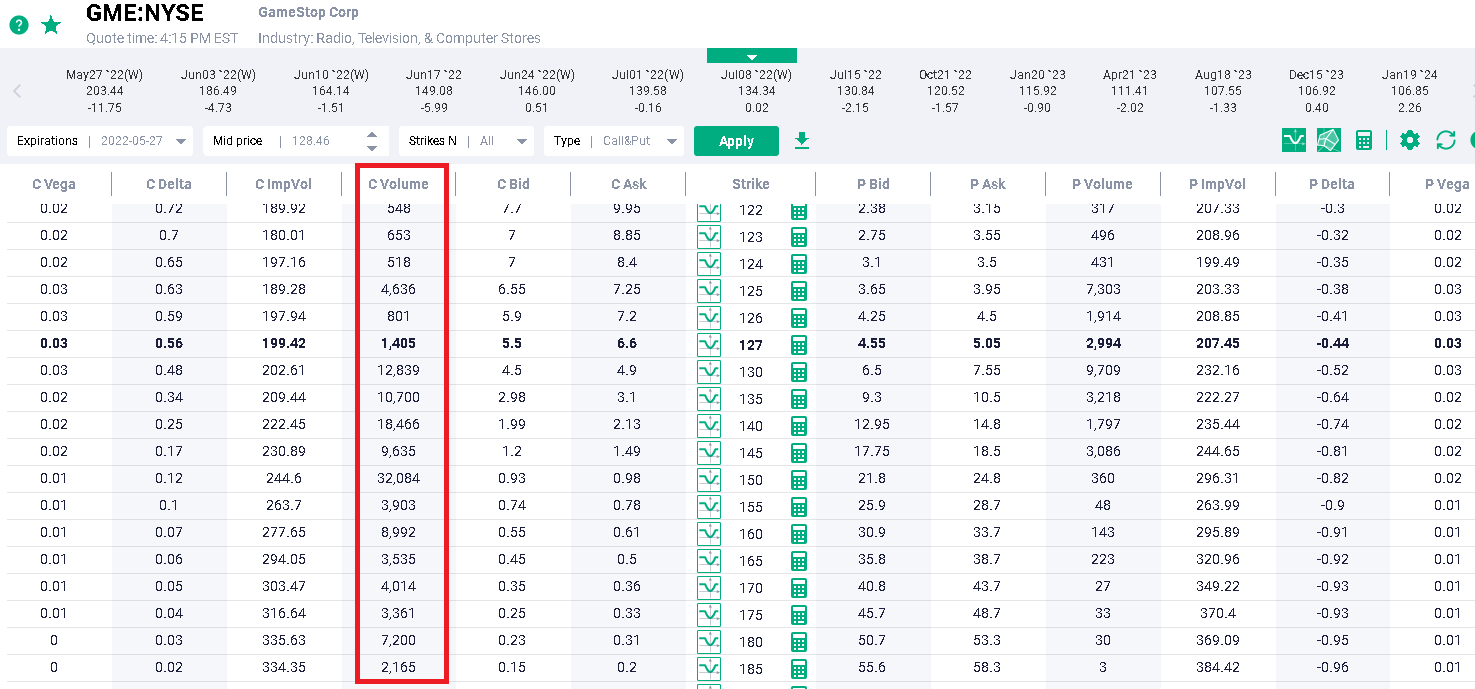
Looking into the options chains, it is quite clear that most of the activity was front-loaded with most of the attention focused on upside calls expiring on the 27th May’22 ie today. |
|
This happens as GME gained 11.5% yesterday to settle at $128.46 after reaching an intraday high of $148.46. More than 32,000 of the 27th May’22 150 calls traded, almost 22,000 of the 27th May’22 200 calls exchanged hands as well. |
This is significant action in the stock and shows that traders are still keen to get involved in the name. |
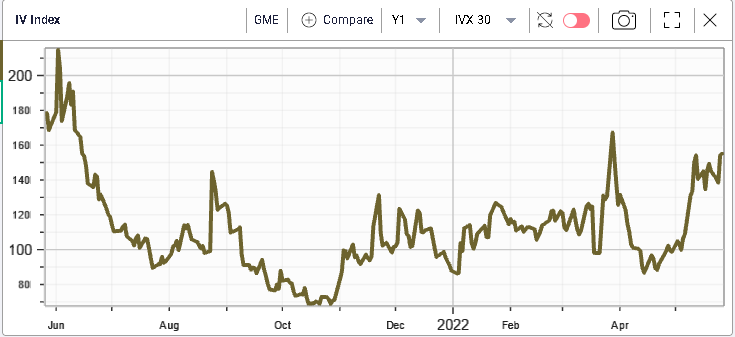
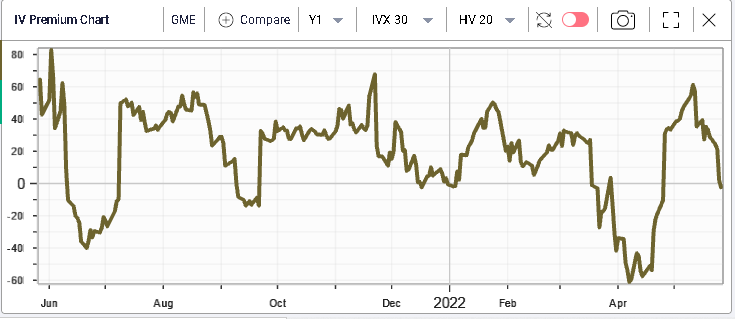
Looking into the name, the demand for options seems to have increased recently and the implied volatility has moved higher over the past few weeks as shown below. |
|
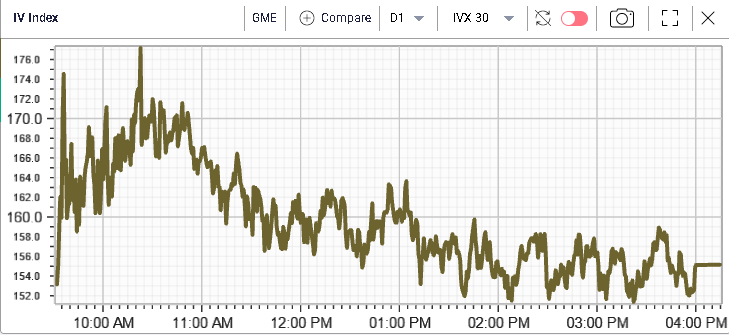
Despite this, implied volatility seemed to struggle to hold its levels yesterday and throughout the session, it felt that market makers were fighting to prevent IVs from spiking even higher. |
|
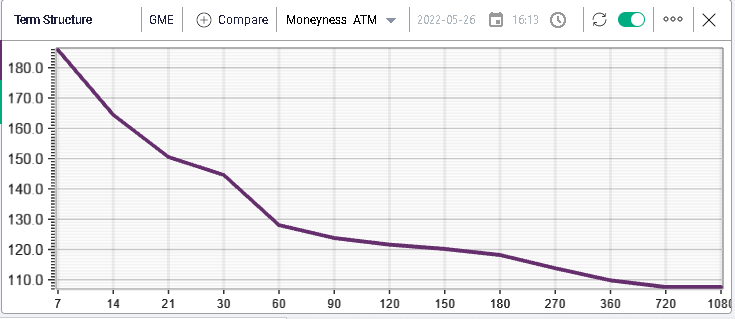
The curve is fairly inverted going into earnings next week on the 1st Jun’22. The entire term structure is above 100, a sign that this company, despite falling under the radar for most people remains a highly sensitive subject for options market makers. |
|
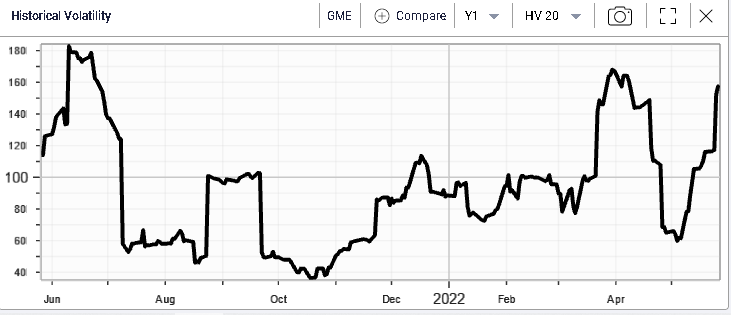
This has happened as realized volatility started to increase significantly over the past few weeks and is now around 160%. |
|
Where does this leave us? |
Overall and despite earnings the IV Premium does not look particularly high historically in the name with 30d IVX trading around flat to 20d HV. |
|
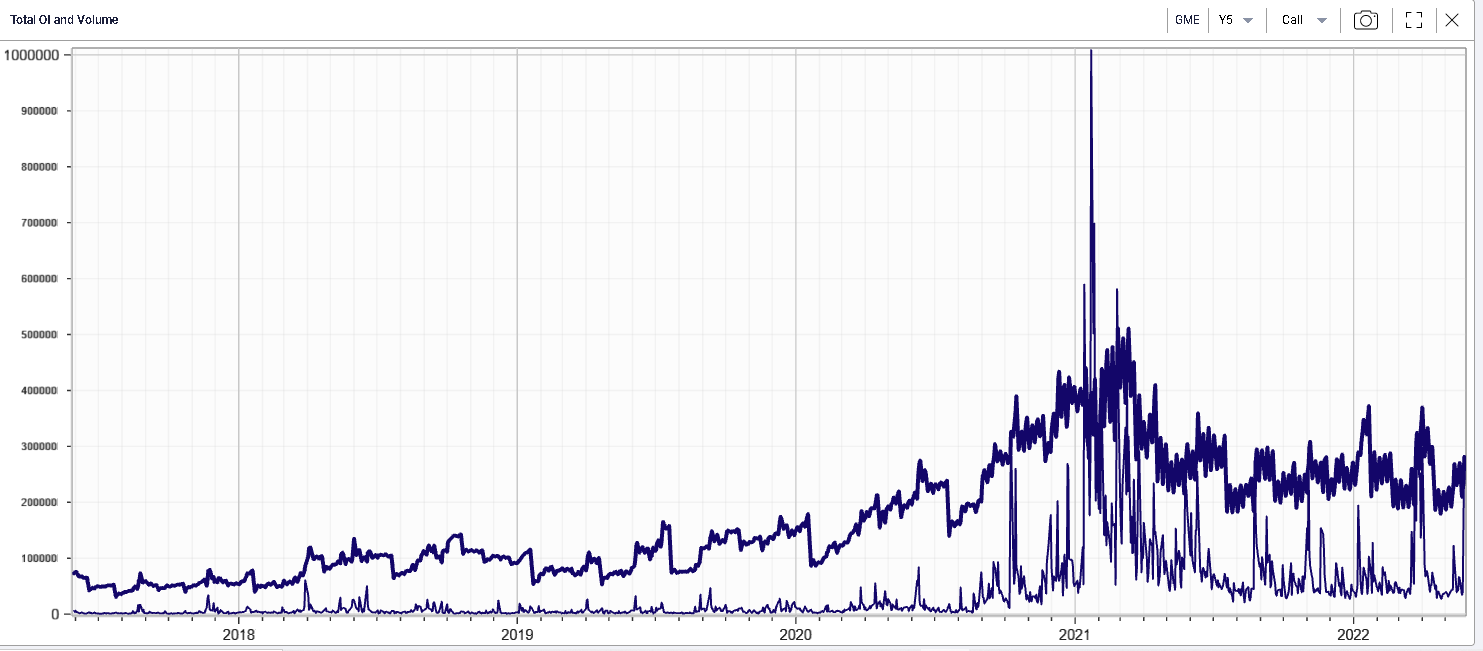
The action on short dated calls is starting to pick up again and volumes yesterday of more than 28 million shares traded via calls is one of the highest levels seen over the last year and a high level even compared with the 5-year history which includes the 22nd Jan’21 when 100 million shares equivalent traded in calls. |
The stock has rallied from $89 on Tuesday to $128.46 yesterday a 44% move in the space of two days on the back of the company announcing a stock split to be approved at next week’s AGM. |
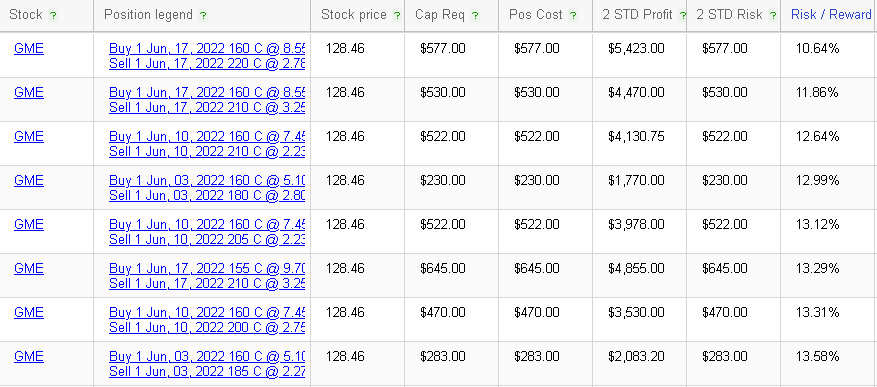
This is the kind of situation when having a strong scanning system in place will be helpful to users. For instance, a bullish trader wanting to limit his potential cash outlay may find bull vertical spreads attractive. The RT Spread Scanner is able to identify some structures that control the amount of risk taken while keeping some decent reward, with a risk/reward ratio of around 11% or 11c of risk for each potential $1 of gain. |
|
Disclaimer - This information is provided for general information and marketing purposes only. The content of the presentation does not constitute investment advice or a recommendation. IVolatility.com and its partners do not guarantee that this information is error free. The data shown in this presentation are not necessarily real time data. IVolatility.com and its partners will not be liable for any loss or damage, including without limitation, any loss of profit, which may arise directly or indirectly from the use or reliance on the information. When trading, you should consider whether you can afford to take the high risk of losing your money. You should not make decisions that are only based on the information provided in this video. Please be aware that information and research based on historical data or performance do not guarantee future performance or results. Past performance is not necessarily indicative of future results, and any person acting on this information does so entirely at their own risk. |