What options traders are doing |
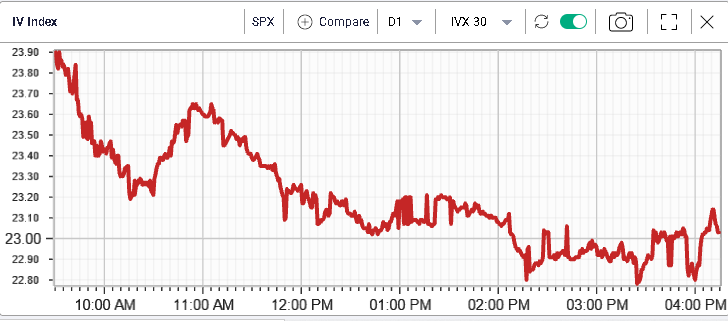
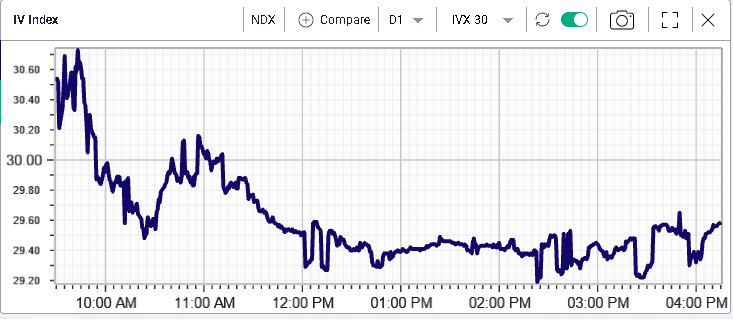
A very strong day on Friday to finish the first positive week for major US indices in about a month and a half. The NDX closed 3.3% higher on the day, the SPX 2.5% and the DJIA 1.8%. |
Implied volatilities deflated over the day with 30d IVX for the SPX losing about 1 point and 30d IVX for the NDX shedding about a point as well. |
|
|
European indices also performed well with the German DAX and the French CAC both gaining more than 1.5% on the day. |
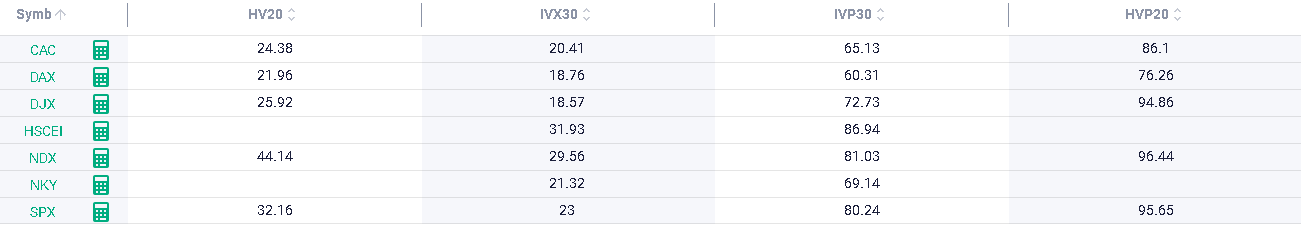
Zooming out we find that although implied volatilities have deflated, they remain elevated historically as shown below with the percentiles for both 30d IVX and 20d HV over the past 12 months. |
|
Across major global indices the DAX and the CAC are lower than the rest while US and Chinese indices seem higher. This is based off their own respective history over the past 12 months. This slight divergence is also visible on realized volatility. |
As discussed in previous market updates, this has created a situation where European indices trade at volatility levels that are lower than those seen for their American counterparts, a relatively rare occurrence since the 2008-2009 Global Financial Crisis. |
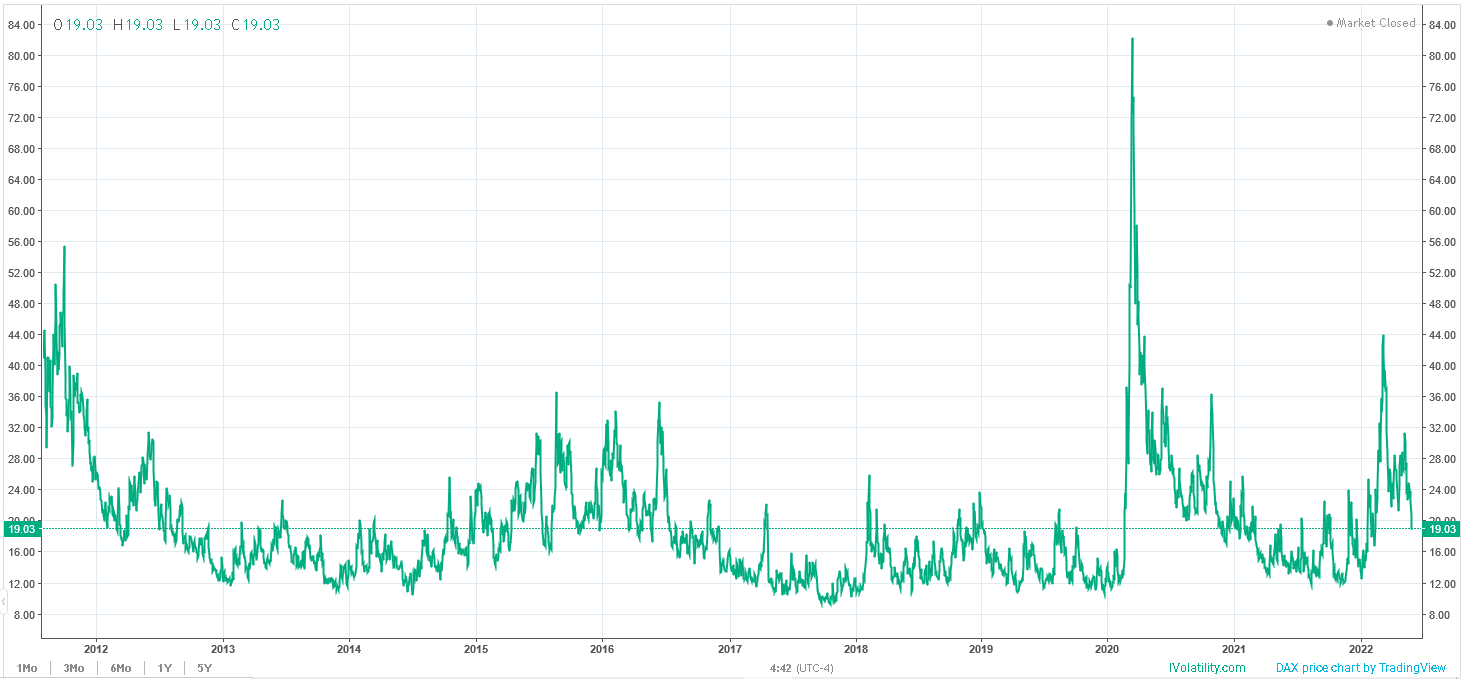
It is also staggering to see that the 30d IVX for the German DAX for instance, despite all the risks outstanding in the market is now back around 19%. The below chart shows the 30d IVX since 2012 for the DAX. The recent volatility compression has pushed back implied volatilities around their average level when measured over the past 10 years. |
|
Looking at stock performance, within the DJIA, all 30 components managed to close in the green on Friday. AAPL was the best performer for the day up around 4% while KO lagged and finished up a mere 0.6%. |
Sector wise, the more pro-risk segments of the market did better with the Consumer Discretionary space up 3.4% on the day led by names like AMZN + 3.66%, TSLA +7.33%, NKE +2.7%. |
The Technology space also did well on the day gaining 3.3%. MSFT gained 2.8%, AAPL 4.1%, NVDA 5.5%, Broadcom 5.9%. |
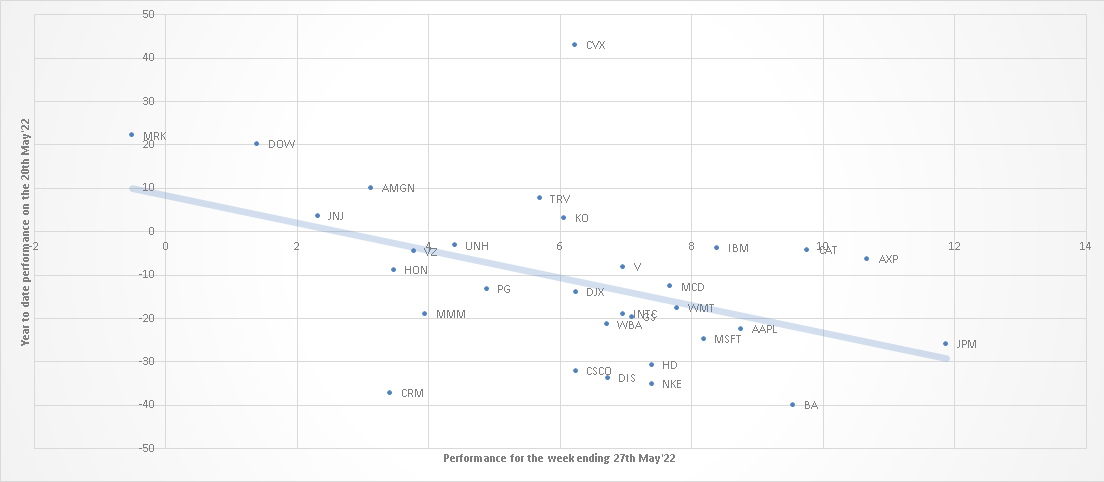
Overall, last week’ bounce in the market was led by the names that had dropped the most until then. At the index level, this is particularly obvious. Last week’s top performer, the NDX was up 7% and also had the worst performance of the major global indices until the 20th May’22 down around 27.5%. |
The SPX was the second-best performer on the week up 6.5% while it was down 18% on the year as of the 20th May’22. On the other hand, the NKY, which was the best performing index on the year as of the 20th May’22, down about 9% was the second worst performing index with a move higher of only 0.15% on the week trailed only by the HSCEI which lost 0.5% on the week. |
Within the DJIA, a relatively similar trends emerges where some of the biggest winners on the week were laggards on the year. JPM for instance is a good example with a weekly rally of almost 12% and a year-to-date performance as of the 20th May’22 of -26%. |
|
Looking at things from that angle also helps us find outliers. For instance, we can note the following: |
|
It will thus be important to evaluate how things evolve going into month-end next week. In a previous market update we discussed the importance of that event as a potential catalyst to support the market in the near term. |
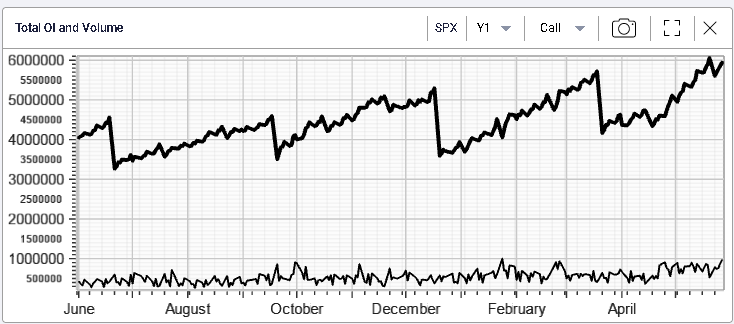
Friday also saw a pickup in the trading activity on the call side with volumes on SPX calls reaching their highest level in 12 months and open interest very close to its 1 year high. |
|
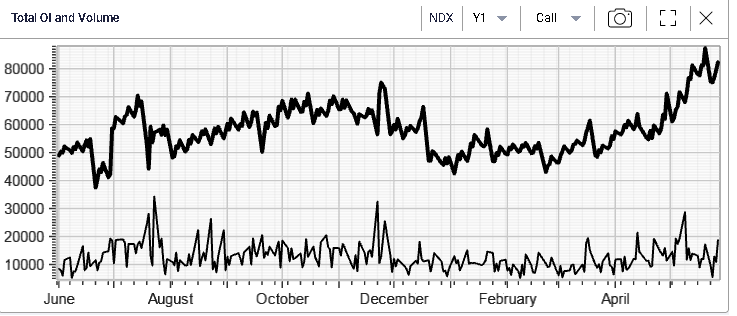
On the call side, Friday saw some activity on the SPX Jun’22 4100 calls which traded around 12.6k. In the NDX, the Jun’22 11800 calls were the most active options on the day trading around 2,000 times. For the NDX, volumes were pretty large on the call side and the call open interest has increased significantly and is very close to its 12 months highs as shown below. |
|
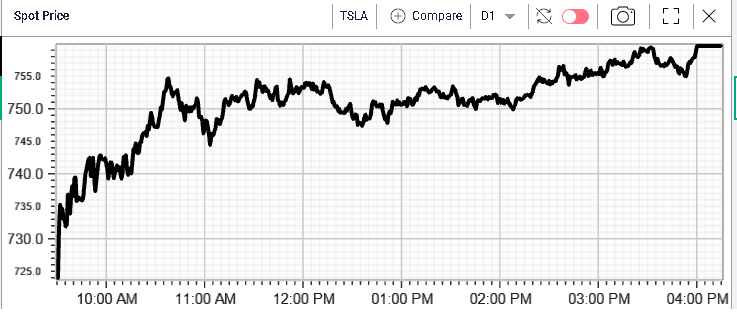
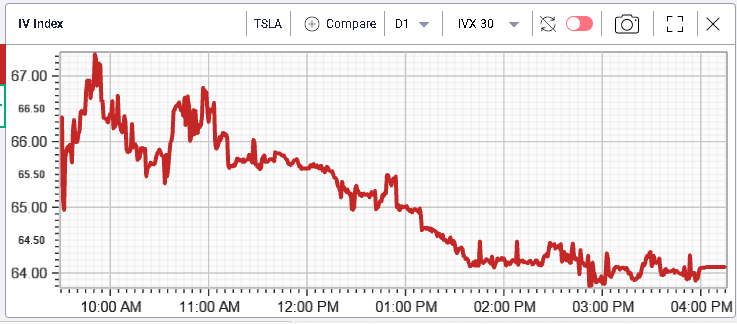
| At the single stock level, TSLA continued to push higher and settled around $760. Implied volatility dropped marginally over the day considering the size of the underlying move. |
|
|
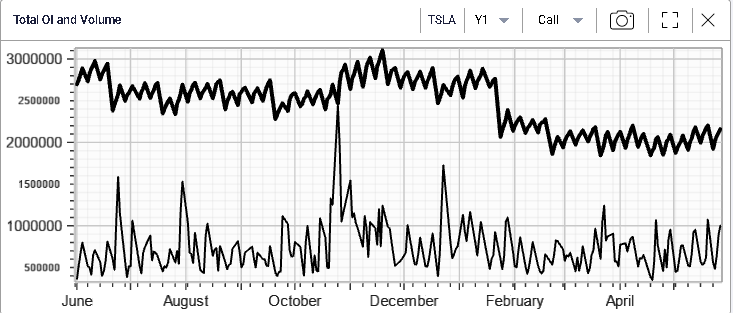
Call activity in TSLA remains elevated with more than a million contracts trading on the day. The open interest has remained relatively flat for now possibly a sign that traders involved in the name remain focused on short term strategies and are relatively quick to unwind their positions contrary to what we can see in other parts of the market. It could also be linked to the fact that most of the plays being traded are focused on short dated expiration and options expire before the open interest really has a chance to increase. |
|
The activity on the 3rd Jun’22 800 calls would tend to support this idea with almost 40k contracts trading on that strike alone. A further 26k contracts traded on the 3rd Jun’22 750 calls. |
Other strikes in play expiring next week were the AMZN 3rd Jun’22 2300 and 2400 calls which traded respectively 2.5k and 1.6k. For AAPL where the most active options were the 150 calls expiring next Friday (61.5k calls traded for that strike). |
Overall, it does seem that a lot of traders are focusing on the possibility that this move continues over the next few days and the options activity centered around very short dated options is probably linked to that view. Â More on this next week! |
Disclaimer - This information is provided for general information and marketing purposes only. The content of the presentation does not constitute investment advice or a recommendation. IVolatility.com and its partners do not guarantee that this information is error free. The data shown in this presentation are not necessarily real time data. IVolatility.com and its partners will not be liable for any loss or damage, including without limitation, any loss of profit, which may arise directly or indirectly from the use or reliance on the information. When trading, you should consider whether you can afford to take the high risk of losing your money. You should not make decisions that are only based on the information provided in this video. Please be aware that information and research based on historical data or performance do not guarantee future performance or results. Past performance is not necessarily indicative of future results, and any person acting on this information does so entirely at their own risk. |