What you missed in May |
For the final day of the month of May’22 the market finished marginally in the red with the SPX correcting 0.6%, the NDX losing 0.4% and the DJIA losing 0.7%. May finished as a fairly flat month with the NDX the worst performer of the major global indices losing around 1.6%. The French CAC is the second worst performer with a loss of around 1%. The DAX is the best performer up 2% on the month followed by the NKY which gained 1.7% and the HSCEI up 1.6%. |
The adage “Sell in May and go away” worked far better with volatility than spot with very aggressive implied volatility remarks. Using the 30d IVX as our favorite measure to evaluate what implied volatility actually did, we find that it lost around 7 points in the NKY on the month, 5.5 points in the DAX and the NDX and only 1.7 point for the DJIA. |
At the single stock level, 17 of the 30 names within the DJIA finished the month in red. Despite the bounce seen in the second part of the month, a first brush approximation indicates that losers continued to lose in May and winners continued to outperform. As with all things, there are exceptions to this rule, for instance WMT, which until its earnings had been a fairly resilient name, dropped 16% in May’22. |
Other names, like BA continued to drop in May’22 losing a further 11%. CRM lost 9%, CSCO lost 8%. On the upside, CVX was the best performing stock of the DJIA and gained 11.5%. JPM and VZ finished up 10.7% on the month despite being significant underperformers up until April. |
Overall, it felt that with earnings out of the way, traders got an opportunity to focus on the more micro stories and the results are widespread even within specific sectors. The chiasm between defensive stocks and more risky names was only partly respected and within the same sector, some meaningful divergences happened. For instance, in the Tech/Communications space, CSCO lost 8% while IBM gained 5%. MRK was up 4% while JNJ lost 0.5%. |
For volatilities, things are a bit easier to grasp with the implied volatility of pretty much all the DJIA components finishing lower at the end of May than where they started the month. The largest drop was seen in DIS which saw its 30d IVX lose 13 points. CSCO lost 11.3 points and HD 8 points. Best performing volatilities were in NKE which gained 4.7 points (over the month the stock dropped 4.7%). The only other implied volatility that finished higher on the month was in CRM with a small gain of 0.3 points. |
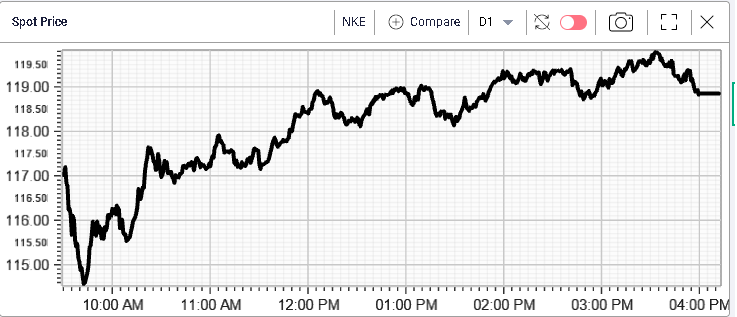
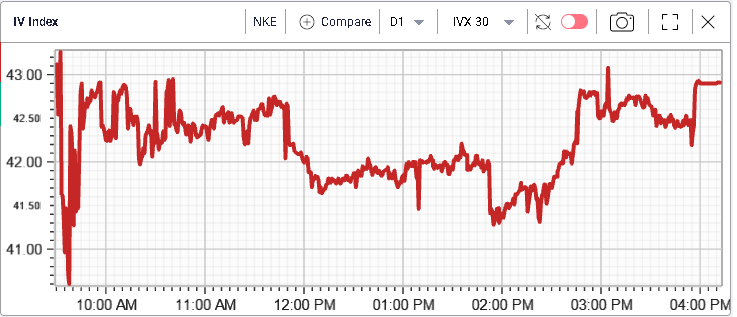
Looking at NKE it was the best performing stock within the DJIA yesterday. Despite this, implied volatility in the name was fairly supported throughout the session. |
|
|
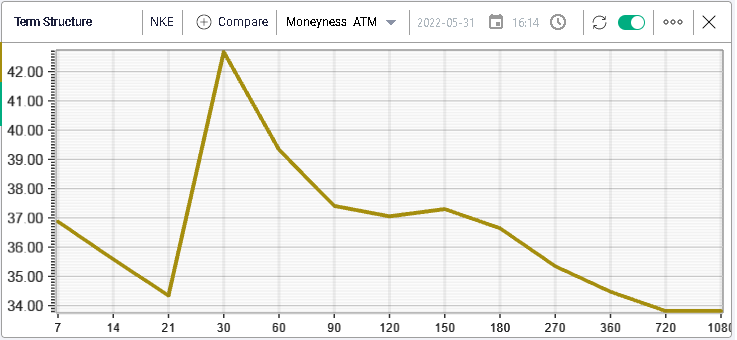
The company is now expected to report earnings on the 27th Jun’22. The term structure shows a fairly large spike around that event which shows that the market’s expectation around what the company might say/release are elevated. |
|
In 2022, NKE has lost around 28% of its value and is one of the worst performing large caps. The market will be interested in getting updates from management around the situation in China and how inflation is impacting the companies’ margins. |
The solid performance of NKE yesterday helped support the consumer discretionary space which was the only sector to finish in the green gaining 0.5%. All other sectors dropped on the day with Materials and Energy the worst performing segments of the market dropping 1.5%. |
To finish, let us look at flows. In terms of action on the final day of the month, a decent amount of activity took place on short dated puts with this week’s 3900 and 3875 trading 16k and 13k respectively on the SPX. Further out, the 31st Aug’22 4345 calls traded 13k. In the NDX, traders exchanged almost 1k of the 13200 and 13300 calls expiring tonight. |
Disclaimer - This information is provided for general information and marketing purposes only. The content of the presentation does not constitute investment advice or a recommendation. IVolatility.com and its partners do not guarantee that this information is error free. The data shown in this presentation are not necessarily real time data. IVolatility.com and its partners will not be liable for any loss or damage, including without limitation, any loss of profit, which may arise directly or indirectly from the use or reliance on the information. When trading, you should consider whether you can afford to take the high risk of losing your money. You should not make decisions that are only based on the information provided in this video. Please be aware that information and research based on historical data or performance do not guarantee future performance or results. Past performance is not necessarily indicative of future results, and any person acting on this information does so entirely at their own risk. |