Looking at technicals |
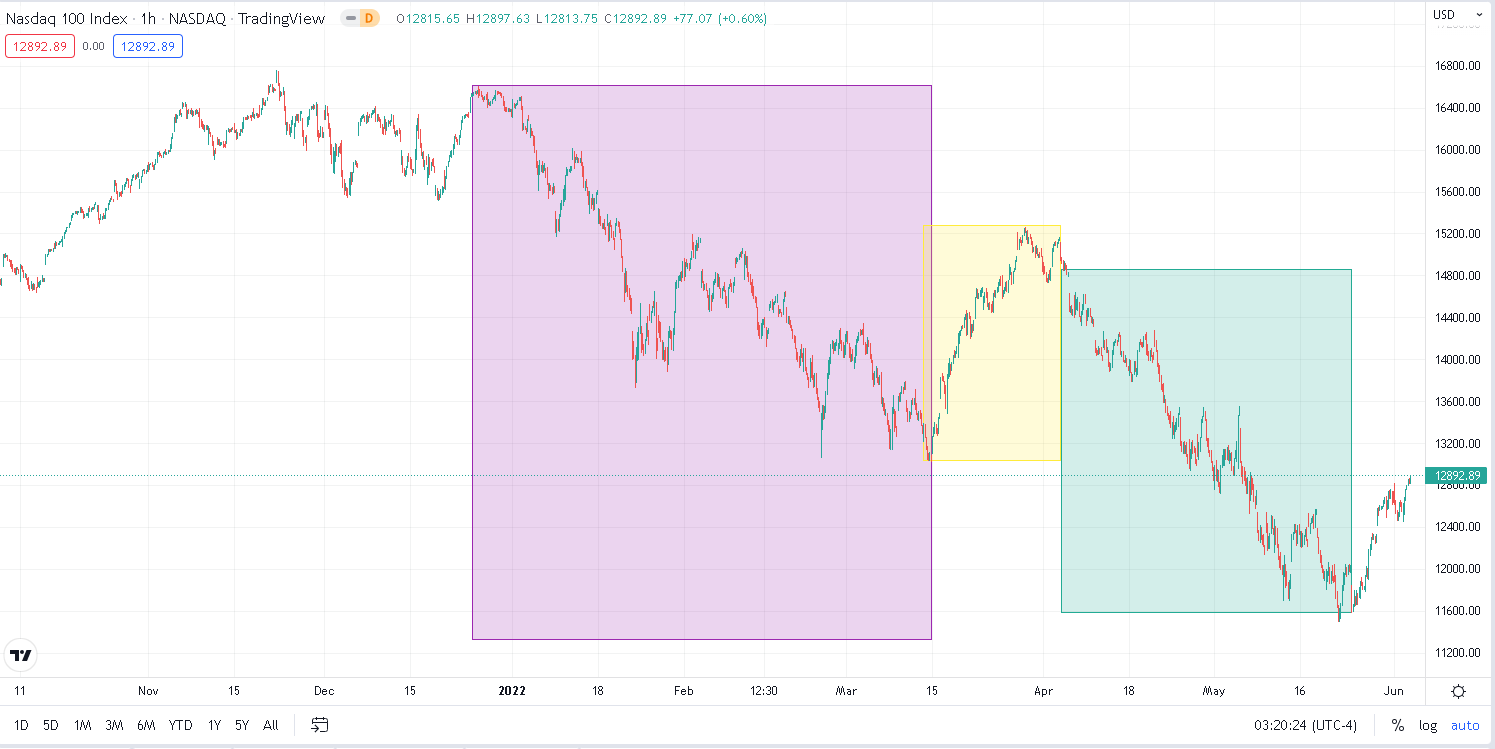
Markets pushed higher yesterday continuing their bounce from the 20th May’22 lows. The NDX has now gained around 12% with big levels ahead of us on the upside. In the short-term, bulls will focus on regaining the 13,000 mark which was lost in early May’22. Should they succeed, a large resistance will be expected around 13,500 which capped the attempts at the beginning of last month to break higher. |
So far this year, the market has operated three complete sessions with the fourth one playing out now. First, in purple, we show the initial selloff that deepened with the geopolitical tensions in Eastern Europe. The second phase in yellow marked a bounce in equity prices from overextended levels. At the same time, the Fixed Income market was slowly resetting expectations for rate hikes in 2022 as it became clear that the FED was behind the curve on inflation. The third phase, in green, marked the realization by equity traders that the FED matters and that stocks were not all going to be immune from what was playing out in bonds. |
Source: Tradingview.com |
It is thus worth putting the current bounce in context and for now, equity traders seem to be relaxing slightly as the Fixed Income market is pricing out some of the hikes expected for 2022 and hopes that peak inflation is behind us are mounting. With earnings season out of the way, stock traders also got the opportunity to search for bargains and to pick the names where expectations had been overly pessimistic. |
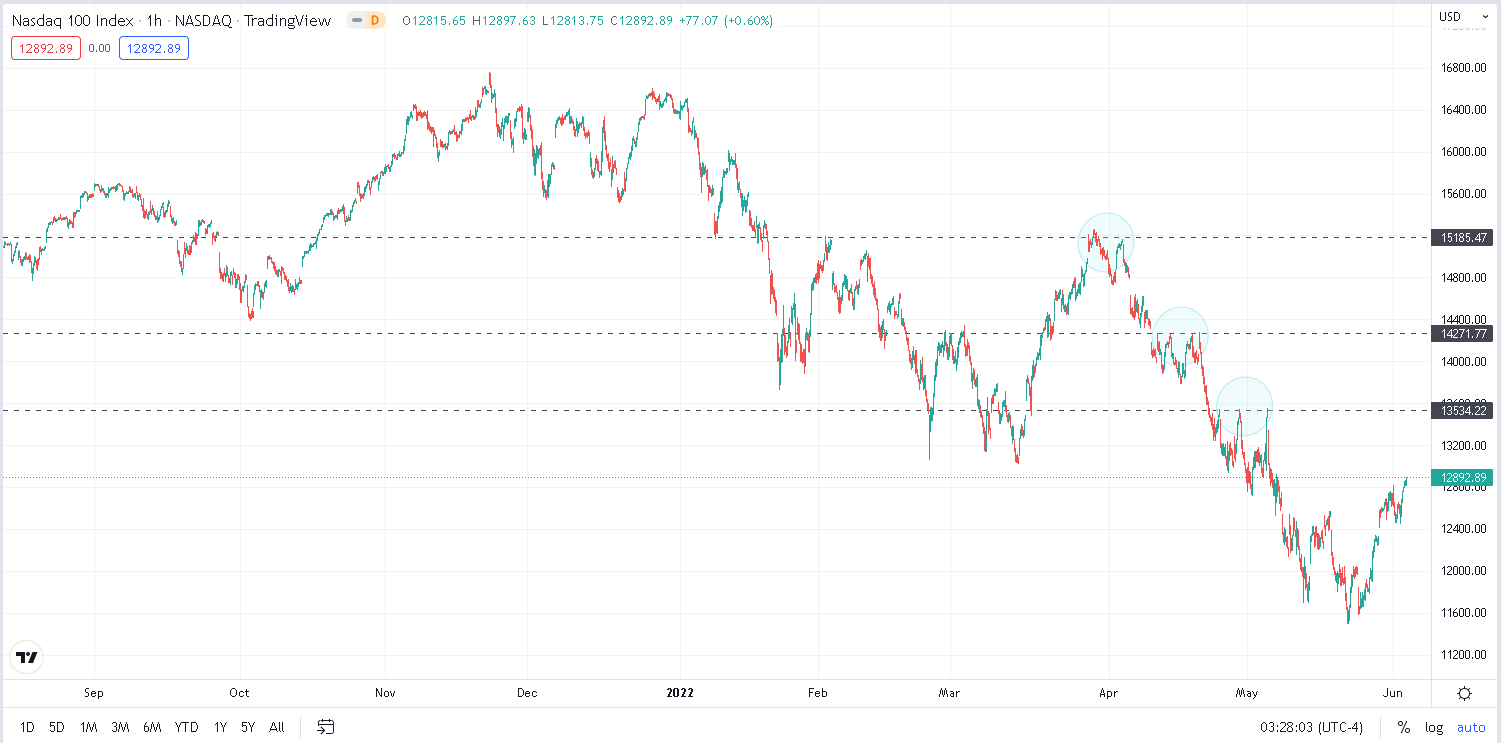
Technically, looking solely at resistances, one could expect some decent battles to be played out around the highlighted levels on the below chart. Those marked places where bulls were defeated in the most recent selloff. |
Source: Tradingview.com |
Yesterday saw the NDX push 2.75% higher while the SPX gained 1.84% and the DJIA was 1.33% in the green. European stocks managed to gain higher with the German DAX settling around 1% higher and the French CAC gaining 1.3%. |
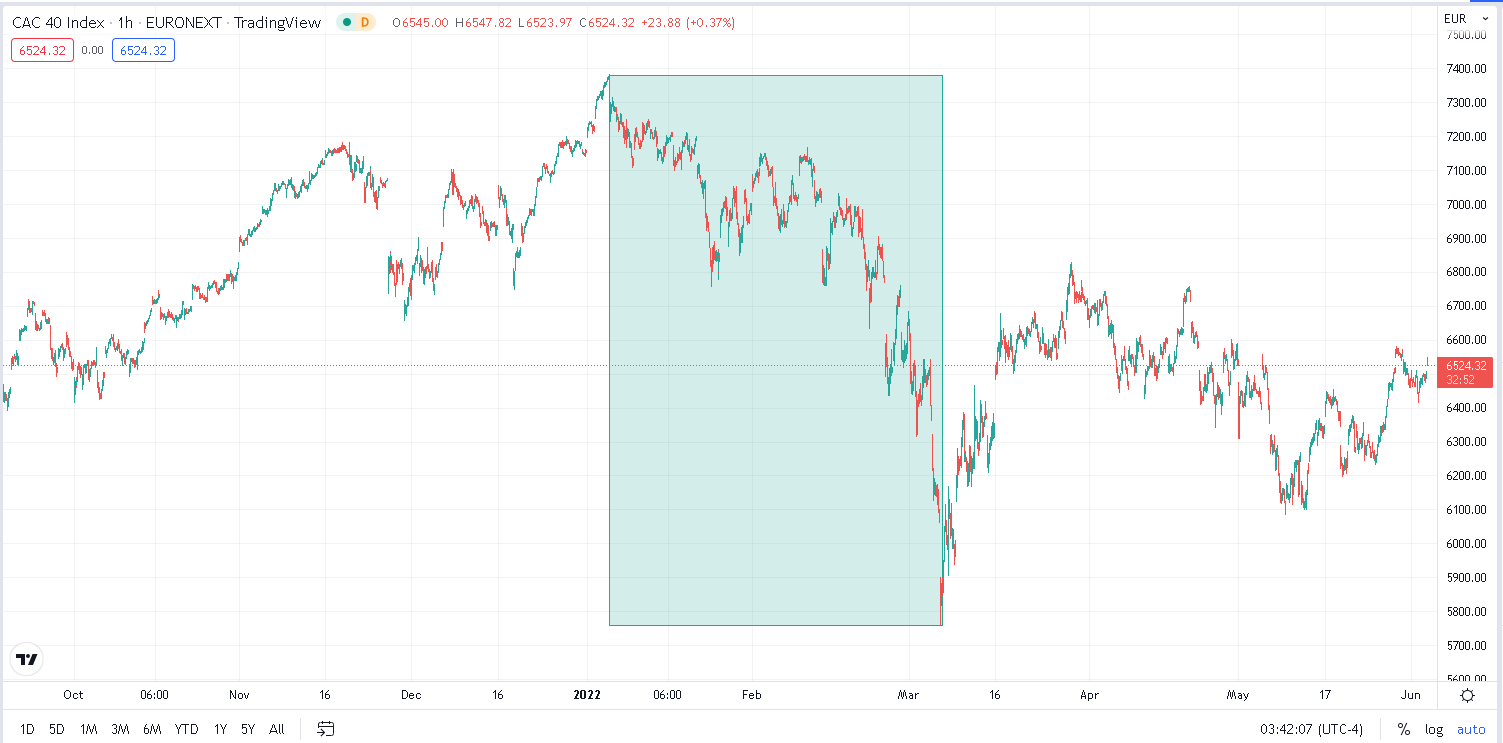
The picture for European equities is slightly different than the one seen in the NDX with what looks like a large liquidation move lower shown in green below on the French CAC and sideways trading afterwards following the bounce. |
Source: Tradingview.com |
We have discussed on multiple occasions the resilience shown by European Equities after the initial liquidation took place in March on the back of the Ukraine/Russia war. |
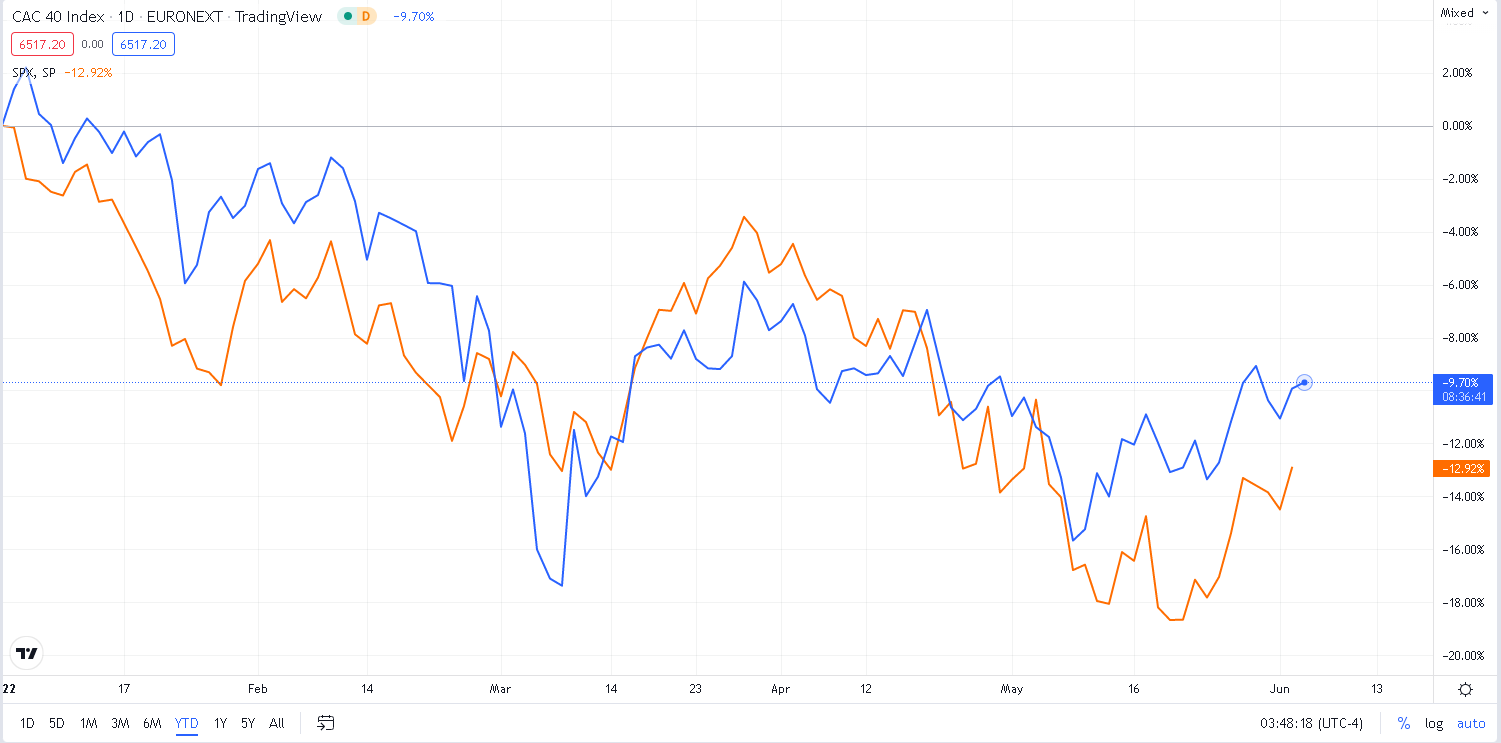
The below chart compares the performance of the French CAC in blue and the SPX in orange. Different phases throughout the year are quite visible with European equities outperforming their American counterparts until the end of February. When the war broke out, the situation inverted rapidly and lasted until the equity market started to focus on inflation and rate hikes by the FED. Since then, European equities have managed to hold better than US indices although this outperformance has shrunk recently. |
Source: Tradingview.com |
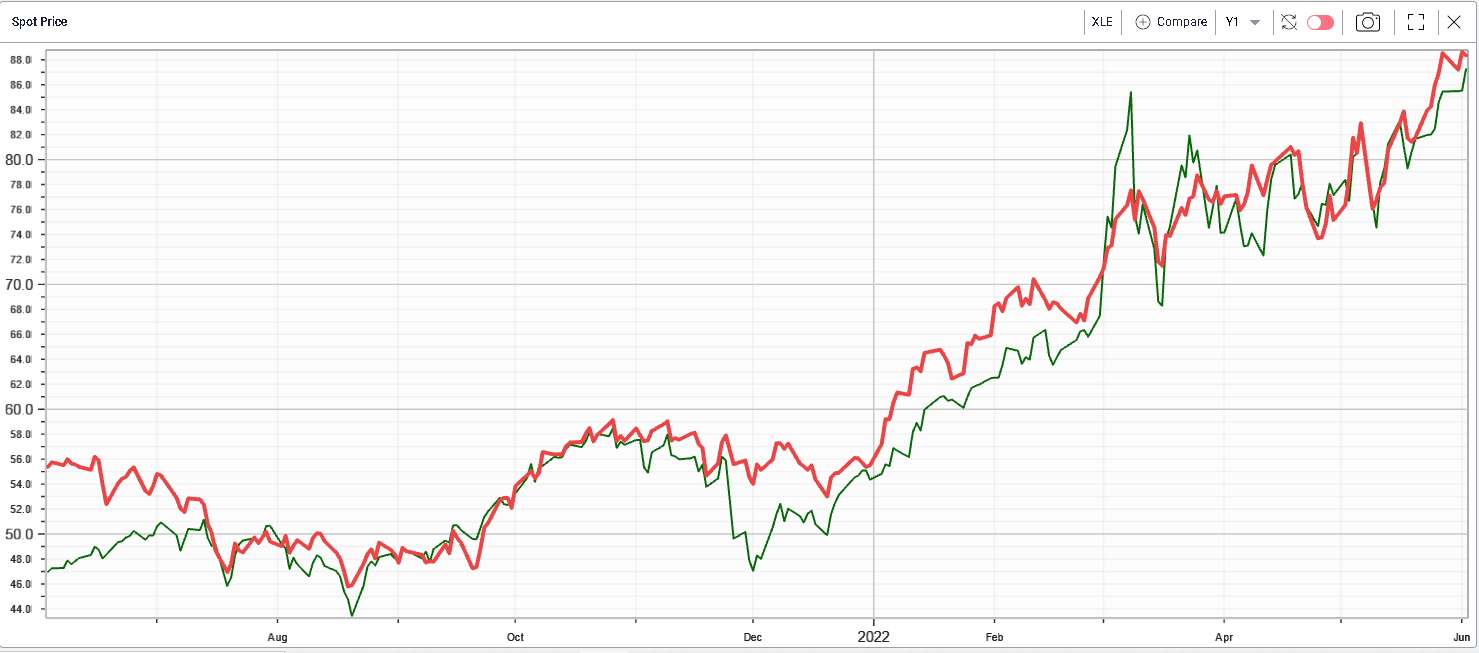
Coming back to yesterday’s session, all sectors except for the Energy space were in the green. Energy has been very correlated with the price of Oil in 2022 but had recently started to push higher as headline indices bounced. The gap between the two metrics is now almost closed and both are seemingly back in line. The XLE closed 0.3% lower on the day. |
|
The best performing sector yesterday was Consumer Discretionary which settled more than 3% in the green helped by both TSLA and AMZN which gained respectively 4.7% and 3.15%. |
Materials also did fairly well yesterday and gained 2.76%. All stocks were pretty strong in the sector which is generally considered to be slightly more defensive. Finally, it comes to very little surprise considering the performance of the NDX that the Communications and Technology segments performed well gaining around 2.4% on the day. |
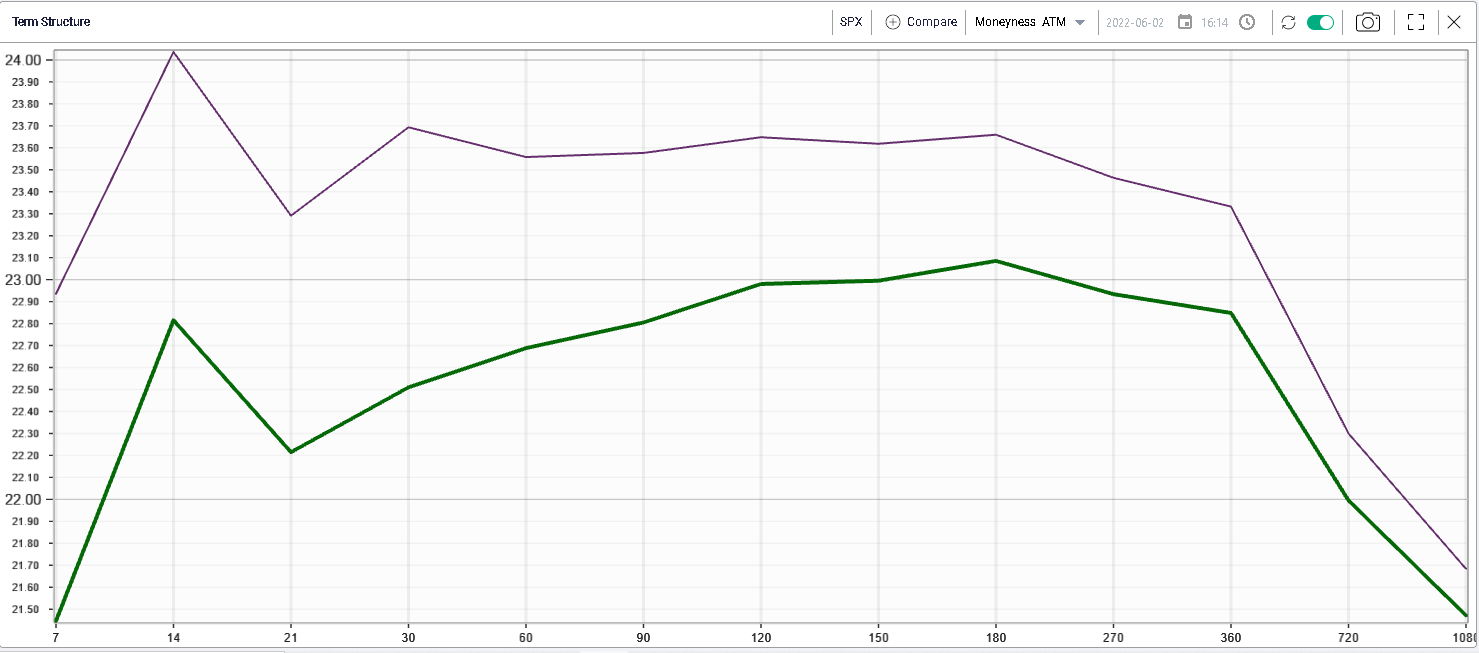
At the money Implied volatilities remarked lower yesterday led by short dated buckets with the 30d IVX dropping almost 2 points on the day to a closing value of 22.5. |
|
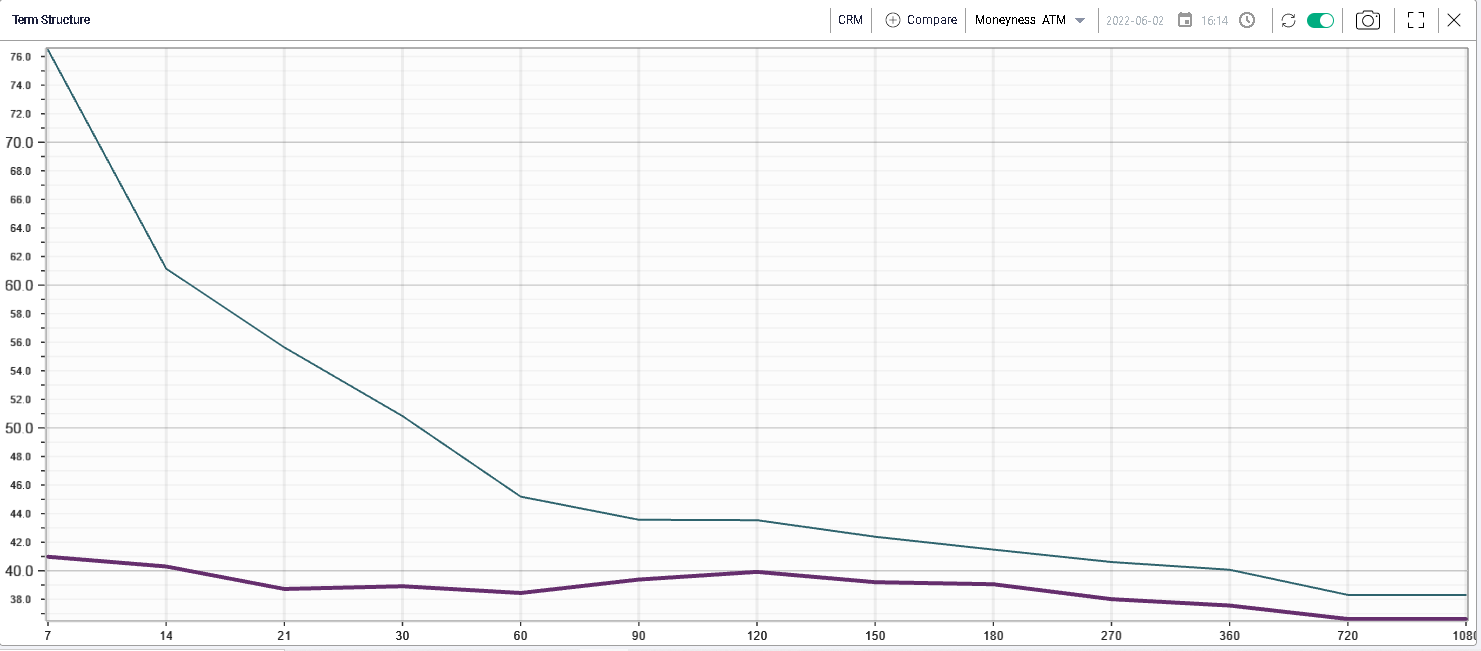
Within the DJIA, CRM continued its bounce and the stock gained 7% during Thursday’s session. Over the past 5 trading sessions, Sales Force has rallied almost 20% and its implied volatility has dropped significantly as shown on the below term structure comparison chart showing the CRM term structure as of yesterday’s close compared with Friday 27th May’22’s close. |
|
30d IVX for instance has dropped more than 12 points over the space of a week. |
BA also had a good day gaining almost 8%. The third spot was for NKE which settled almost 4% higher on the day. On the downside, only two of the 30 components of the DJIA closed lower. AMGN lost around 2% and MRK dropped 1.3%. Both names have performed strongly on the year and this could be a sign that some traders continue to add risk to their portfolio by removing the more defensives stocks such as Healthcare names and adding companies that have struggled in 2022. |
Disclaimer - This information is provided for general information and marketing purposes only. The content of the presentation does not constitute investment advice or a recommendation. IVolatility.com and its partners do not guarantee that this information is error free. The data shown in this presentation are not necessarily real time data. IVolatility.com and its partners will not be liable for any loss or damage, including without limitation, any loss of profit, which may arise directly or indirectly from the use or reliance on the information. When trading, you should consider whether you can afford to take the high risk of losing your money. You should not make decisions that are only based on the information provided in this video. Please be aware that information and research based on historical data or performance do not guarantee future performance or results. Past performance is not necessarily indicative of future results, and any person acting on this information does so entirely at their own risk. |