Was Friday just about hedging yourself? |
US indices failed and dropped following the better-than-expected payroll numbers on Friday. The NDX lost 2.7%, the SPX 1.6% and the DJIA dropped 1%. |
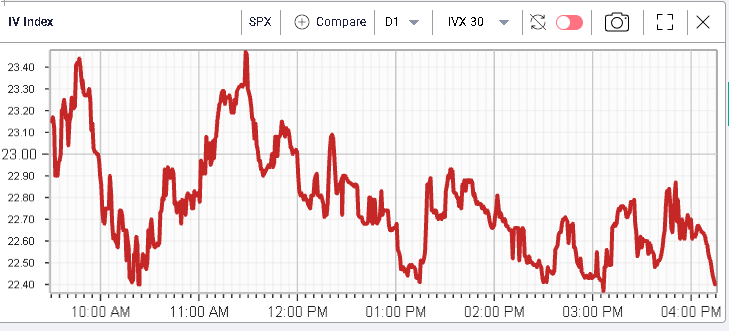
Despite this slight correction in spot prices, implied volatilities barely reacted on the day with 30d IVX finishing slightly lower as shown on the below chart. |
|
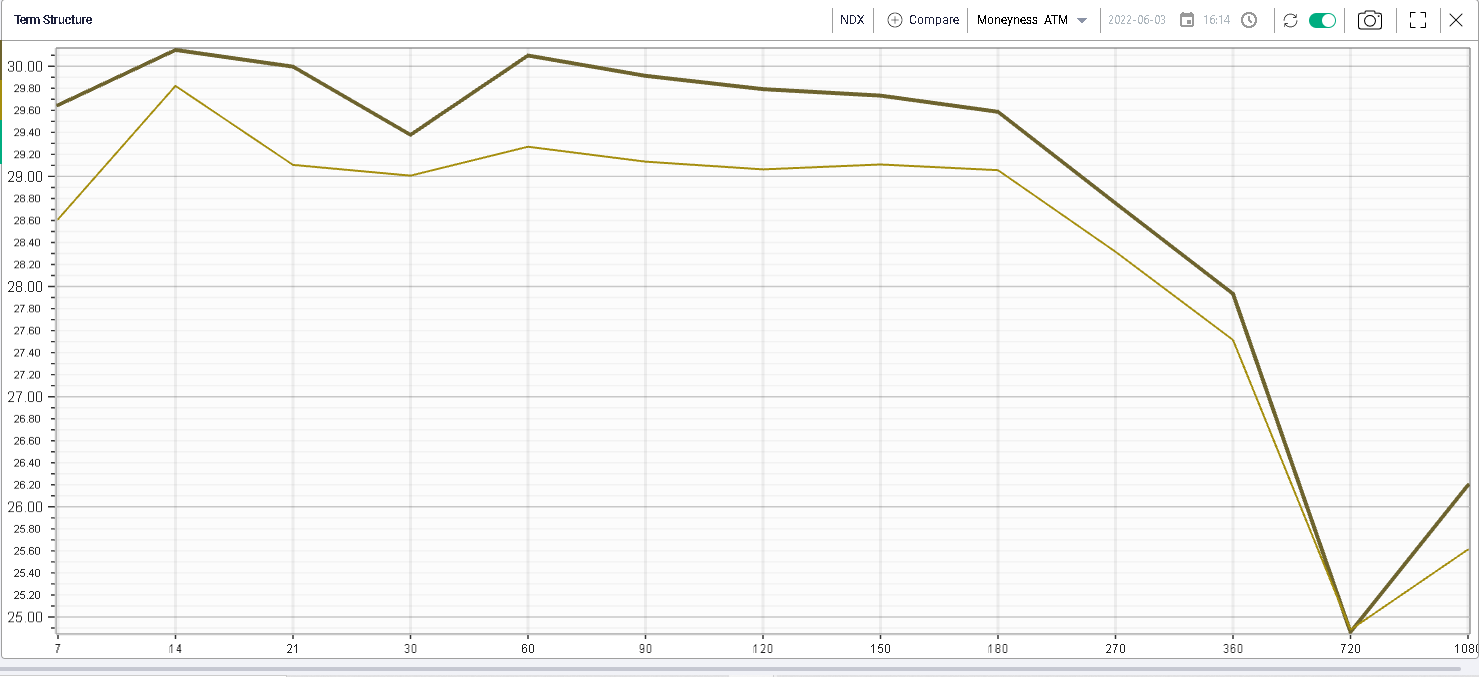
Even for the NDX which sold off most aggressively, the remark in implied volatility was muted with the bold line below showing the term structure as of Friday’s close compared with the close on Thursday. |
|
30d IVX gained 0.4% and 90d IVX gained 0.8% a fairly modest remark considering the amount of realized volatility we are still seeing in the market at the moment with an intraday high/low range of more than 3% over the day for the NDX. |
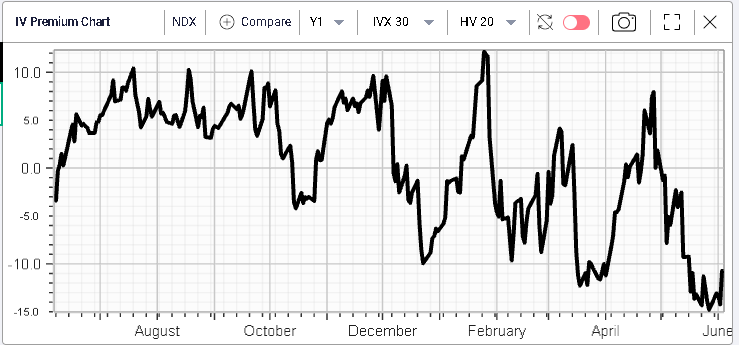
For now, the IV Premium for the NDX remains at historically depressed levels of around -10 points as seen on the below chart. |
|
Looking at the flow on Friday, most of the action for US indices happened on short dated downside puts with some decent trading happening on very low premium puts with short dated maturities. |
For instance, the 8th Jun’22 3400 puts on the SPX traded more than 11k as did the 14th Jun’22 3400 puts on the SPX. Outside of those far out of the money strikes, some action was witnessed on the regular Jun’22 4100 puts and 4100 calls with respectively 9k and 7.8k trading. The regular Jun’22 4200 calls traded 7.5k as well. |
Looking at the NDX it felt like some protection was being bought by traders on Friday with a total of around $3bln notional trading on the four following strikes: |
|
We highlighted in a previous market update that there was an argument even for bullish traders to start considering hedges for their positions via puts as implied volatility significantly underperformed realized volatility recently. Those options are obviously very short dated and will only provide some hedging over the next few days. |
In the same logic, long dated puts in the NDX traded on Friday. This is quite interesting as the interest for such options is generally fairly low. It looks like an investor bought $170mln of the Dec’23 9500 puts and $170mln of the Dec’23 7300 puts. |
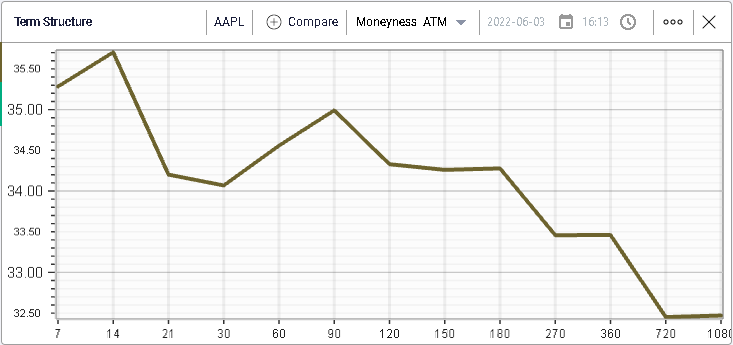
Within the DJIA, AAPL was the worst performer on the day losing almost 4%. This underperformance is quite interesting going into next week’s WWDC where traders seem to have fairly high expectations for what might be announced by the firm as reflected into the term structure. |
|
Coincidentally most of the flow in AAPL last Friday focused on short dated options with the following sizes trading: |
|
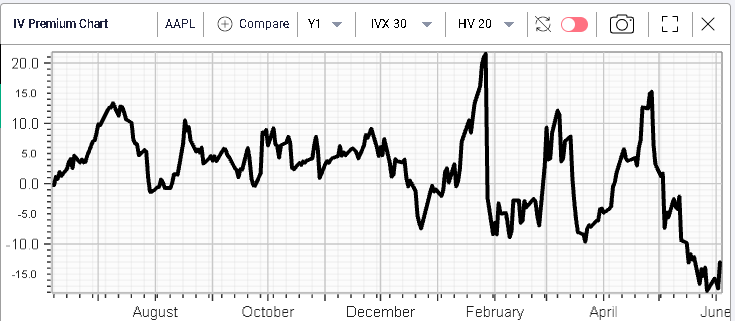
Looking at implied volatility in AAPL, it was fairly weak on Friday finishing only marginally higher on the day. The IV Premium picture for AAPL is similar to that of the NDX with a 30d IVX trading around 13 points below its 20 days realized volatility. |
|
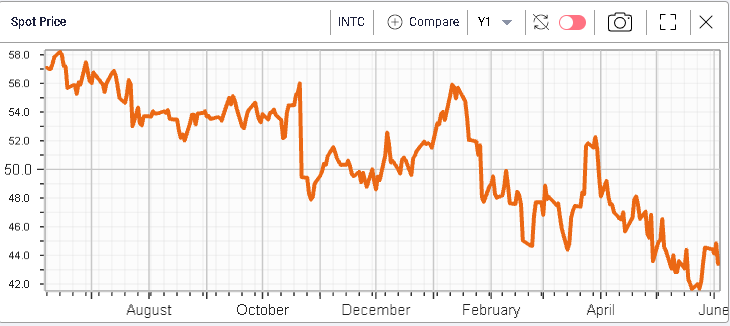
Intel was another Tech name that struggled on Friday losing around 3.2% on the day. The stock is down around 19% on the year at this point. |
|
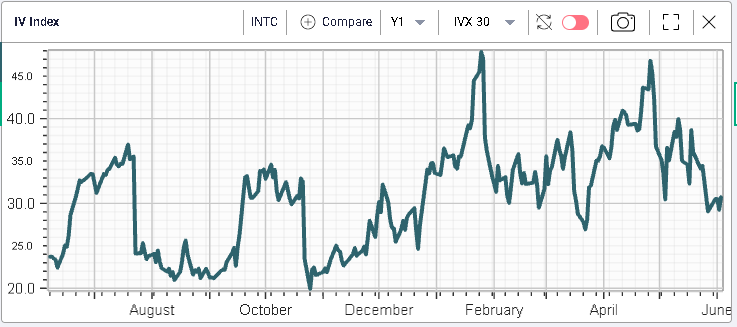
Despite the resumption of the selling pressure on Friday, 30d IVX in the name barely reacted and closed up only marginally as show on the below 12 months chart of 30d IVX. |
|
Flows in the name focused on downside puts with the 10th Jun 43 puts trading 6.3k. The 10th Jun 44 puts traded a further 3.5k on the day. Further out, 1st July’22 40 puts and 20th Jan’23 35 puts traded respectively 3.7k and 3.8k. |
Overall, it felt like Friday saw a combination of profit taking following a set of numbers that may have surprised the market as being slightly better than generally anticipated. Looking at options activity, it seems that some traders took this opportunity to start hedging their positions again but that, at least for now, the volatility market failed to send any warning signal that it was getting worried about this new bout of selling. |
Disclaimer - This information is provided for general information and marketing purposes only. The content of the presentation does not constitute investment advice or a recommendation. IVolatility.com and its partners do not guarantee that this information is error free. The data shown in this presentation are not necessarily real time data. IVolatility.com and its partners will not be liable for any loss or damage, including without limitation, any loss of profit, which may arise directly or indirectly from the use or reliance on the information. When trading, you should consider whether you can afford to take the high risk of losing your money. You should not make decisions that are only based on the information provided in this video. Please be aware that information and research based on historical data or performance do not guarantee future performance or results. Past performance is not necessarily indicative of future results, and any person acting on this information does so entirely at their own risk. |