Time to look at China? |
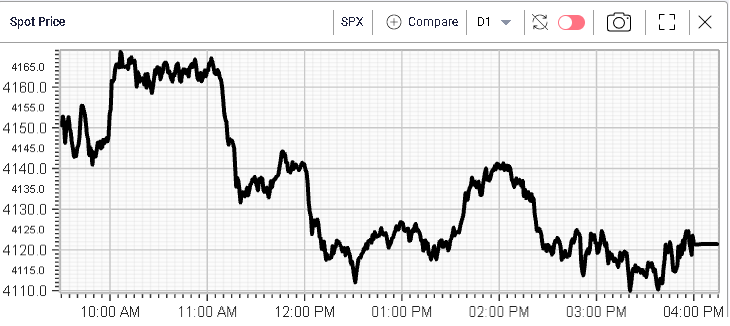
A quiet session for all major US indices yesterday. We opened around 40 points higher than where we closed on Friday and tried to push higher but faced resistance as we approached the 4160-4165 area on cash SPX. |
|
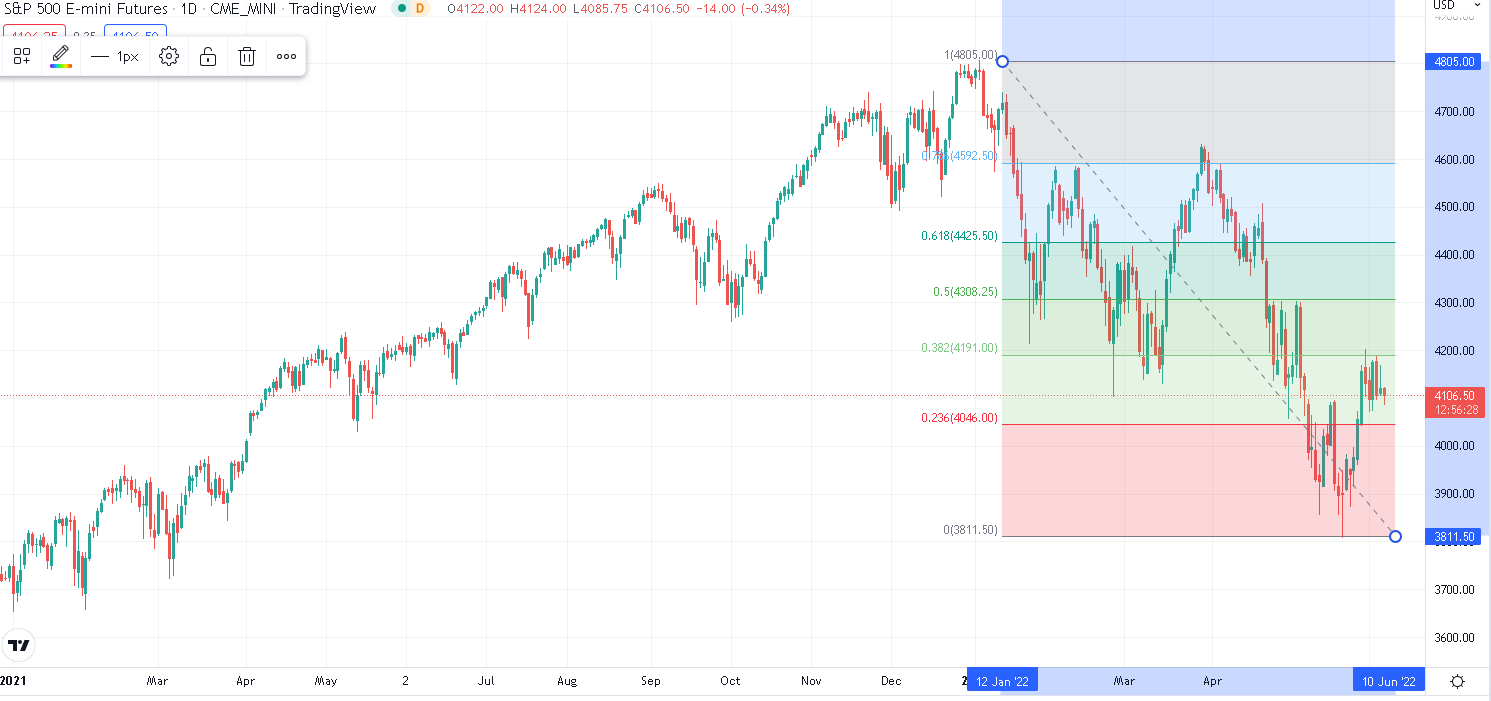
Looking at Futures, E-Minis has so far in the bounce stalled around 4190 which is the 38.2% Fibonacci retracement of the high-low range in 2022. |
Source: Tradingview.com |
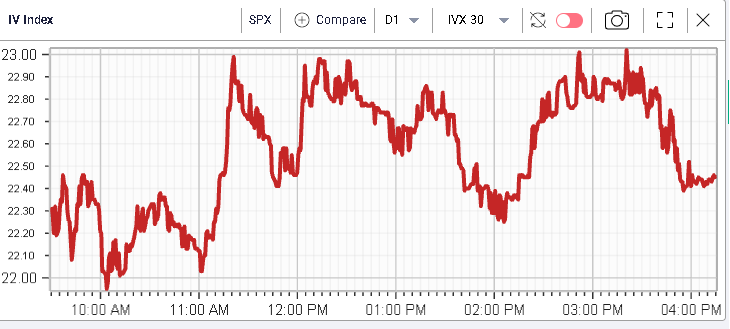
Implied volatility reacted fairly rapidly as the selloff was taking place but the rise quickly stopped as the move stalled on the downside as the SPX approached 4100. 30d IVX settled 0.25% higher on the session and could not get past the 23 level. |
|
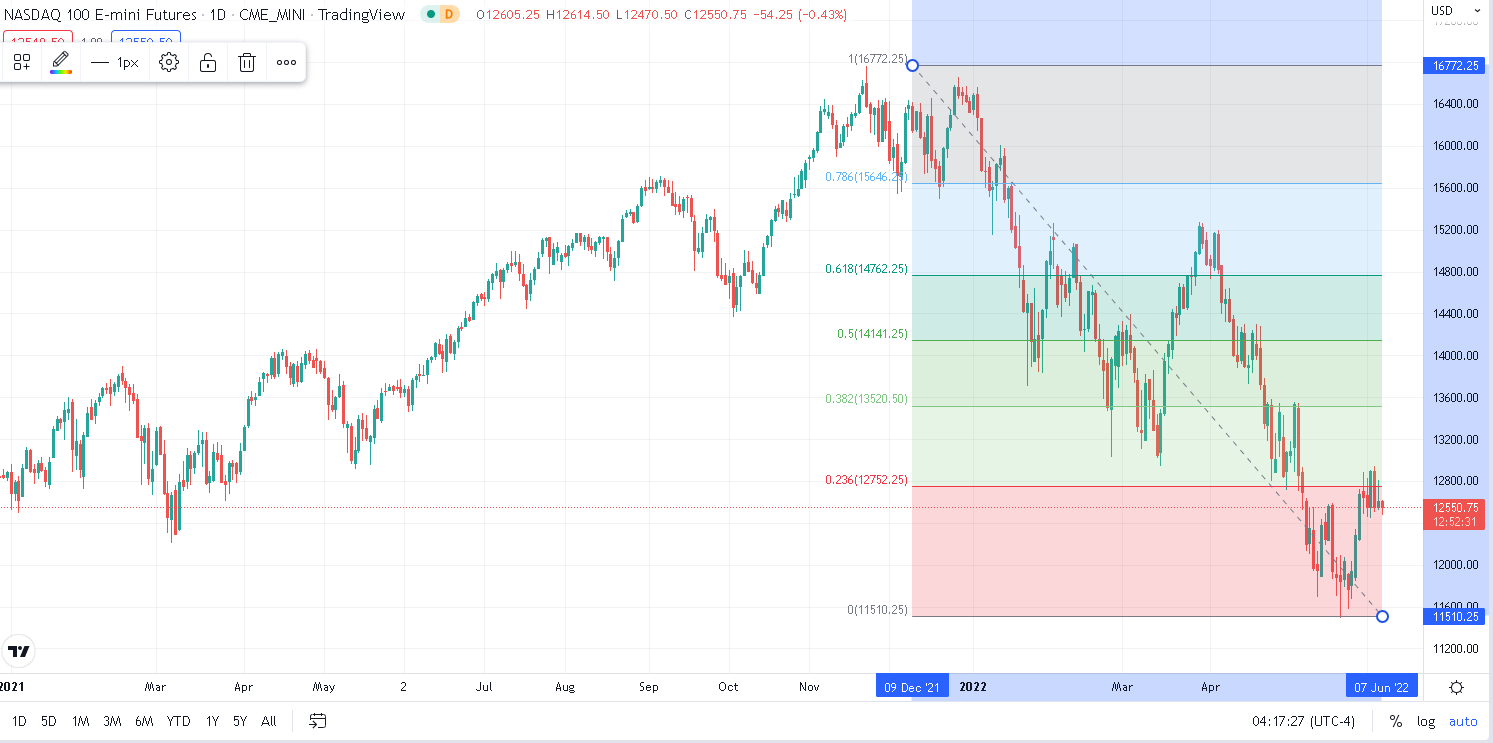
In the NDX, the situation is fairly similar with a move higher of around 0.4% on the day but the index has only managed to reach the 23.6% retracement over the recent bounce and bears have so far been able to keep NQ under 12750. |
Source: Tradingview.com |
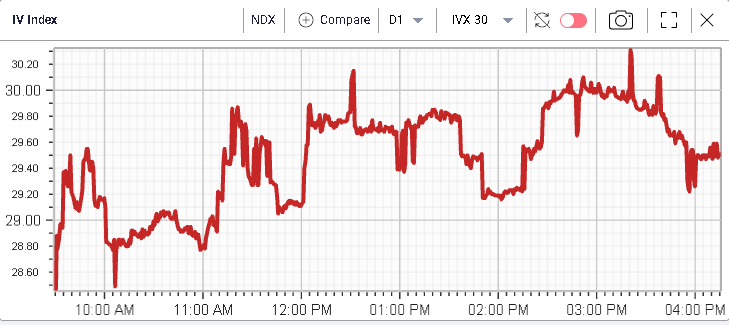
Implied volatility in the NDX opened lower vs Friday’s close but drifted higher throughout Monday’s session. |
|
Looking at the DJIA components, no stock moved more than 1.6% on the day (either up or down), a sign that the market pretty much paused yesterday. At a sector level, nothing spectacular to report either. Consumer Discretionary stocks continued to perform well closing around 1% higher on the day while Energy consolidated and lost 0.15%. |
In the short term, Chinese stocks seemed to remain very much in focus with high expectations that a decent move in either direction might happen over the next few days. |
|
With Didi closing 24.3% higher on the day and with an intraday high of +65%, the market has started to price the possibility that the regulatory environment may get easier in China. |
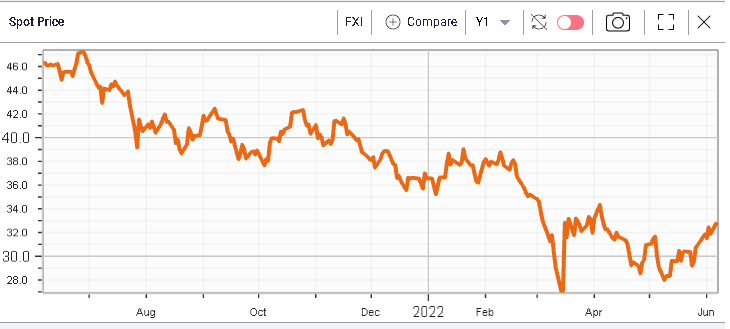
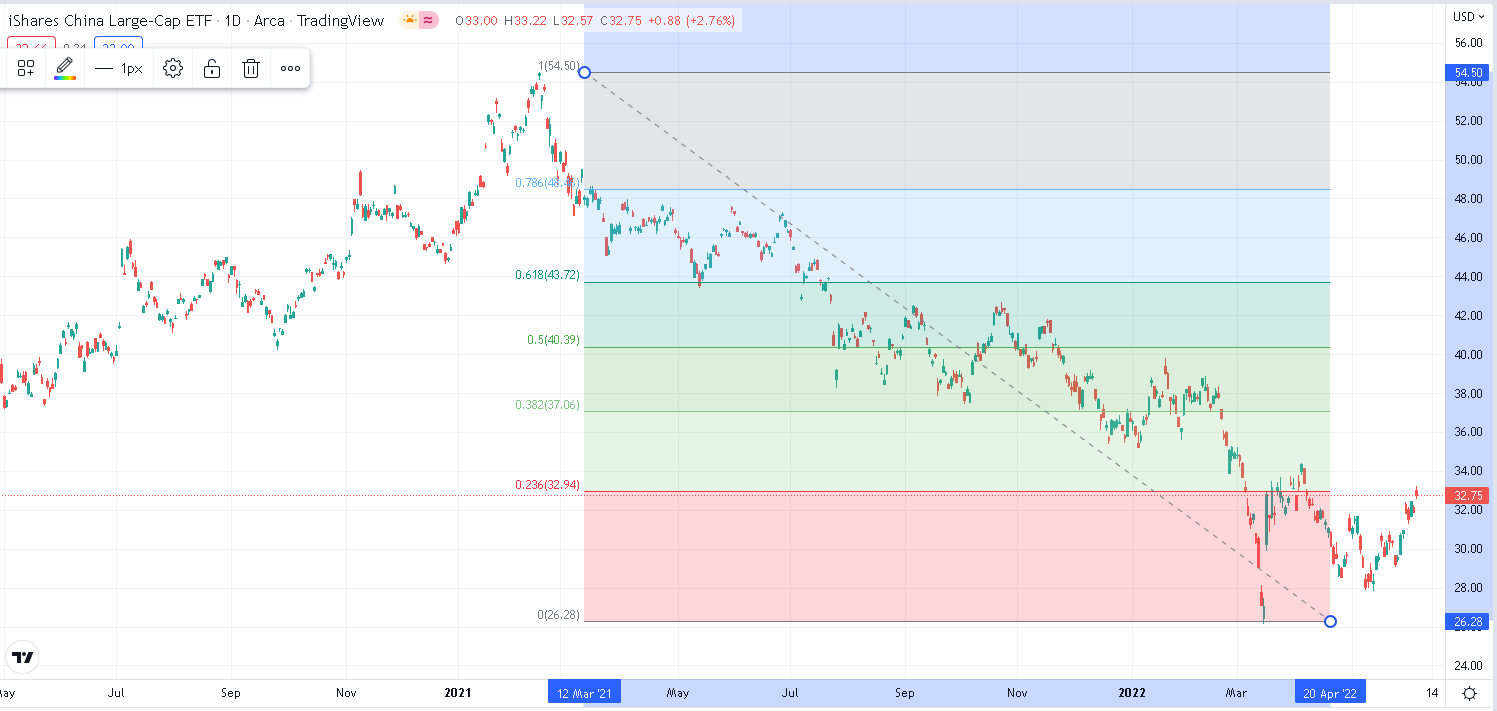
The FXI, an ETF of large cap Chinese companies gained 2.76% yesterday and continued to push higher as shown on the below 12 months chart. |
|
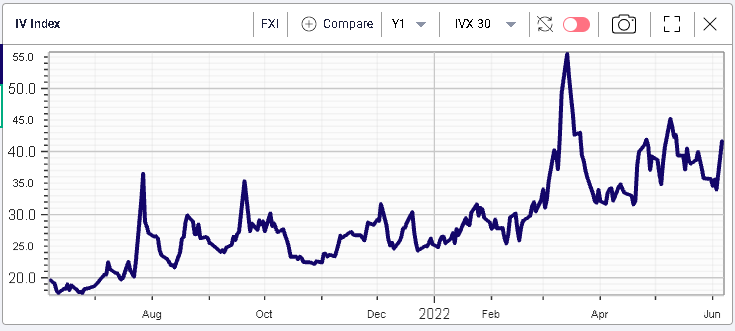
At the same time, implied volatility has remained very supported and has even moved higher over the past few sessions. |
|
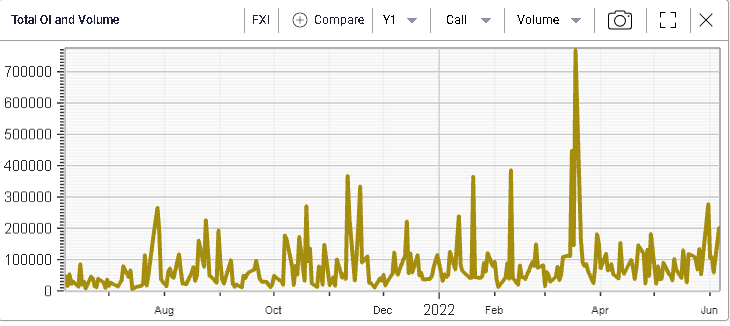
The volume of calls traded on FXI has also increased slightly although it remains far lower than what was seen in March when Chinese assets were hit by a wave of liquidation. |
|
Top to bottom, FXI lost 52% from Mar’21 to Mar’22 and has now retraced around 23.6% of that selloff. |
|
This leaves the market close enough to its recent lows that traders would have to remain cautious while raising the possibility of a significant move on the upside should traders get comfortable with the situation in Chinese equities once again. |
This dichotomy makes it harder to hold the stocks directly and options are probably seen as one of the safer ways to express a view in Chinese equities at the moment. |
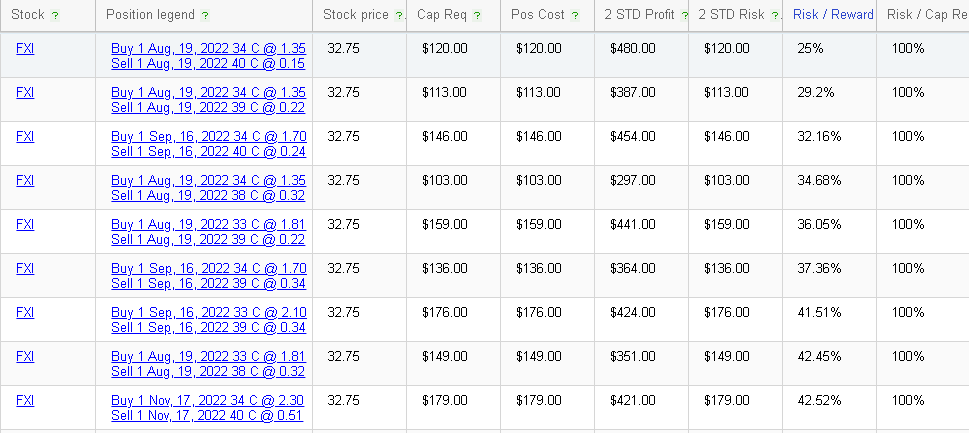
Using the RT Spread Scanner, we can scan for structures that would let us gain exposure while controlling our overall risk taken. A bull vertical spread is one of the most popular approaches to trading options directionally while limiting the overall risk taken. It consists in simultaneously buying and selling calls of the same expiration but with different strikes. Buying the lower strike is a bullish strategy, selling it a bearish one. |
The table below is the result of such a search on FXI: |
|
The first result is the 19th Aug’22 34/40 Bull vertical spread (buying the Aug $34 calls and selling the Aug $40 calls) which costs $120 net. This represents the maximum loss that a trader who would own this strategy could lose (outside of commissions and transaction costs) while the potential net profit would be $480. |
This gives a Risk / Reward ratio of 25%, in other words, for each 25c of risk the trade is willing to take, the potential gain is $1. |
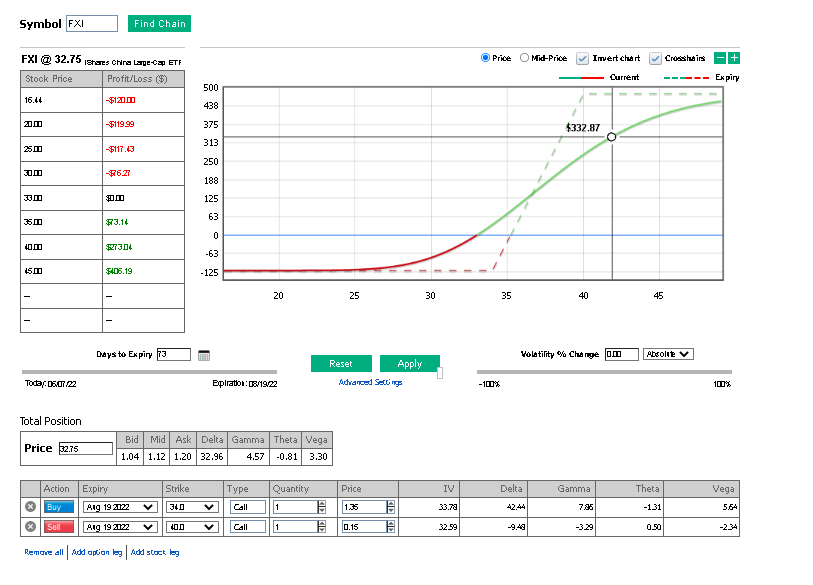
The PNL Calculator helps us find the overall payoff of the structure and test for different scenarios. |
|
Looking at the top right chart, the dotted lines show our profit and loss payoff at expiration while the continuous line shows the instantaneous payout. We can see that as spot moves higher, we stand to make a profit and as spot goes lower, we stand to make a loss. We can also see that if the spot price moves significantly up or down then the profit or loss would automatically stabilize. A bull vertical spread has a payout at expiration that resembles that of a long stock position with a stop-loss and a take-profit embedded which explains why it is so popular. |
The top left chart as well as the sliders let us simulate our potential loss/gain depending on various market scenarios and help us better prepare for what might happen during the life of the trade. |
Disclaimer - This information is provided for general information and marketing purposes only. The content of the presentation does not constitute investment advice or a recommendation. IVolatility.com and its partners do not guarantee that this information is error free. The data shown in this presentation are not necessarily real time data. IVolatility.com and its partners will not be liable for any loss or damage, including without limitation, any loss of profit, which may arise directly or indirectly from the use or reliance on the information. When trading, you should consider whether you can afford to take the high risk of losing your money. You should not make decisions that are only based on the information provided in this video. Please be aware that information and research based on historical data or performance do not guarantee future performance or results. Past performance is not necessarily indicative of future results, and any person acting on this information does so entirely at their own risk. |