China, Intel and Nike |
We will start today’s market update by talking about Chinese equities which have continued to push higher yesterday. We discussed on the 7th (https://www.ivolatility.com/news.j/Market%20Update%20-%20Time%20to%20look%20at%20China?nid=2525) the themes that were driving Chinese equities’ bounce. |
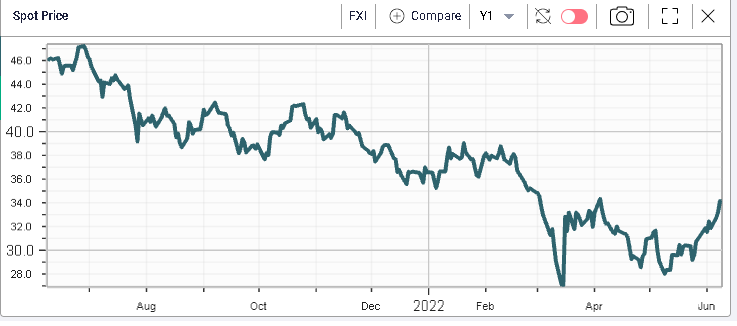
FXI, an ETF of Chinese large caps gained 2.74% yesterday and is up 22% over the past month. Despite this impressive rally it is still trading 26% lower than a year ago. |
|
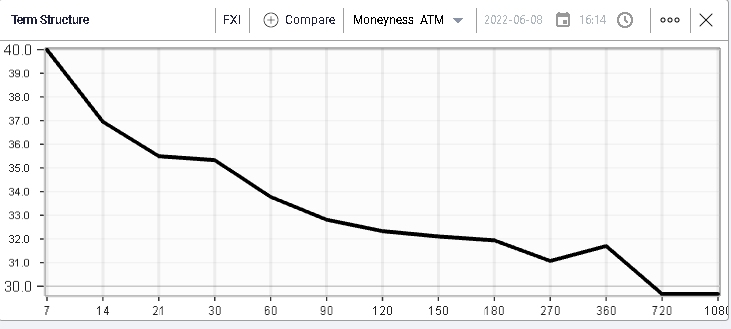
The volatility market is showing almost no sign of cooling down and short dated options continue to trade at a premium to longer dated ones. |
|
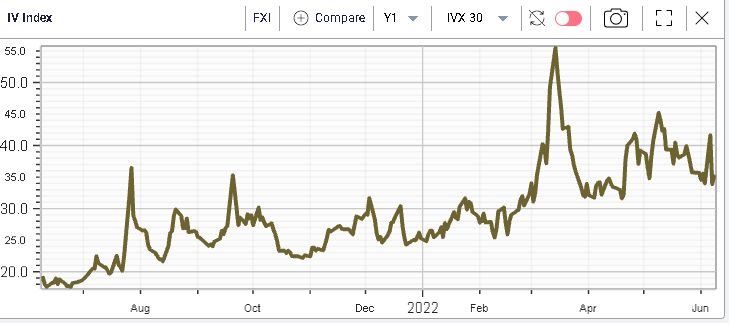
This gives a situation where, despite the rally in spot that we have just witnessed, implied volatilities remain very steady and have failed to remark significantly lower for now. |
|
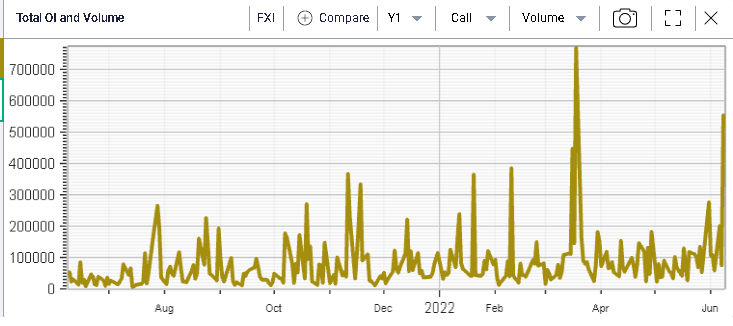
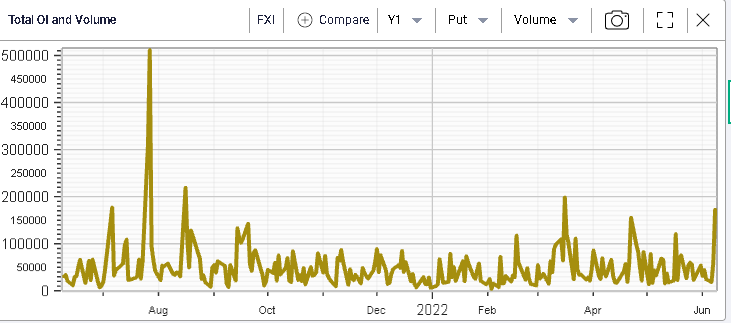
All this is being fueled by a significant increase in call activity with the second largest print off the last 12 months happening yesterday. |
|
Puts are also trading but to a lesser extent as shown on the below chart. |
|
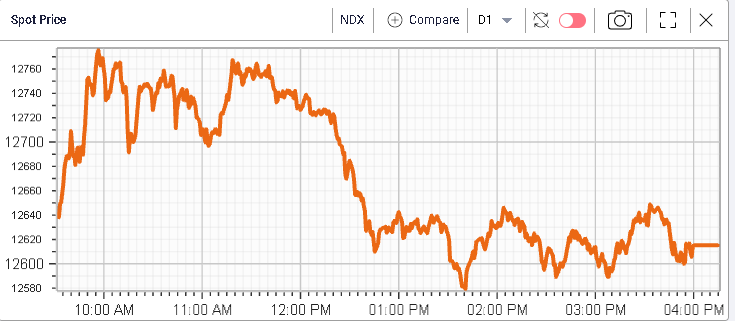
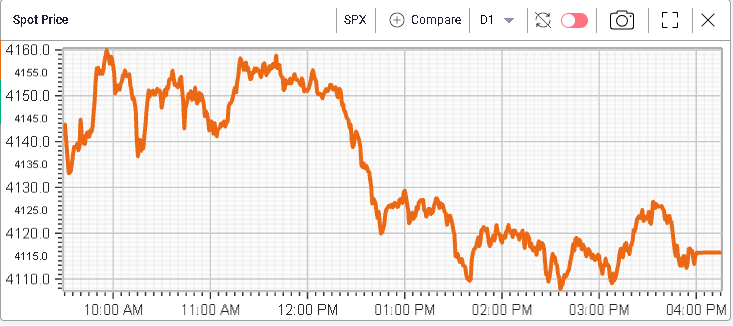
Back in the US, headline indices lost a little bit of ground but managed to preserve some supports, specifically 4100 on the SPX and 12600 on the NDX. |
|
|
The intraday range for the NDX was fairly smaller than over the past 2 weeks with an intraday high/low range of around 1.6%. In the SPX, the intraday range was set at 1.3%. |
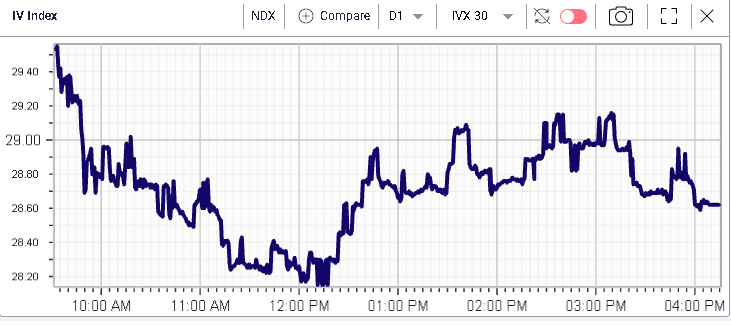
With those limited moves, it is not entirely surprising that the implied volatility for both indices remained under pressure as shown below. |
|
|
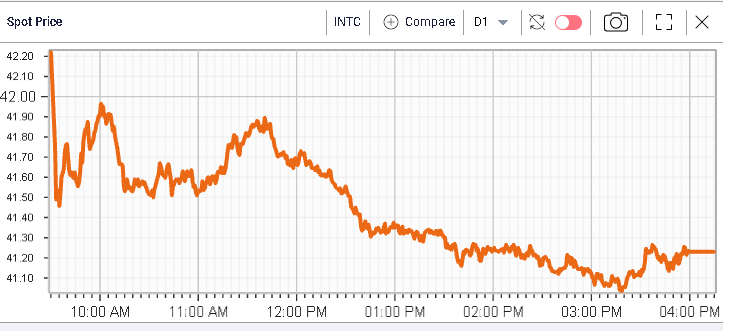
Looking at the DJIA components, Intel felt like the outlier on the day closing more than 5% in the red during Wednesday’s session driven by broker reports indicating a possible loss of earnings momentum and a miss of guidance for the company on the back of recent management commentary. |
It was interesting to see that the stock did not gap lower on the headline but rather sold off throughout the session, a possible sign that people were unwinding their exposures throughout the day. |
|
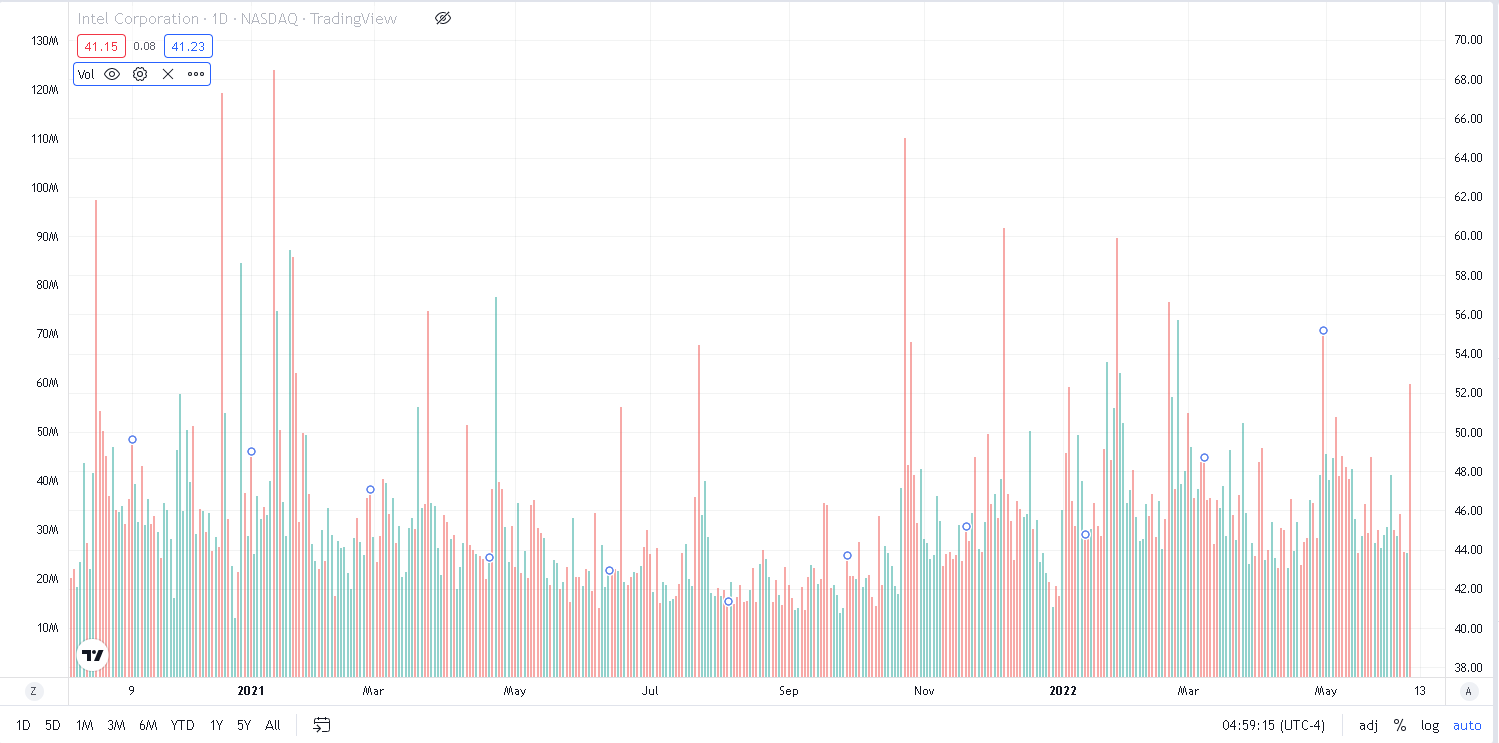
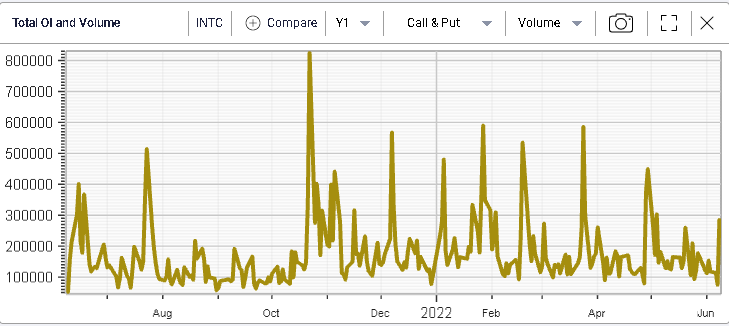
Looking at volumes, they were decent compared to the most recent history but far from the highs seen over the past 12 months. |
Source: Tradingview.com |
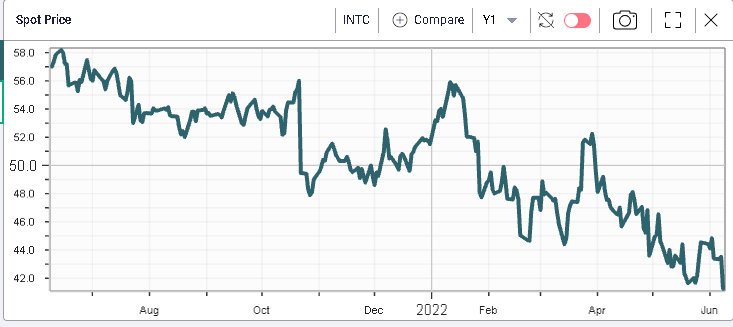
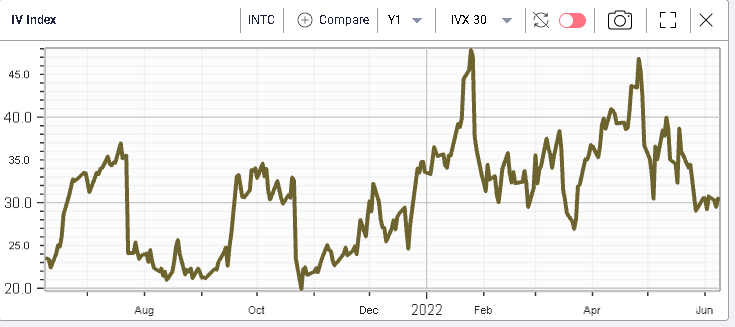
As a reminder, INTC has lost a fair amount of ground in 2022 already losing around 22.5% since the end of 2021. The stock is now back to its 52 weeks lows as shown on the below chart. |
|
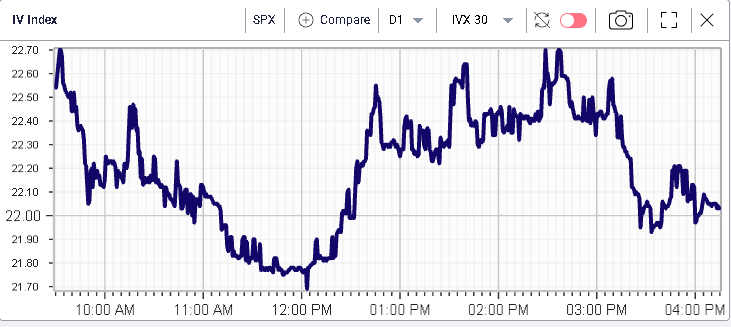
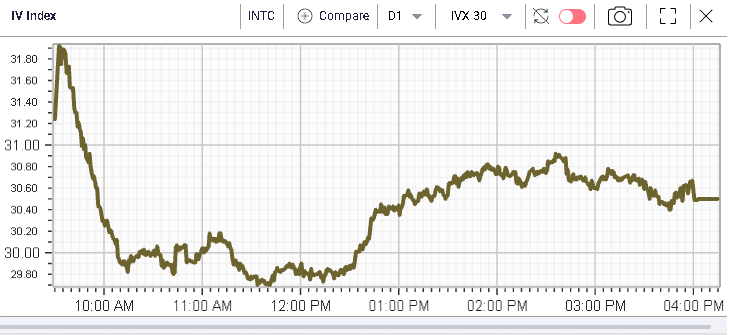
Despite this, implied volatility has remained fairly subdued. Unlike in prior selloffs when market makers quickly pushed IV above 45%, the 30d IVX has hovered around the 30% mark over the past few sessions and failed to move meaningfully on Wednesday opening slightly higher and then drifting down throughout the rest of the day. |
|
|
The option activity spiked slightly but remained slow overall compared to some of the more active sessions seen over the past year. |
|
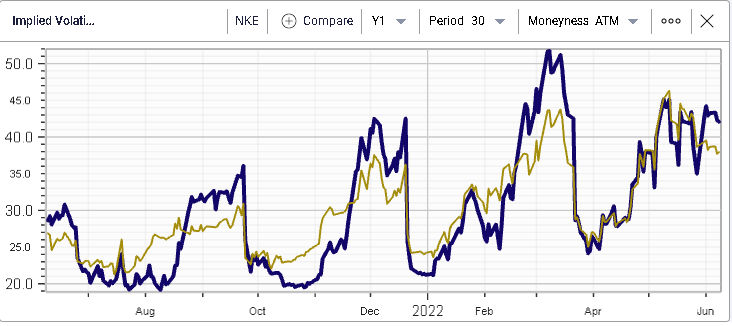
Within the DJIA, there is one name where the market seems to be expecting a large move in the short run. The stock is NKE and we can see on the below chart how the 30d implied volatility and the 60d implied volatility have started to diverge with 30d IVX holding far better than 60d. |
|
This is generally a sign that the market is getting more and more concerned about a possible move in the short term. In this case, it is most likely related to the upcoming earnings in the stock that are due to be released on the 27th Jun’22. |
We have discussed the situation in this name on multiple occasions in market updates and it is clear that with a year-to-date performance of around 26%, traders are growing impatient about an update from management about the financial situation of the company and the guidance for future earnings. |
Disclaimer - This information is provided for general information and marketing purposes only. The content of the presentation does not constitute investment advice or a recommendation. IVolatility.com and its partners do not guarantee that this information is error free. The data shown in this presentation are not necessarily real time data. IVolatility.com and its partners will not be liable for any loss or damage, including without limitation, any loss of profit, which may arise directly or indirectly from the use or reliance on the information. When trading, you should consider whether you can afford to take the high risk of losing your money. You should not make decisions that are only based on the information provided in this video. Please be aware that information and research based on historical data or performance do not guarantee future performance or results. Past performance is not necessarily indicative of future results, and any person acting on this information does so entirely at their own risk. |