Technical Monday, the selloff in context! |
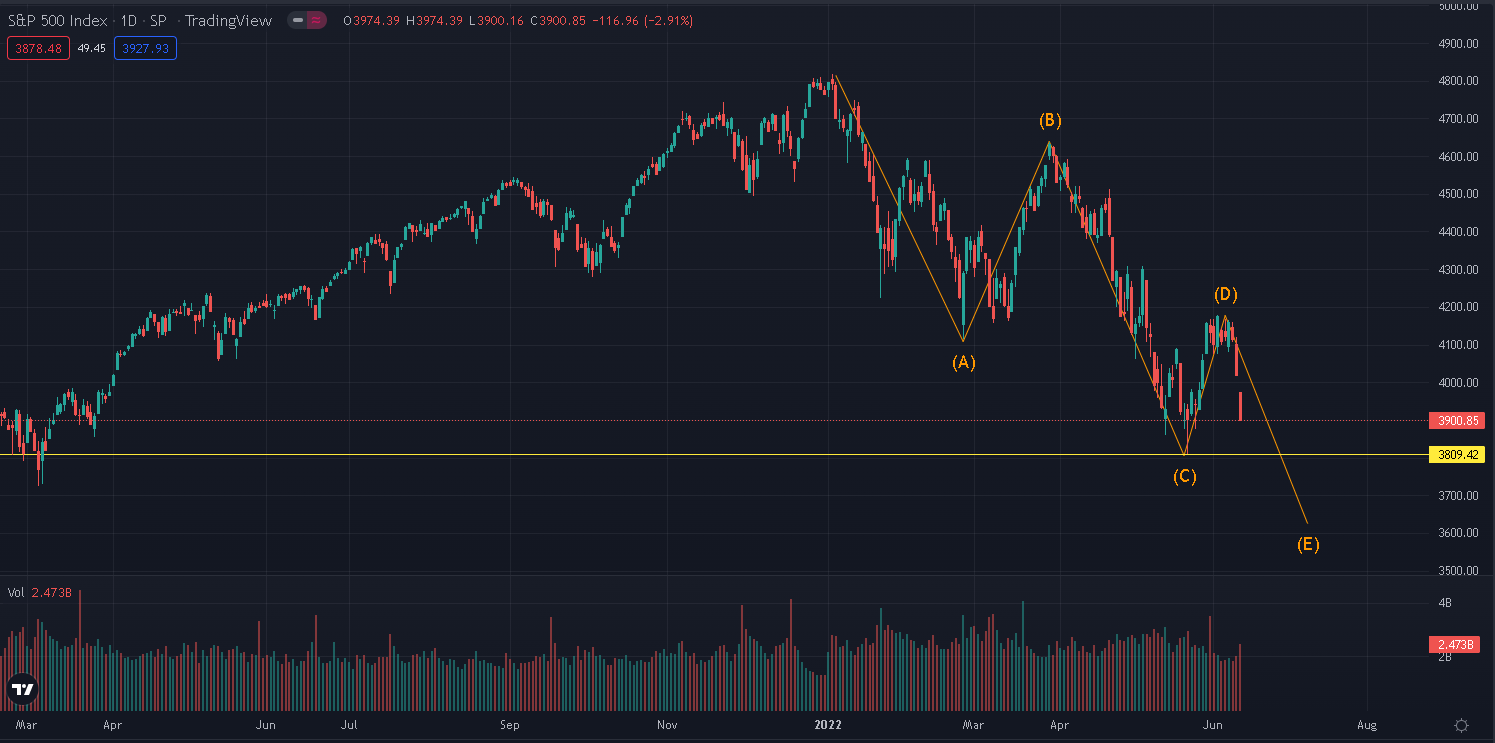
Friday saw the continuation of the move lower that started Thursday with the SPX losing 200 points in two sessions. Looking at the price action from the 4800 highs on the SPX, it looks like we have witnessed 3 complete waves and we could be in the process of transitioning from wave 4 to wave 5. |
The first wave denoted with A on the below chart started in January 2022 and finished around the end of February as US stocks bounced back from the lows reached on the announcement of the invasion of Ukraine by Russia. The second wave saw the SPX bounce back to 4600 as the conflict did not expand as fast as originally feared and the impact on commodities started to shrink from the second week of March 2022. |
The third wave resulted in the most aggressive move so far with a drop of around 800 points as it became evident that the FED was behind the curve on inflation and would be forced to be more proactive in fixing that single issue. The fourth wave came in the form of a relief rally as yields sort of stabilized and even compressed slightly. |
Source: Tradingview.com |
It is probably too early to say if we have now entered into the fifth wave as a breach of the lows reached in the third wave would be necessary. This is why 3800 will be very important if the market decides to test it. A move lower would act as a typical confidence shock with bulls under pressure and bears more likely to feel vindicated and to add to their shorts. |
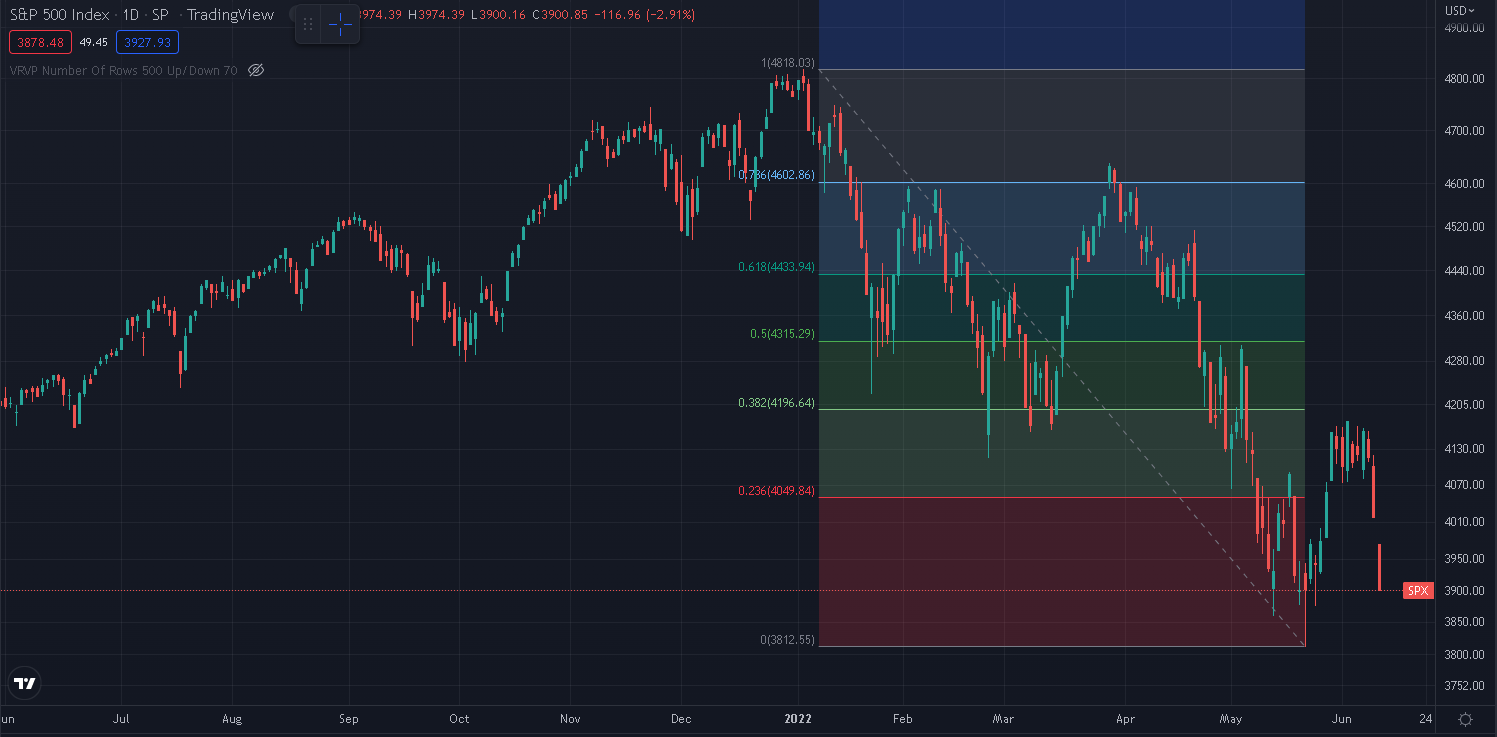
With the bounce being capped around 4160-4175, bulls were probably surprised that the market failed to test the 38.2% resistance at 4195. The battle that took place from the 27th May’22 to the 8th Jun’22 was fought around the 4140 area and the resulting effect, a drop from 4150 to 3900 in the space of 3 sessions is a win for bears especially as the market gapped down on Friday morning, leaving a lot of longs under water and unable to recoup their losses. |
Source: Tradingview.com |
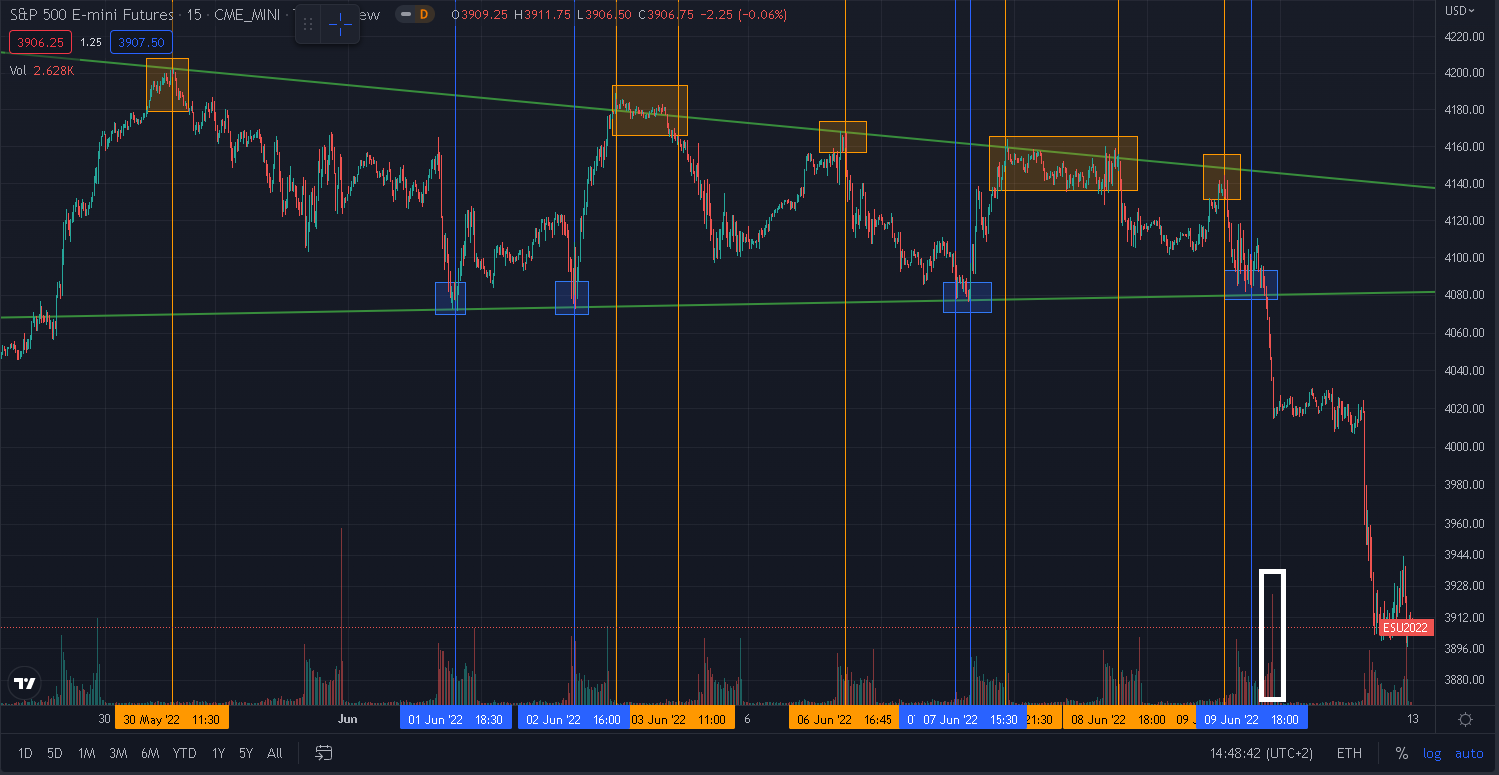
Looking at the below chart, we can see in blue that most of the attempts at the lower end of the 4080-4180 range were made during market hours. This is important because it means that bulls were forced to deploy a lot of capital in order to bring the market back higher and to defend their levels. If we look at the below chart, the phases following a bottom when bulls managed to gain ground on bears seem to coincide with high volume periods. On the other hand, the tops in the market were generally made outside of the regular session and on far lower volumes. That required far less commitment from bears in order to push prices lower. |
Source: Tradingview.com |
That type of scenario can then result in significant stops being left below the level of accumulation as bulls failed to unwind some of their positions at the top. Once the market broke lower on Thursday, this resulted in a liquidation of longs as evidenced by the large increase in volume. |
Considering the amplitude of the first two selling waves, respectively around 700 and 800 points, it is possible that a fifth wave, should it materialize would have a meaningful impact on the market. |
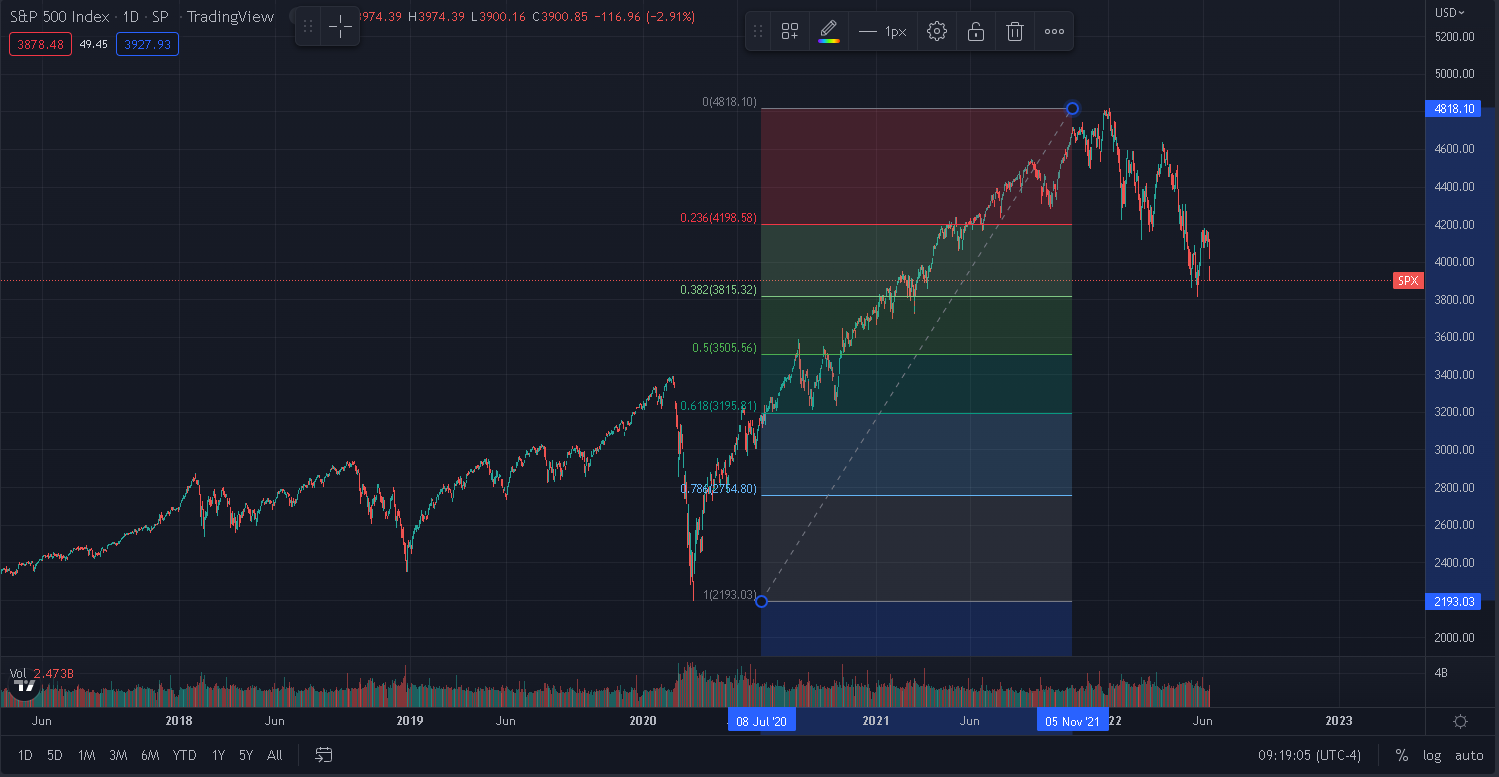
Looking at retracements of the move from Mar’20 to Jan’22, we can see that wave 1 stalled as we reached the first retracement at 23.6%. The second wave was halted as we achieved the 38.2% mark and this is why the 3800-3820 area remains very important. Should we break that area, traders will probably look to 3500 followed by 3200 as meaningful supports to potentially halt a move lower. |
Source: Tradingview.com |
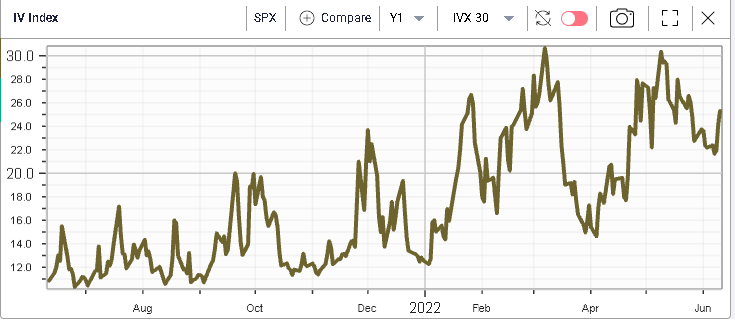
Despite the sentiment amongst some commentators that this market has so far been driven by fear and panic, it has remained fairly technical and very tradeable. This factor alone probably explains why implied volatility has remained fairly subdued over the past few months. As a reminder, IV serves as a proxy of the level of compensation required by options sellers to accept the risks associated with those products. |
Looking at the below chart of 30d IVX extracted from IVolLive, it shows an interesting phenomenon about this year’s selloff. Both wave 1 and wave 3 were interrupted when 30d IVX reached 30%. This could be a sign that here again the market remains very rational and calm about this selloff which it seems to view as purely technical, at least for now. |
|
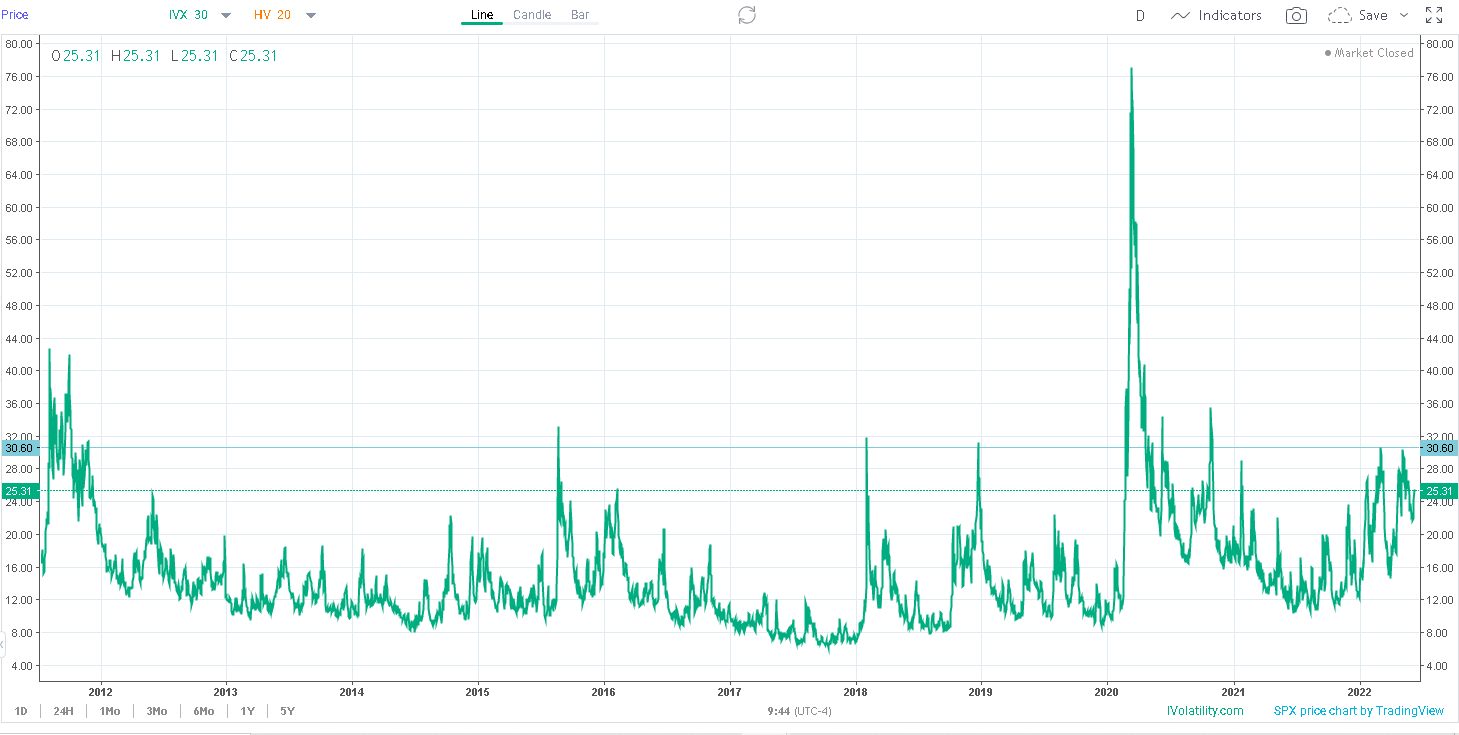
Looking at our long-term chart for SPX 30d IVX, we can see that 30% is a really important level for the market that separates periods of outright crisis and panic from more benign corrections in the market. |
|
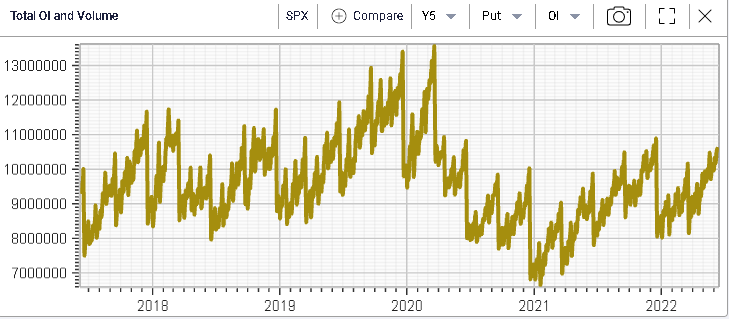
The open interest on the put side also displays a very different picture than the one seen in 2020 for instance. Following the December 2019 expiration, open interest for SPX options exploded to record levels before collapsing as March 2020 options expired and traders watched to see if the lows would be broken, which did not happen. |
|
Today we can see that the open interest has increased but relatively slowly. That could be a sign that traders remain comfortable with the way this selloff is unfolding and do not require extra protection. It will definitely remain an important indicator to watch, in particular if things start to play out in a way that comes as a surprise to investors. |
Overall, the picture we get from the market is one of a correction both technical following a very powerful move higher from 2020 to the end of 2021 but also backed by fundamentals with a hit to global growth in the form of lower trade (for reasons ranging from Russia/Ukraine to Chinese lockdowns) as well as higher inflation eroding purchasing power and margins. |
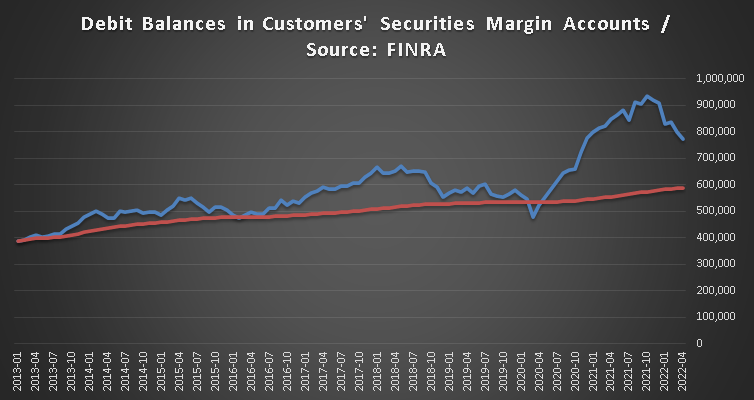
Talking about margins, the below chart shows the amount of margin used by customers in firms regulated by FINRA. It is clear from the below that we are seeing a reduction of the amount of margin employed by traders which completely exploded following the bottom of Mar’2020. |
|
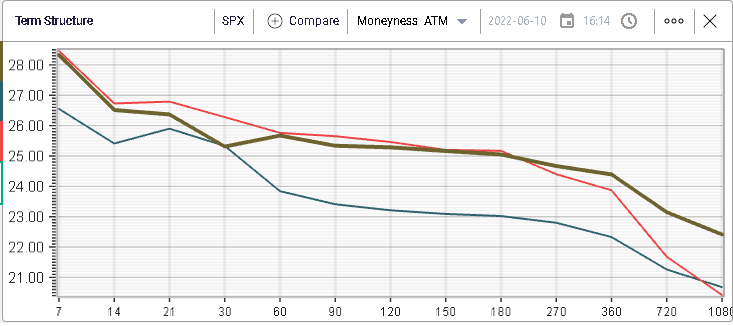
Looking at the term structure of volatility in yellow as of Friday’s close, in red as of the 20th May’22 and in blue as of the 24th Feb’22, it looks like the shape has barely moved for now. |
|
Options traders seem to continue to view the current scenario as one of higher volatility in the short term but a relatively moderate situation over the longer term. |
Disclaimer - This information is provided for general information and marketing purposes only. The content of the presentation does not constitute investment advice or a recommendation. IVolatility.com and its partners do not guarantee that this information is error free. The data shown in this presentation are not necessarily real time data. IVolatility.com and its partners will not be liable for any loss or damage, including without limitation, any loss of profit, which may arise directly or indirectly from the use or reliance on the information. When trading, you should consider whether you can afford to take the high risk of losing your money. You should not make decisions that are only based on the information provided in this video. Please be aware that information and research based on historical data or performance do not guarantee future performance or results. Past performance is not necessarily indicative of future results, and any person acting on this information does so entirely at their own risk. |