Have we entered the capitulation phase? |
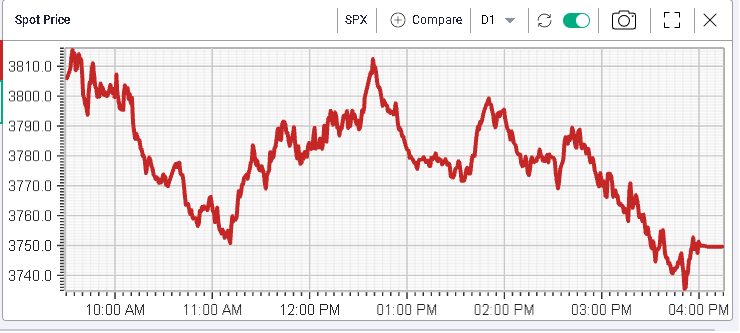
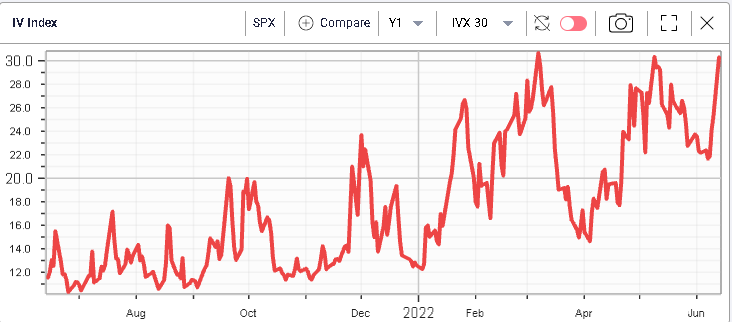
The SPX broke its support yesterday at 3800 and pushed lower. A large liquidation below that level happened and despite an intraday pullback we could not get past 3800 again. The SPX closed 3.9% lower, the NDX 4.6% and the DJIA 2.8%. 30d IVX in the SPX has now reached around 30 again and it will be interesting to see how the market reacts over the next few sessions. |
|
|
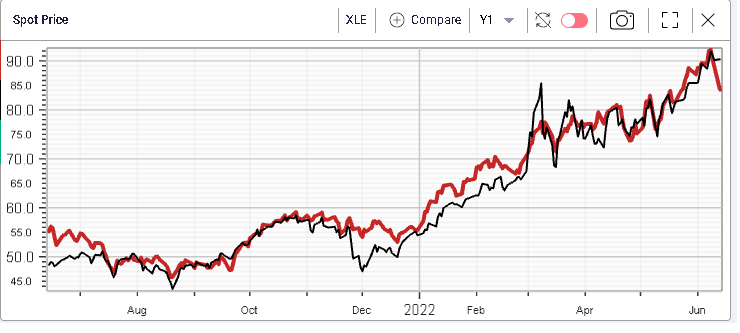
Looking at sectors, the Energy space underperformed the rest of the market closing 5.2% lower on the day. This happened despite a relatively stable underlying Crude market with USO settling 0.26% higher on the day. |
This type of reaction may be a sign that investors are now liquidating stocks that they like and are seeking to book performance. |
|
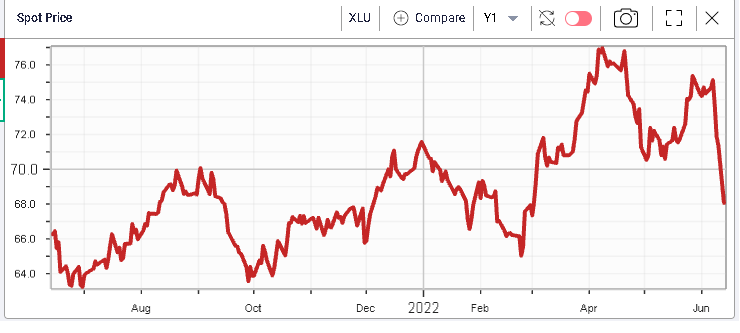
Another prime example of this phenomenon would be the utilities sectors, generally perceived as fairly defensive in the current market environment, which lost 4.6% yesterday. |
|
This is an important sign that could be associated with one the final phases of the selloff, which can last a fairly long time depending on the resilience of investors: the capitulation phase. |
It is generally accepted that selloffs can be split into consecutive phases. First comes the denial when traders reject the possibility that the new paradigm defined in the prior up move was incorrect. They remain convinced that the market is poised for a move higher and to continue accelerating. Following that phase, bulls generally get comforted by a strong rally that pushes prices almost towards the all-time highs. |
The following phases are the more violent ones and split into two periods. First there is fear when traders look for hedges and reduce their overall exposures, focusing on assets considered core and immune to the current selloff. Then comes the capitulation when all bets are off and people cannot focus on anything else except the return of their capital. |
The final phase, despair, generally sees opportunistic buyers’ step in while the vast majority that rode the move lower is unable to foresee a bounce. From there, the market can start building momentum again in order to move higher again. |
This description of market selloffs is undoubtably very simplistic and can only give a very broad understanding of how selloffs play out. This being said, it is helpful in the current context to help us appreciate that the dynamics witnessed over recent days were slightly different from what was seen in the prior waves. |
Consumer Discretionary, Tech and Communications continue to be heavily sold closing respectively 4.6%, 4.7% and 4.4%. |
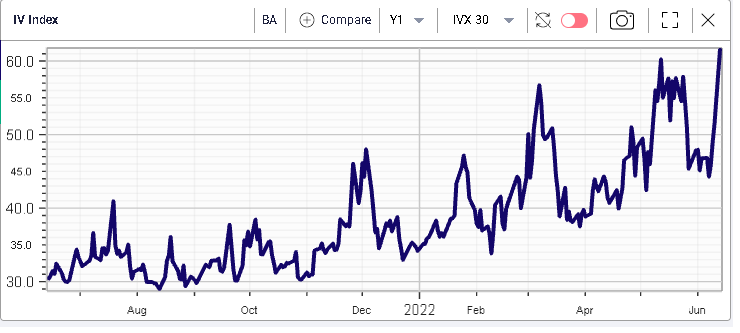
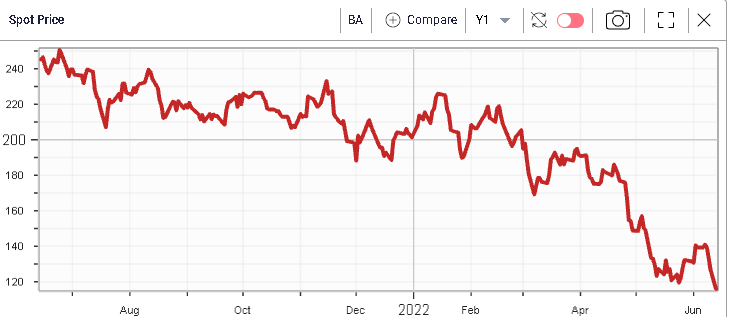
Within single stocks, the picture is generally the same, BA was the worst performing stock of the DJIA closing 8.8%. More surprisingly, CVX, which had gained more than 50% at the top was one of the worst performing stocks of the day losing 4.6%. |
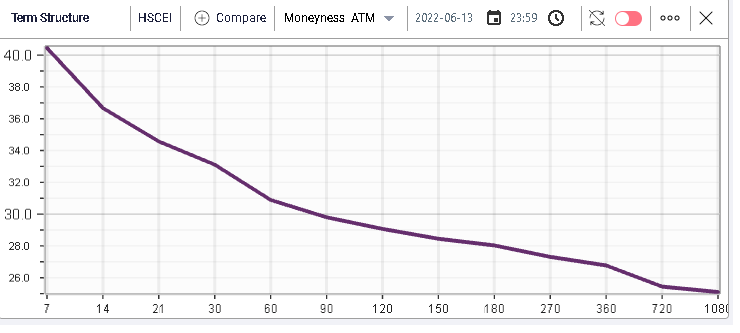
Looking at volatility, the market’s attention remains very much driven towards Chinese equities with short dated implied volatility for the HSCEI above 40%. |
|
The recent bounce that we flagged in a prior market update seems to have stalled as global equities started to move lower again. |
|
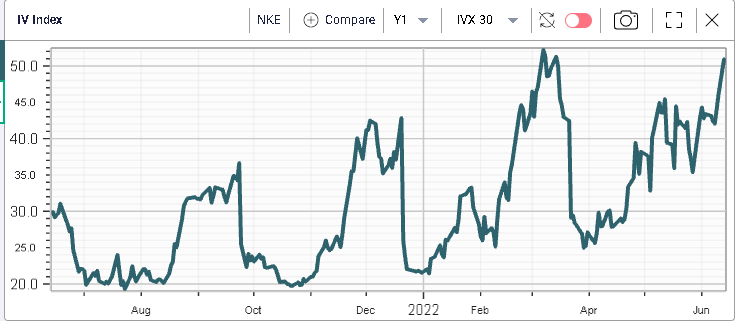
At the single stock level, the attention on NKE will remain very high over the next few weeks at least as the company releases numbers next week. |
30IVX in the name is back towards its 12 months highs above 50 while spot continues to slide and approaches its 52 weeks lows. |
|
|
Options traders also remain very concerned about BA with 30d IVX reaching new 12 months highs as shown below while spot is now testing its 52 weeks lows. |
|
|
Disclaimer - This information is provided for general information and marketing purposes only. The content of the presentation does not constitute investment advice or a recommendation. IVolatility.com and its partners do not guarantee that this information is error free. The data shown in this presentation are not necessarily real time data. IVolatility.com and its partners will not be liable for any loss or damage, including without limitation, any loss of profit, which may arise directly or indirectly from the use or reliance on the information. When trading, you should consider whether you can afford to take the high risk of losing your money. You should not make decisions that are only based on the information provided in this video. Please be aware that information and research based on historical data or performance do not guarantee future performance or results. Past performance is not necessarily indicative of future results, and any person acting on this information does so entirely at their own risk. |