Volatility into the FOMC |
The selling slowed down during yesterday’s session as the FOMC nears. The SPX settled 0.38% lower, the NDX 0.2% higher. Following the CPI print last Friday, traders increased their focus on this week’s meeting with the possibility of a 75bps move becoming the central case for most economists. Some even went as far as to suggest that a 100bps could be on the cards for tonight. |
That adjustment in a short time span of such an important expectation forced a lot of position squaring and rethinking by market participants. |
Considering the various scenarios that could play out, it is really difficult to know how market participants would react given a specific rate hike. For instance, should the FED opt to deliver only 50bps, would traders be comfortable that the FOMC is committed to raising rates while ensuring that it will not strongly affect financial markets or would investors view it as a sign that FED participants remain behind the curve and have not yet fully appreciated how significant the inflation numbers were. |
If on the other hand, the FED chose to deliver a full 1% hike, would it be perceived as committed and aggressive potentially providing relief to investors that inflation would be under control or would traders be worried that the FOMC might prefer to do too much rather than too little irrespective of how consequential those moves would be for financial markets. |
All in all, tonight’s meeting is one of the most significant events that we have seen in a long time and the volatility associated could be large. |
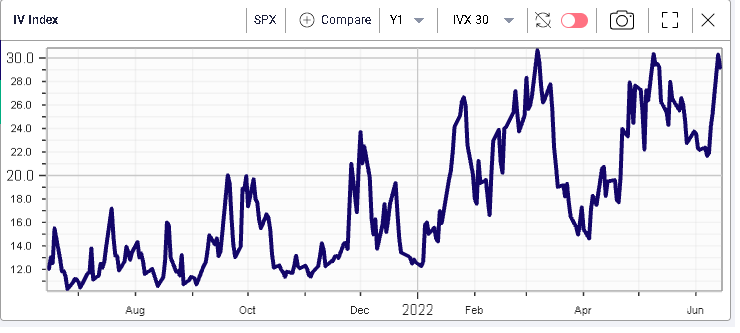
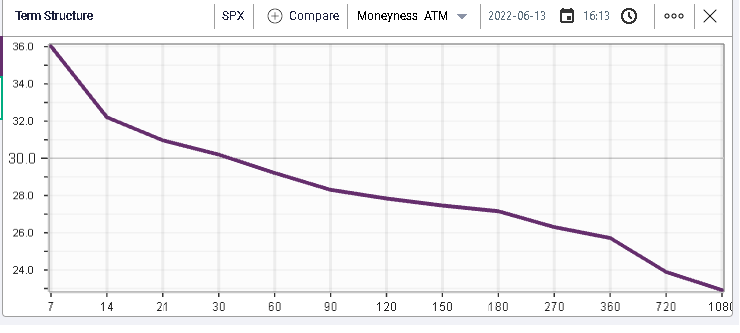
Talking about volatility, the 30d IVX stopped at the 30 mark yesterday and dropped slightly while the term structure remains firmly inverted in the SPX. |
|
|
Looking at sectors, Tech and Energy were the best performing segments of the market with Tech up 0.6% and Energy gaining 0.2%. Utilities continue to selloff and settled 2.5% lower on the day. |
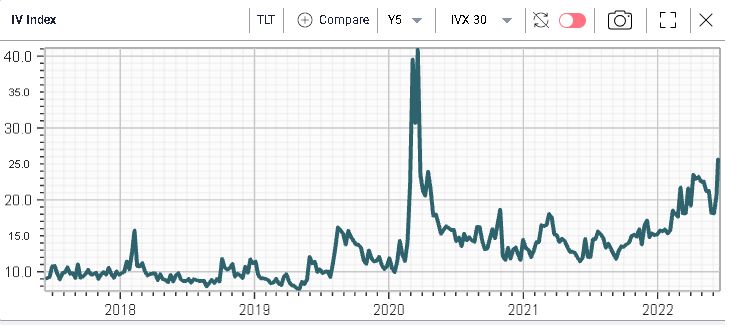
Expectations for tonight’s meeting are not just elevated for equity traders but obviously also extremely high for bonds traders. Looking at TLT implied volatility below, we can see that is has now reached its highest level in 12 months and the second highest mark seen over the past 5 years. |
|
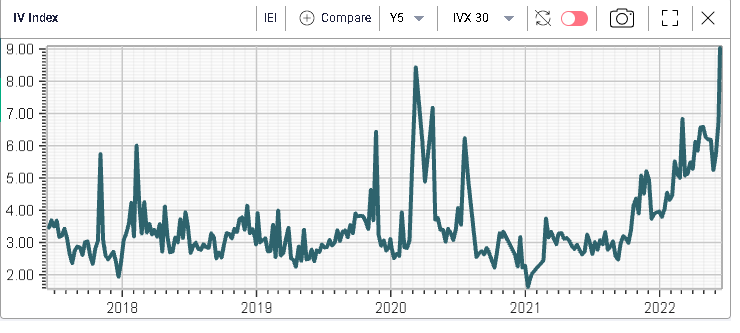
Volatility in Fixed Income is fairly elevated historically for all tenors, below we show the 3–7-years IV bucket proxied by IEI. |
|
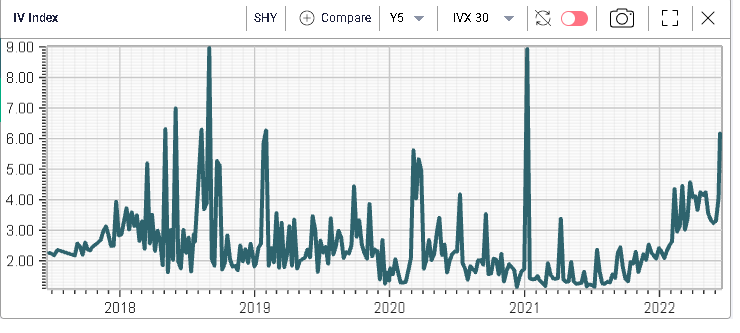
Even the front-end has seen its implied volatility spiking as displayed on the 1-3yr segment proxied by SHY. |
|
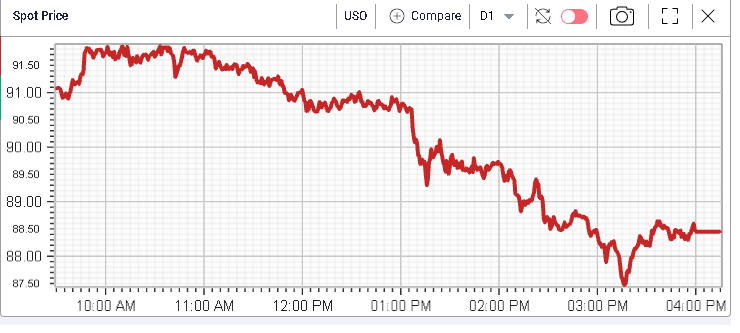
In commodities, Oil had a fairly volatile day with USO giving up 2.1% over the day. Despite all the apparent action, volatility (both implied and realized) has actually compressed over the past few months as shown below. |
|
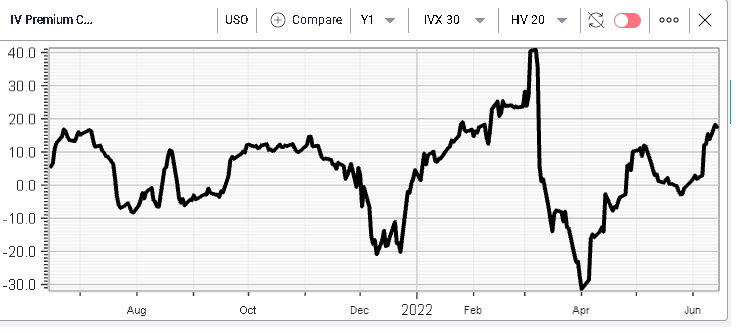
This creates a complex situation for traders with short dated implied volatility looking expensive when measured against realized volatility as exhibited on the below IV Premium chart. At the same time, because the risks around the Oil market remain very high, traders are reluctant to offer volatility too low as they are concerned about an unexpected announcement hitting the tapes. |
|
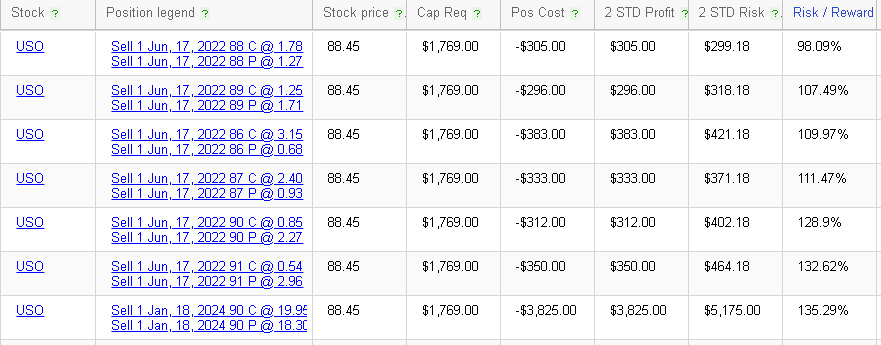
Querying the RT Spread Scanner to find the most attractive short straddles across the market gives the following list. |
|
The most attractive structure from a risk taken to potential reward is the 17th Jun’22 88 straddle on USO which earns a combined premium of $305 for a possible 2 standard deviation loss of $299.18. |
Disclaimer - This information is provided for general information and marketing purposes only. The content of the presentation does not constitute investment advice or a recommendation. IVolatility.com and its partners do not guarantee that this information is error free. The data shown in this presentation are not necessarily real time data. IVolatility.com and its partners will not be liable for any loss or damage, including without limitation, any loss of profit, which may arise directly or indirectly from the use or reliance on the information. When trading, you should consider whether you can afford to take the high risk of losing your money. You should not make decisions that are only based on the information provided in this video. Please be aware that information and research based on historical data or performance do not guarantee future performance or results. Past performance is not necessarily indicative of future results, and any person acting on this information does so entirely at their own risk. |