A dovish hike and a stock in play |
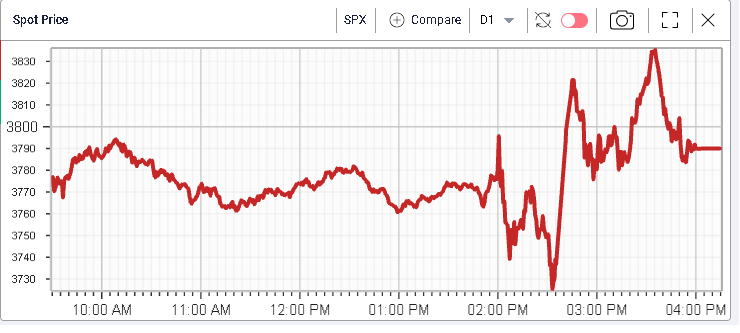
The FED increased interest rates by 0.75% yesterday and guided that further rate hikes would come this year. The FED decided to front-load the rate hikes by doing 0.75% instead of the 0.5% they initially planned. During the press conference, traders were on the hunt for any sign of dovishness by Jerome Powell which he delivered by saying that that the 0.75% hike was “an unusually large one” and that he did not expect “moves of this size to be common”. From that point, futures turned higher and never really looked back until much later in the day. |
|
Overall, the market finished in the green despite a late session selloff that took a large portion of the gains that the market was showing. The SPX settled 1.46% higher, the NDX 2.49% and the DJIA was only up 1%. |
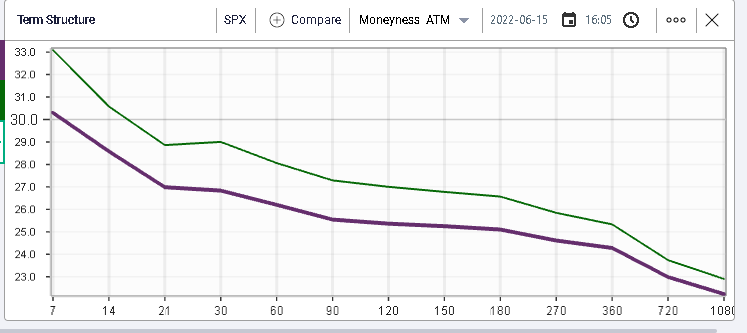
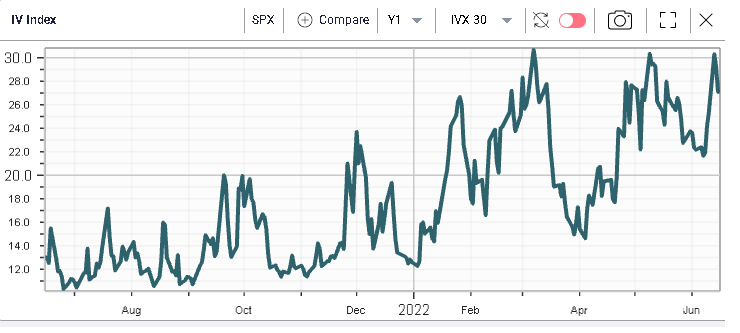
Looking at implied volatilities, the curve parallel shifted down, led by the front-end. 30d IVX lost 2.2 points on the day pushing back below the 30% mark. |
|
|
Looking at single stocks, BA managed to gain 9.5% on the session. It felt that the market was trying to push higher some of the top underperformers on the year with names like MSFT gaining 3%, CRM up 2.5% etc. On the downside, CVX continues to slide, dropping another 2% on the back of oil prices failing at the $120 level over the past few days. |
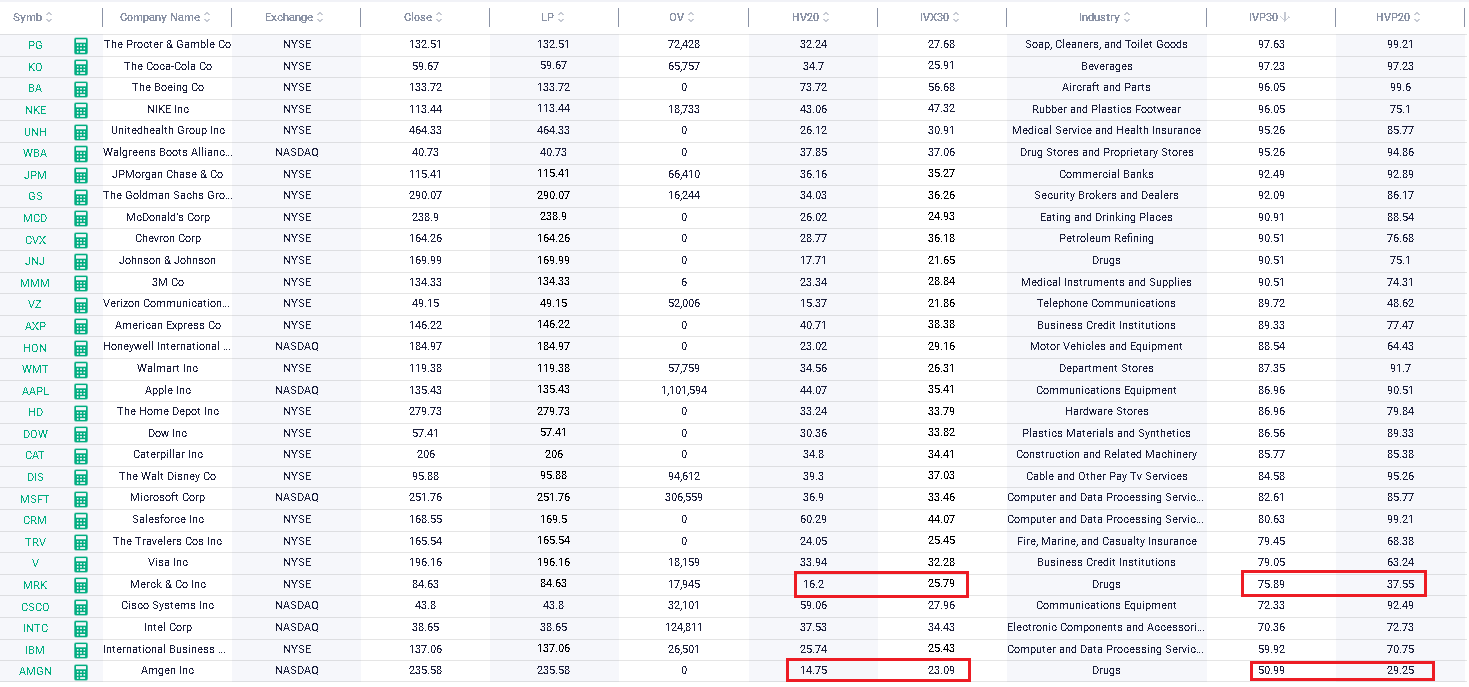
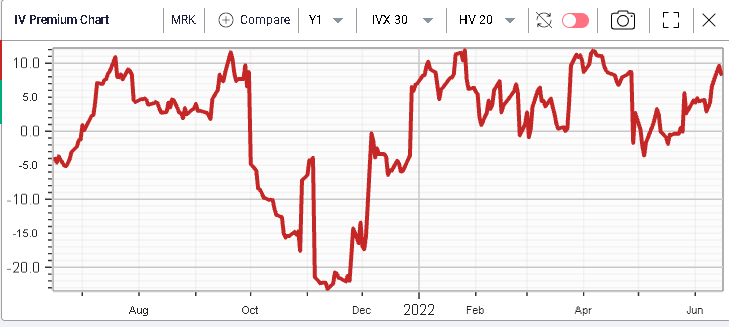
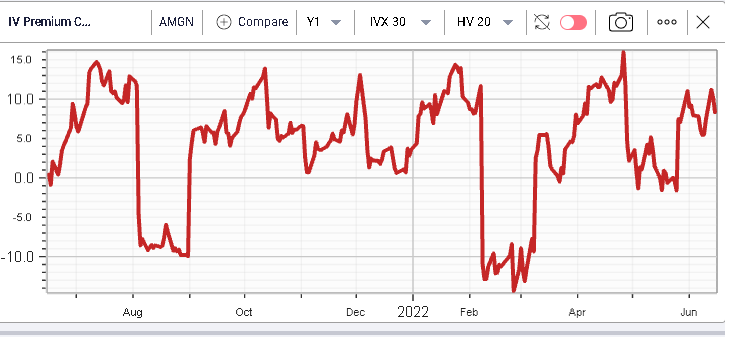
Looking at implied volatilities via the Stock Monitor in IVolLive, we can spot some names that stand out and where implied volatility looks rich relative both to its own history and to realized volatility. Those names are MRK and AMGN. |
|
We use 4 measures provided within IVolLive. First the percentiles which give us an idea of the current position of implied volatility and realized volatility relative to their own 12 months history. This is the IVP30 looking at the IVX30 and HVP20 looking at HV20. Second 30d IVX which is a proprietary index created by Ivolatility.com and HV20 which is the realized volatility over the last 20 days. |
In practical terms, if IVP30 is 75.89th percentile in MRK, that means that over the past year, MRK 30d IVX was lower than where it is currently 75.89% of the time. As implied volatility and realized volatility are linked and tend to converge, comparing their relative positions help us locate discrepancies. |
Looking at the IV Premium historically on those two names, we can see that for MRK, it is pretty much sitting at its 12 months highs, with an IVX30 around 10 points over the HV20. |
|
For AMGN, the spread is around 10 although it seems that the pivot is closer to 12.5 for that specific name. |
|
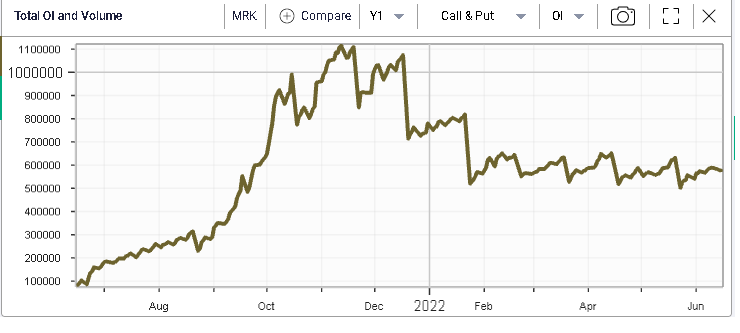
Looking at open positions in those names is generally an important step that can help us understand if this discrepancy is linked to a particular activity in the stocks we are studying. |
First on MRK, we can see that the open interest which summarizes the total number of open options contracts on a given underlier has remained very calm. |
|
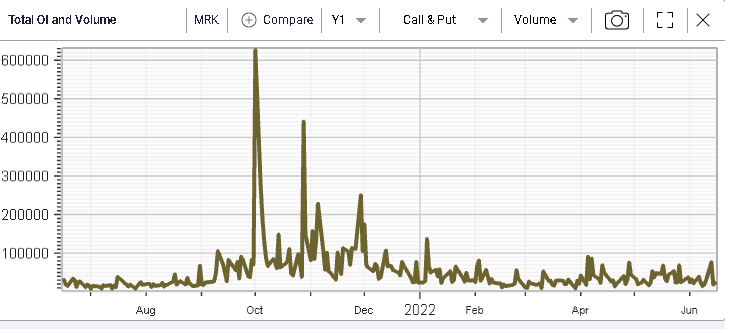
The same can be said of volumes which have seen a spike over the past few days but remain very low compared to where they have been historically. |
|
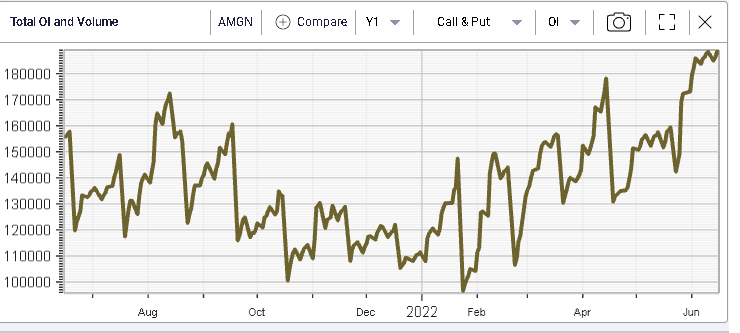
For AMGN, the situation is slightly different. We can see on the below that the open interest in the name has now reached its 12 months high. |
|
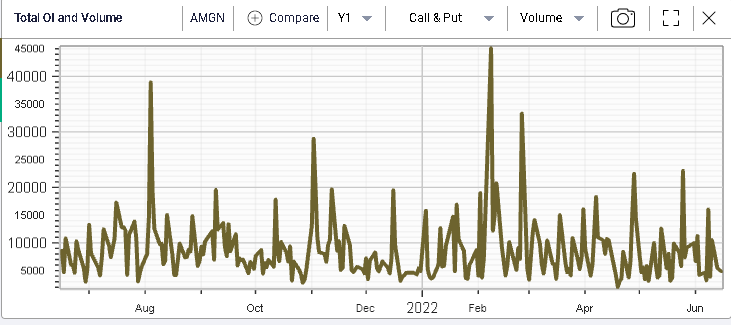
Looking at volumes, we can see that they have picked up although remain under long term peaks. |
|
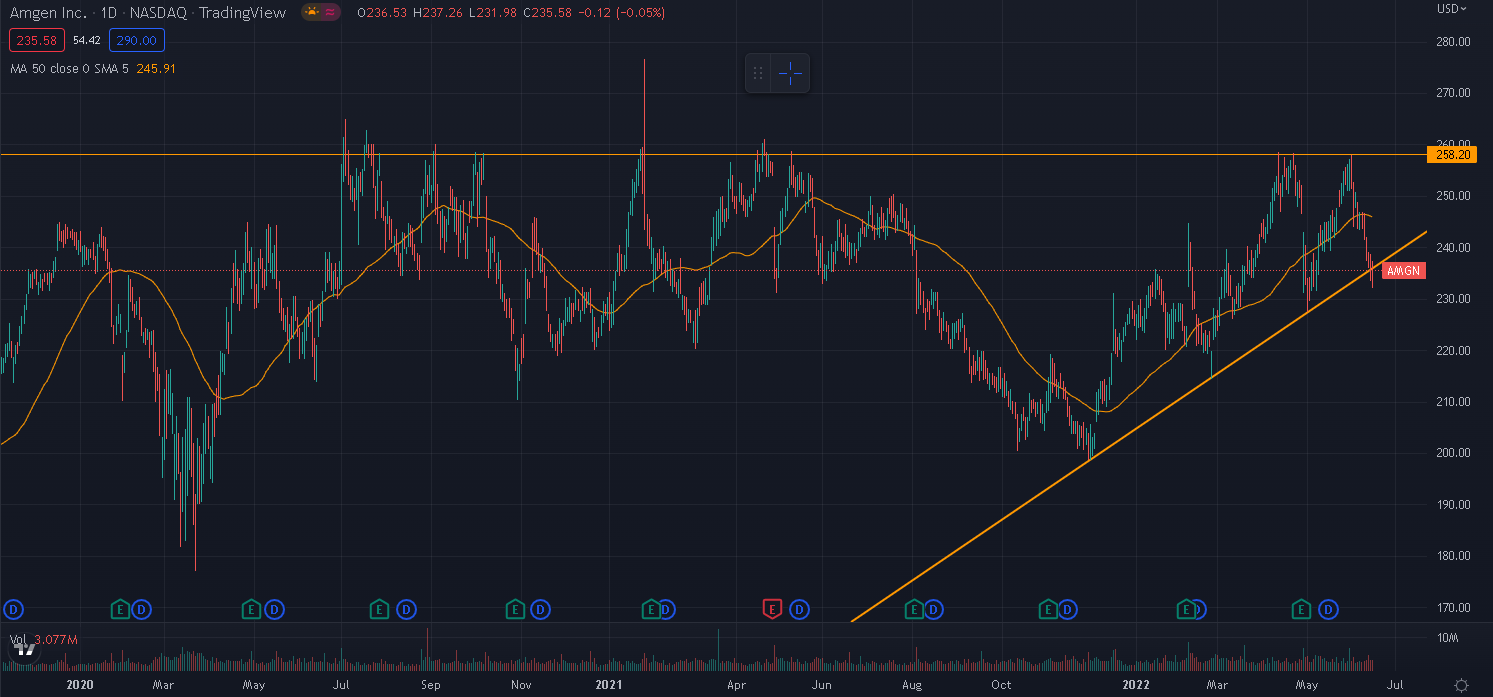
This should then lead us to study the stock in more details starting with technical analysis. From that side, we can see that the stock has been capped around $258 for the past few years, a level that we tested again at the beginning of Jun’22 and which we failed to breach. |
Source: tradingview.com |
Second, we can see that the trendline starting from the lows of Nov’21 has been broken over the past few days. Finally, the stock is trading below its 50 days moving average. Technically, it thus looks like the stock has made a double top at $258 and traders seem to be looking at a test of $227 which would act as a pivot. Conventional wisdom would have that, a break of $227 would imply a move lower of around $31. |
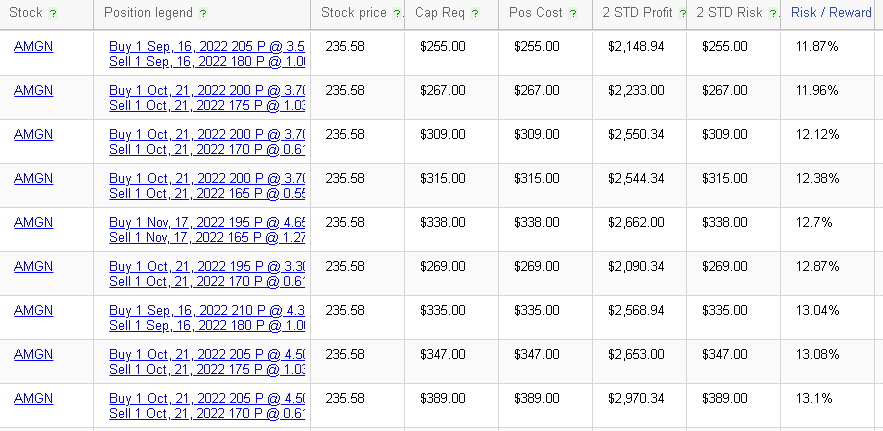
Assuming that, having done all the required work (including fundamental analysis), the trader decides that he wants to express a bearish view on AMGN, turning to the RT Spread Scanner would provide our customer with a menu of options to express that view. Let us imagine for now that he is mostly interested in bear vertical spread but cannot decide which maturity and strikes to pick. |
|
In this example, we can see that the Sep 205/180 bear vertical spread screen as being the most attractive from a risk/reward perspective with around $1 of possible gain for each $11.87c of risk taken. |
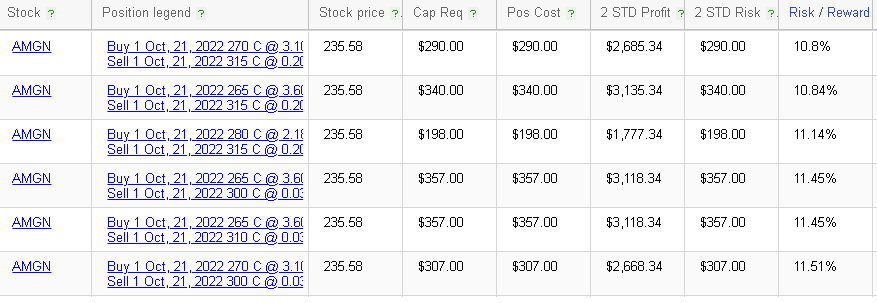
Were the trader bullish on the stock then the system would also help find some strategies that could make sense from a risk/reward perspective. For instance, below, we show the scan of a bull vertical spread on AMGN. |
|
Once again, we have multiple choices offered to us with the Oct’22 270/315 bull vertical spread offering the best combination with a risk/reward of 10.8%. |
Disclaimer - This information is provided for general information and marketing purposes only. The content of the presentation does not constitute investment advice or a recommendation. IVolatility.com and its partners do not guarantee that this information is error free. The data shown in this presentation are not necessarily real time data. IVolatility.com and its partners will not be liable for any loss or damage, including without limitation, any loss of profit, which may arise directly or indirectly from the use or reliance on the information. When trading, you should consider whether you can afford to take the high risk of losing your money. You should not make decisions that are only based on the information provided in this video. Please be aware that information and research based on historical data or performance do not guarantee future performance or results. Past performance is not necessarily indicative of future results, and any person acting on this information does so entirely at their own risk. |