Is someone betting that the market won't move for the next few months? |
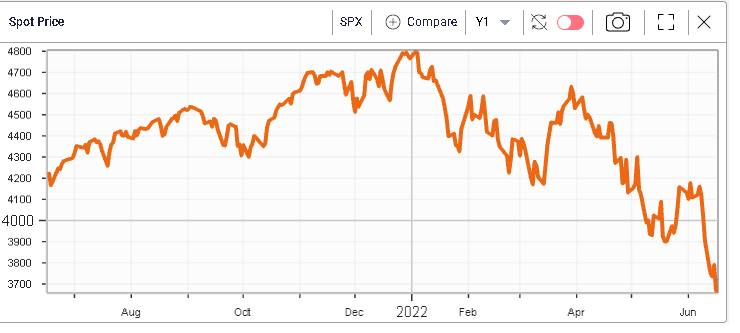
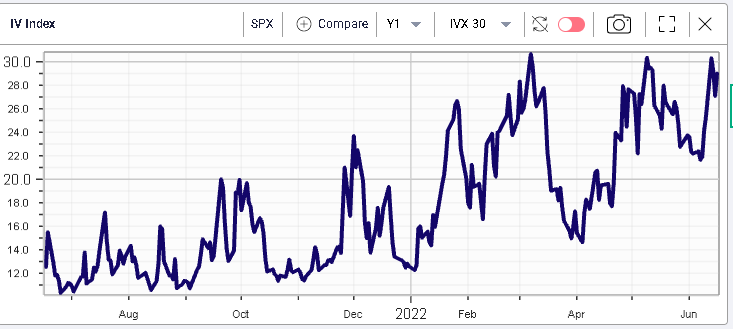
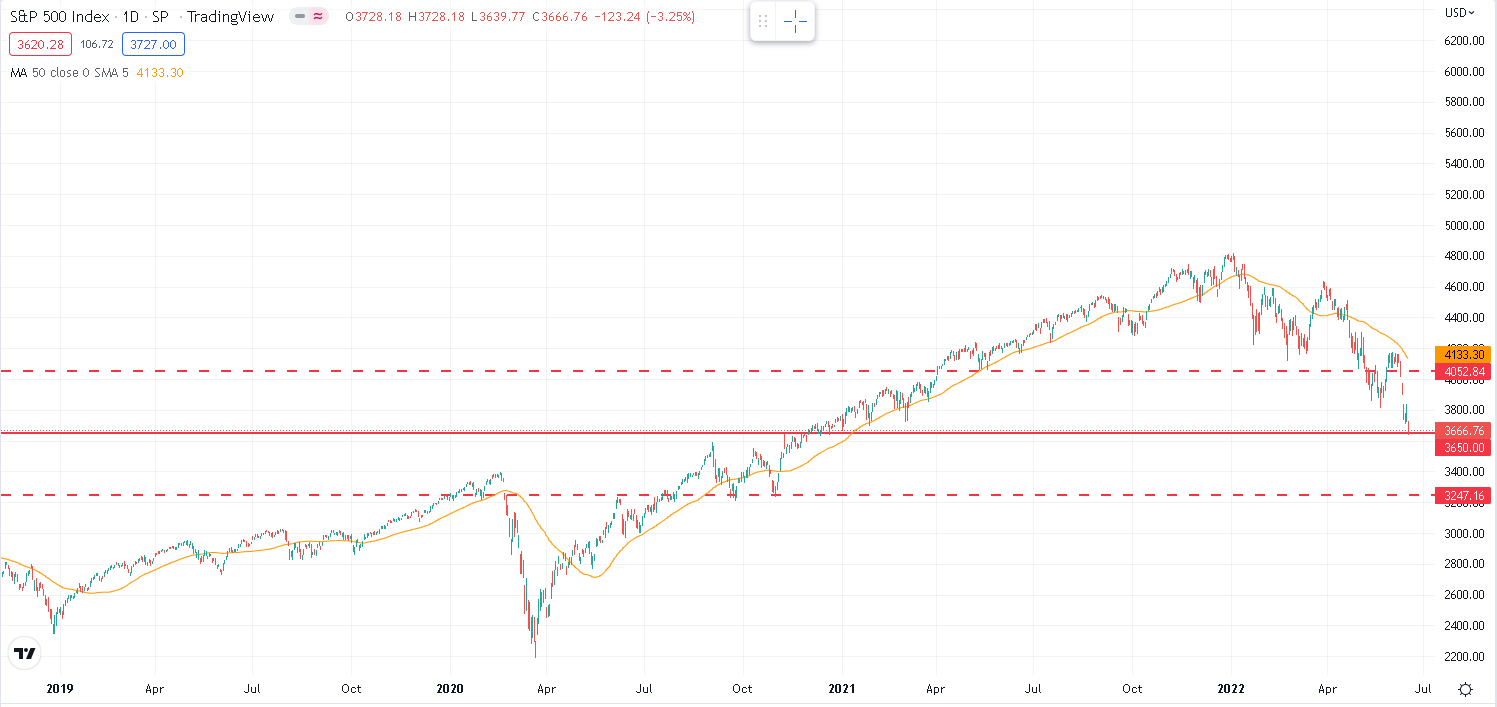
The selling pressure continued yesterday with the SPX losing another 3.25%, the NDX dropping 4% and the DJIA shedding 2.42%. Despite the aggressive move lower, implied volatilities managed to remain below the 30% mark once again on the SPX sending an overall mixed message from market makers. |
|
|
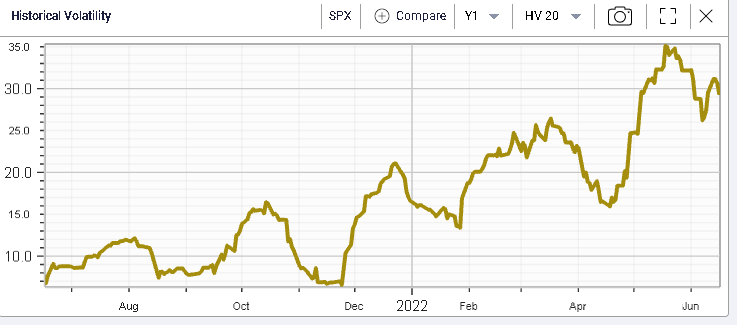
This happens despite the fact that realized volatility remains fairly elevated and above 30 when measured on a 20-day historical basis. |
|
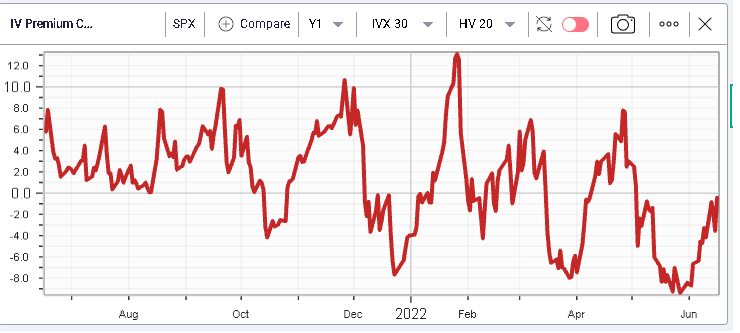
As a result, the IV Premium remains slightly negative although far from the recent lows that we highlighted in a previous market update. |
|
With expiration today, traders were mostly focused on squaring positions yesterday but some important flows still caught our attention. The Sep’22 3650 calls and puts were traded 21,000 times and were displayed only late on the day. That’s not a small size for any individual fund to trade, specifically, we are talking $7.7bln of notional and $845 million of premium value. |
We cannot know for sure the direction that was traded, but it does not prevent us from thinking about what someone might have wanted to express with that option. Looking at the prices, the puts traded at 189.67 and the calls at 213.17. If this was a straddle, it would have a combined value of $402.84. |
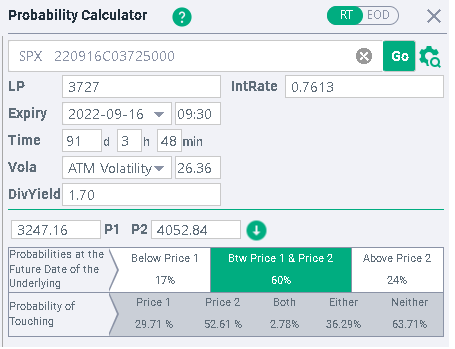
On the below chart, we can see that a trader who would sell this straddle would only lose money if the SPX finished either above 4052.84 or below 3247.16, the full red line denotes the strike of the options and the dotted lines show the breakevens. |
|
Going into IVolLive and using the calculator, we can see that the options market is currently assigning a probability of around 60% that we finish between those strikes at expiration. |
|
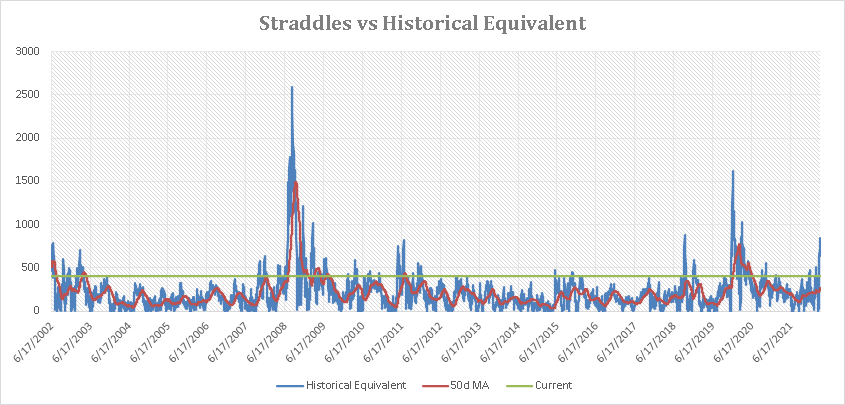
When you consider that over the past 5 trading session, the SPX has lost 7.74% or $307.62, a move of $402.84 within the next 91 days seems very plausible. Over the past month, the market has “only” lost $422 and over the past 6 months we have dropped $954. In all instances, shorting this straddle in the current market environment may not seem like a great idea. |
Looking at historical data in order to get some context, we calculate how much the market moved over 60 consecutive trading sessions adjusted to today’s value (roughly equivalent to the number of trading sessions separating us from the September expiration) and plot that against the current level implied by the straddle as well as the 50 days rolling average. |
|
Here we are able to notice a few things. First, the current move we have just witnessed is very large historically. It is on par with the selloffs of 2018 and 2011 but is still some distance from the Mar’2020 selloff and the 2008-2009 financial crisis. |
Looking at the smoothed moving average shows that there are very few periods when over a rolling 50-day period, the average realized move manages to get past the current implied level. There are generally one or two periods that explain most of the overall move with the market relaxing fairly quickly afterwards. |
Looking through the lens of history may provide us with some idea about why someone would consider this strategy in the current market conditions. |
For more information about how to access our data, please visit: https://www.ivolatility.com/data/historical_data2.html |
For more information about IVolLive, please visit: https://www.ivolatility.com/services.j |
Disclaimer - This information is provided for general information and marketing purposes only. The content of the presentation does not constitute investment advice or a recommendation. IVolatility.com and its partners do not guarantee that this information is error free. The data shown in this presentation are not necessarily real time data. IVolatility.com and its partners will not be liable for any loss or damage, including without limitation, any loss of profit, which may arise directly or indirectly from the use or reliance on the information. When trading, you should consider whether you can afford to take the high risk of losing your money. You should not make decisions that are only based on the information provided in this video. Please be aware that information and research based on historical data or performance do not guarantee future performance or results. Past performance is not necessarily indicative of future results, and any person acting on this information does so entirely at their own risk. |