SPX and BA Technicals |
Last week was very heavy for markets with the SPX losing 5.8%, the DJIA and the NDX dropping 4.8% on the week. In Europe, the French CAC lost slightly more than 5% on the week while the German DAX lost around 4.7%. European Banks were particularly strong managing to finish only 0.5% in the red as the ECB managed to put a lid on spreads widening. |
Over the week, one of the more interesting moves probably happened in the NDX which managed to outperform the SPX, a fairly unusual phenomenon in 2022 so far. On the other hand, the Japanese NKY significantly underperformed losing almost 7% on the week. |
Last week in our last technical update, we highlighted that the SPX was trading against the very important 3800 level which it broke on Monday. The break lower was fairly sanguine and resulted in a further push lower with weekly lows set at 3636.87 on Friday. |
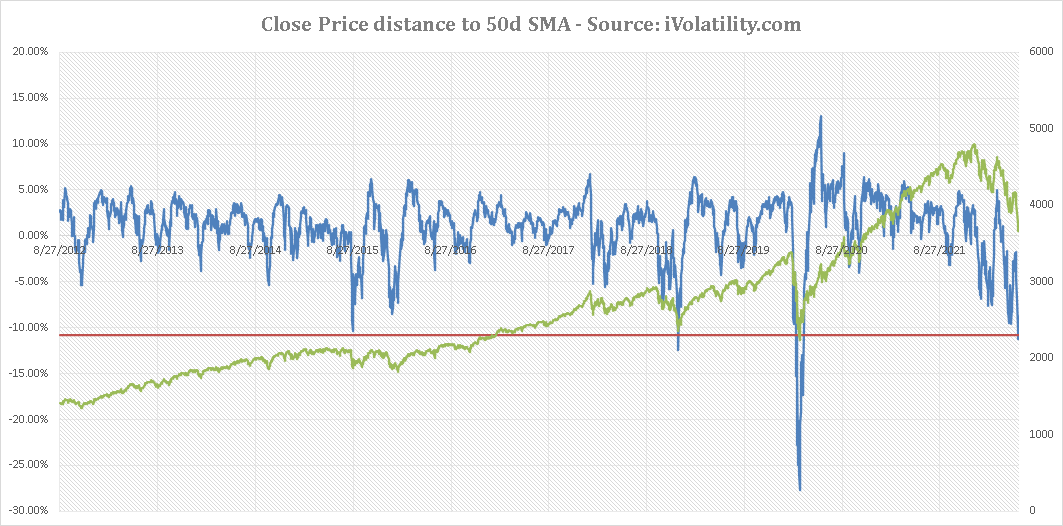
Before moving onto the main ES chart, one important measure when looking at momentum is to assess how far the underlying market has gone from key trend indicators. In this case, we use the 50d moving average as it tends to line up fairly well with our customers timeframe’s. The below chart plots the divergence between the SPX closing level and the 50 MA. We can see that we have now reached levels that could be qualified as extreme with the index trading around 10% below its moving average a phenomenon only observed on two other occasions over the past 10 years during the late selloff of 2018 and the 2020 pandemic. |
|
On both occasions the market turned back higher and made new lows after that situation happened (we agree that this is a fairly limited sample). |
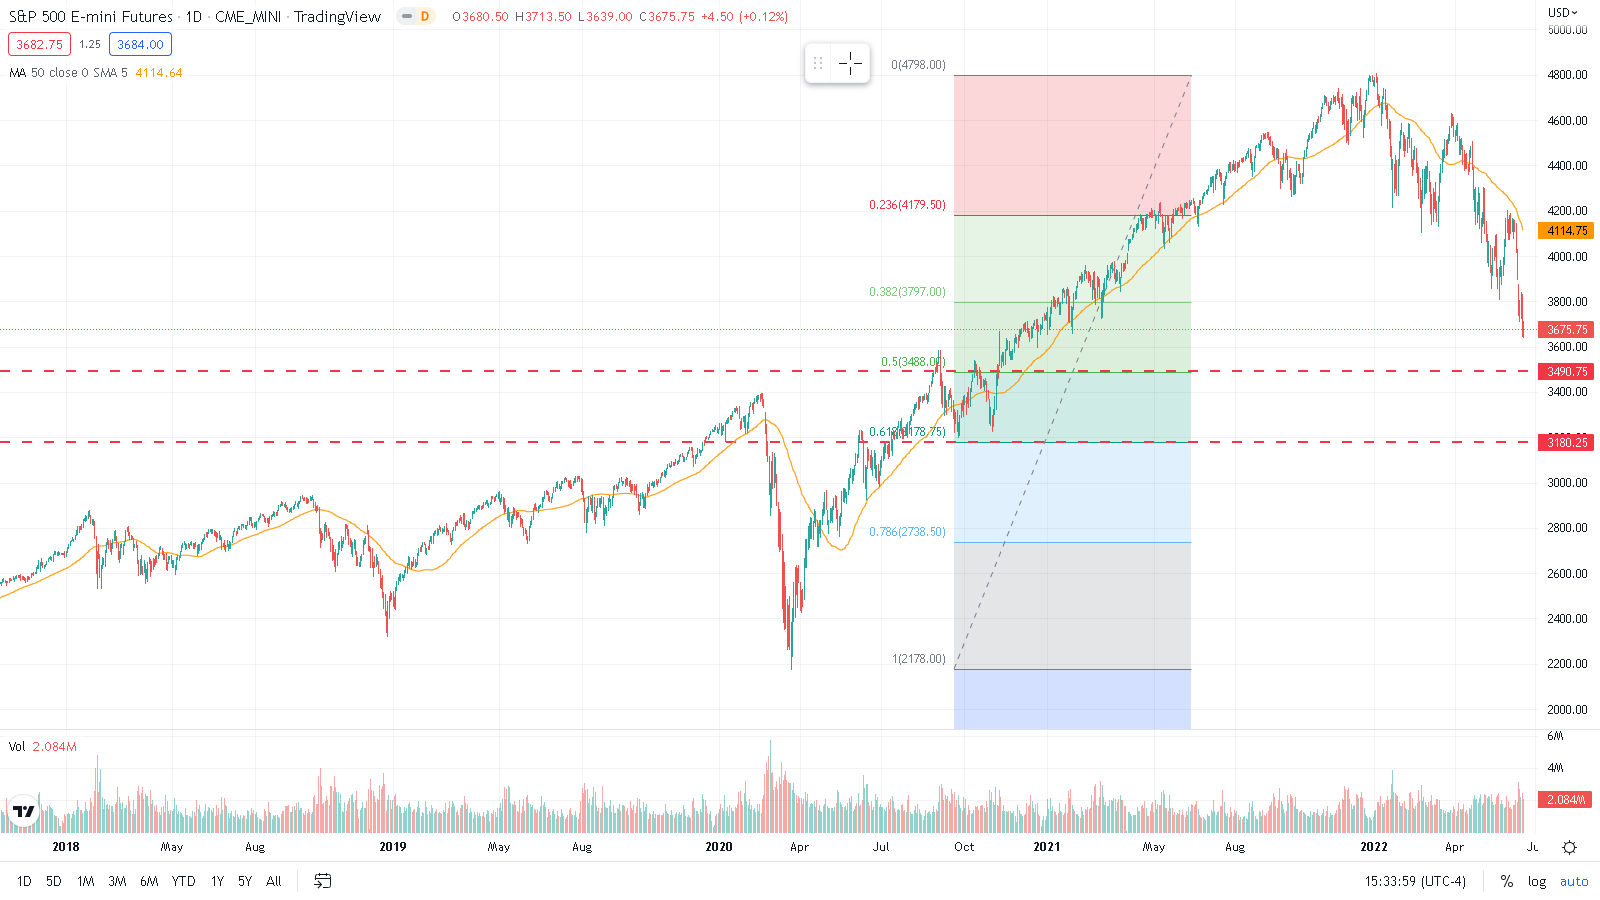
Looking at retracements of the Mar’2020 to Jan’22 range, we can spot two important levels on the downside 3500 and 3200. |
Source: Tradingview.com |
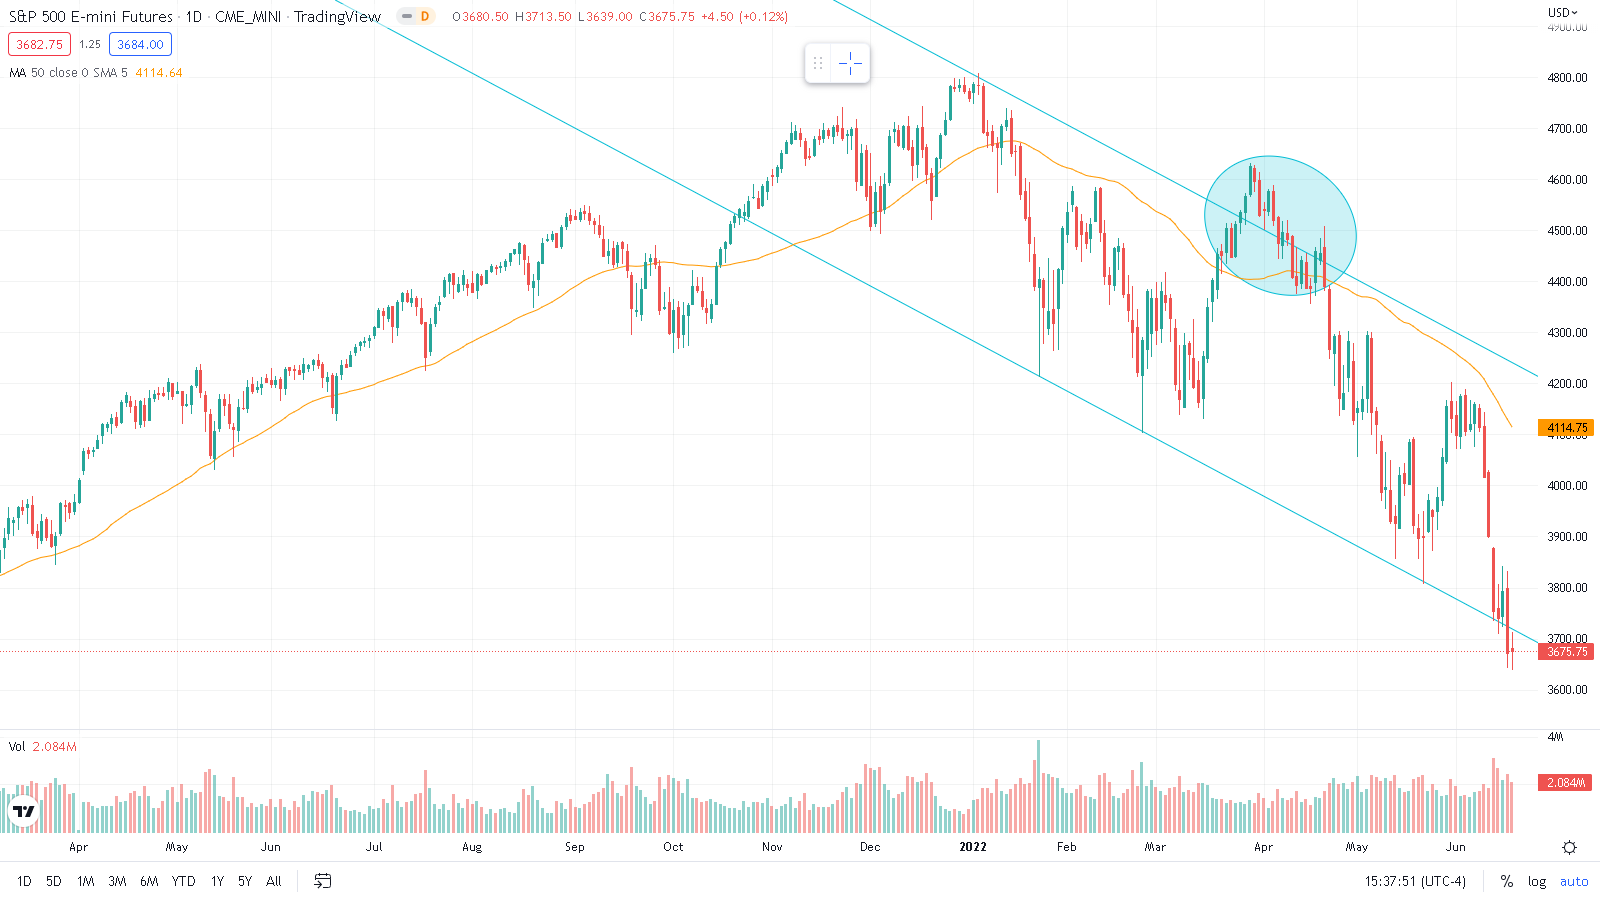
Looking at 2022 price action, we see that the downtrend has so far been fairly capped within the channel highlighted below. The fact that we broke lower last week is important but it does not prevent a retest and a possible reintegration over the next few days. In fact, the euphoria that drove prices higher in Mar’22/Apr’22 pushed the market briefly outside of the channel before we reintegrated it in a fairly violent manner. |
Source: Tradingview.com |
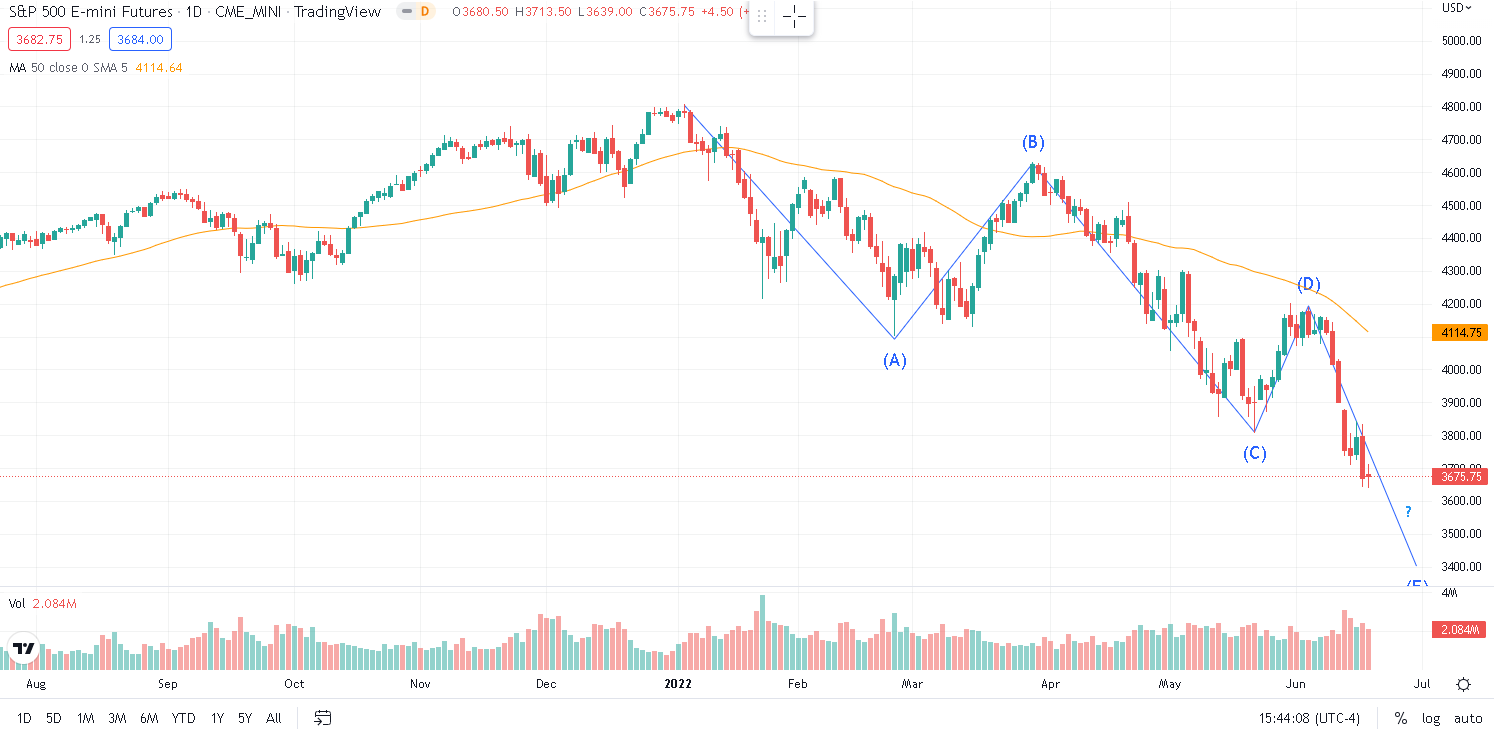
Looking at market dynamics, it seems that we have now entered a fifth wave as described in last week’s market update. The invalidation level sits at 4200, which is the high reached during the fourth wave. |
Source: Tradingview.com |
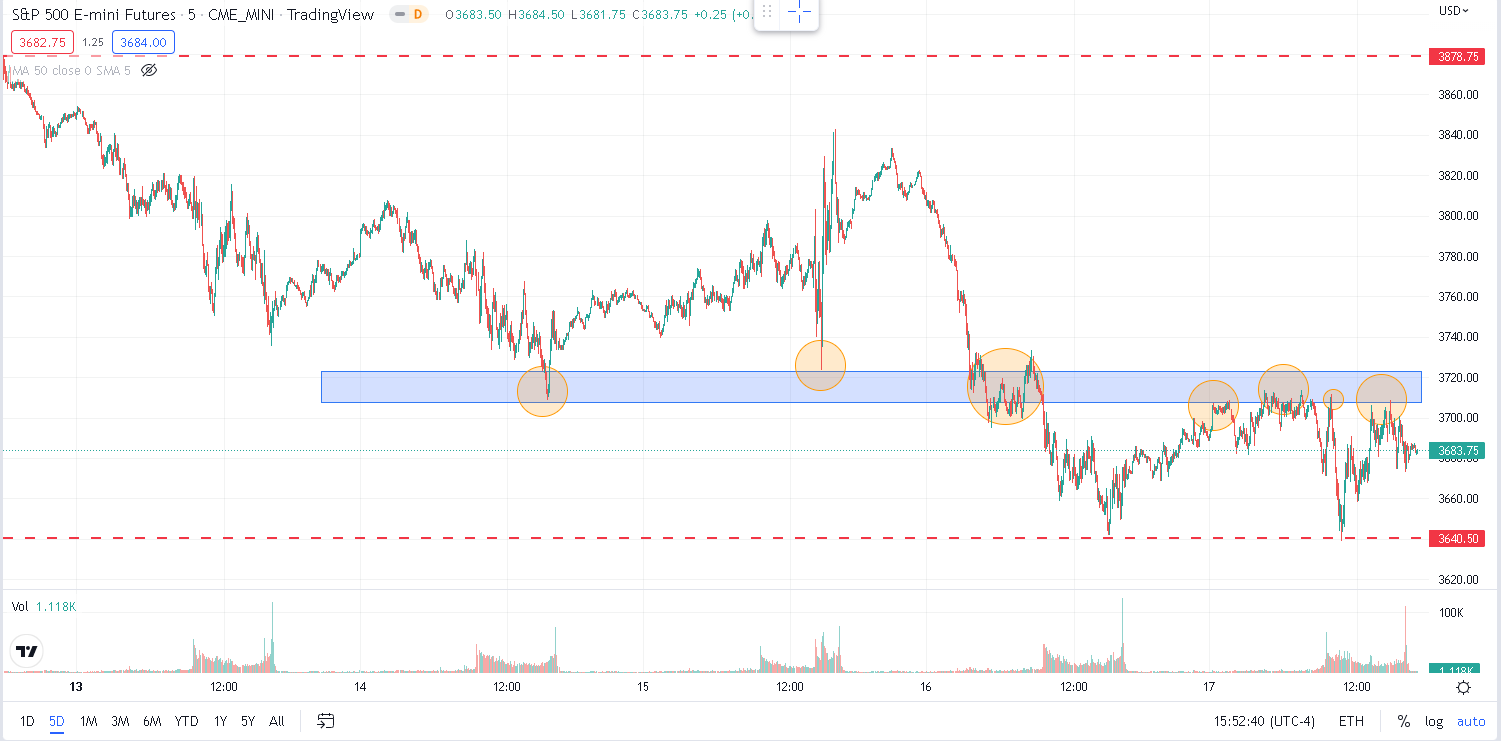
Last week’s price action was very heavy with the weekly highs made on the open on Monday and the weekly lows reached around lunchtime on Friday. One key area should be highlighted as it will likely play a role next week, the 3700-3720 zone. |
Source: Tradingview.com |
Prior to the FOMC, the market had managed to hold the level on at least two occasions. During FED Powell’s speech, traders accumulated contracts from the 3720 to 3820 and as a result, the 3720-zone acted as the reference point for many traders. The unwind of those speculative longs happened during the overnight session on low volumes and as liquidity was very thin and the only level that managed to halt the selloff until the US open was the 3700-3720 zone. |
We retested that area but this time as a resistance on Thursday during the overnight session once again but the momentum from bulls was too weak and could not breach the level meaningfully. We settled below but not far and it will be interesting to see how traders react if we have another go at that area next week. |
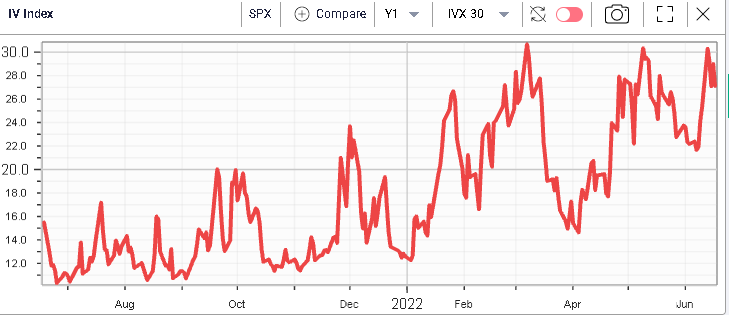
Looking at implied volatility measured by the 30d IVX, we can see that we once again stopped at the 30% mark as shown below. Despite the selloff this week, options market makers did not think it was appropriate to move implied volatilities meaningfully higher. |
|
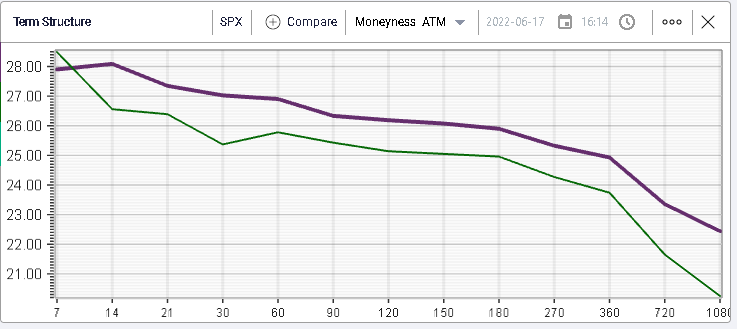
On the below chart, we show the term structure for the SPX as of last Friday in purple against the same measure as of the 10th Jun’22. Implied volatilities moved slightly higher but the magnitude was fairly limited in light of the underlying moves. |
|
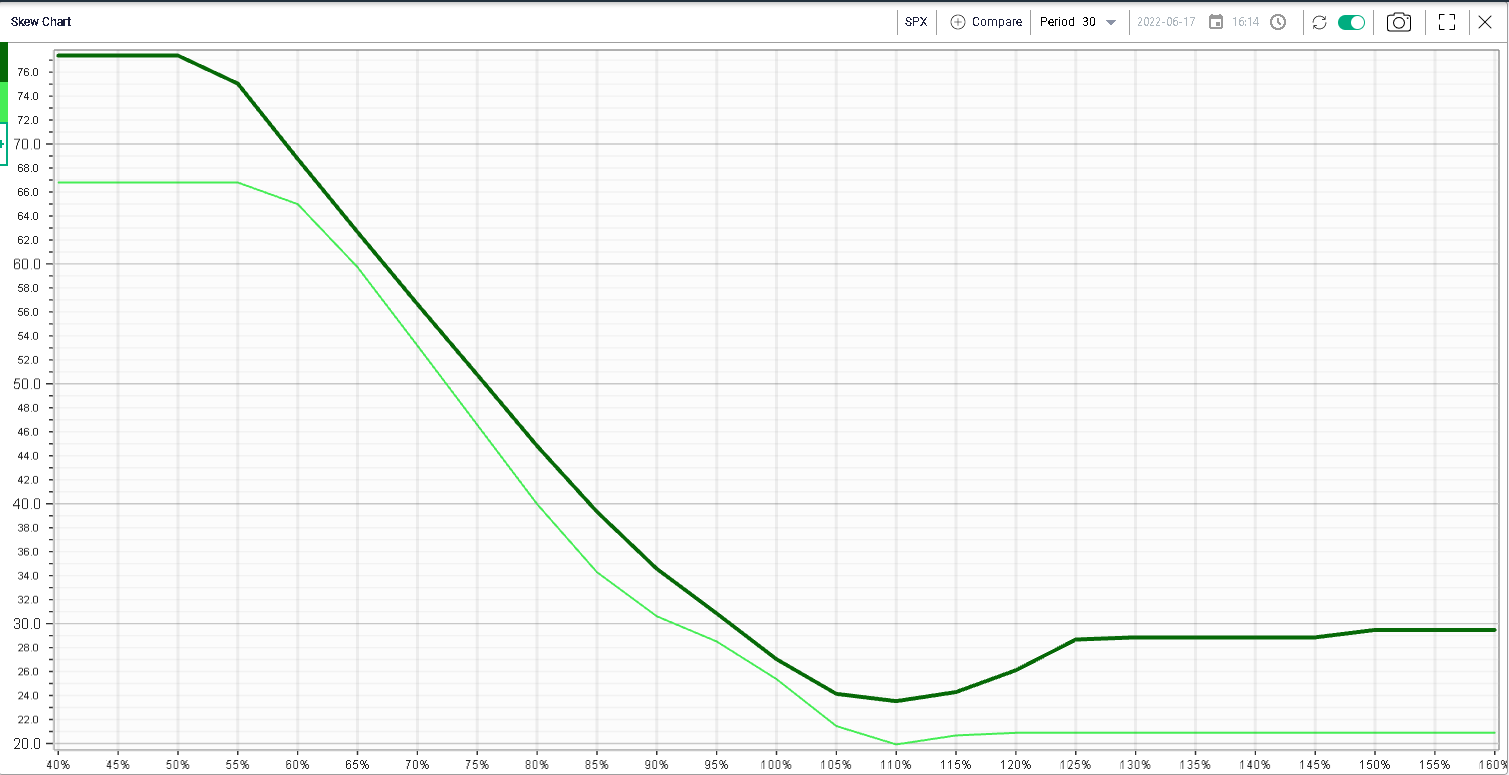
Looking at 30d skew, we can see that IV outperformed on the week for slightly out of the money calls compared with slightly out of the money puts with the light green curve as of the 10th Jun’22 and the dark green curve as of the 17th Jun’22. |
|
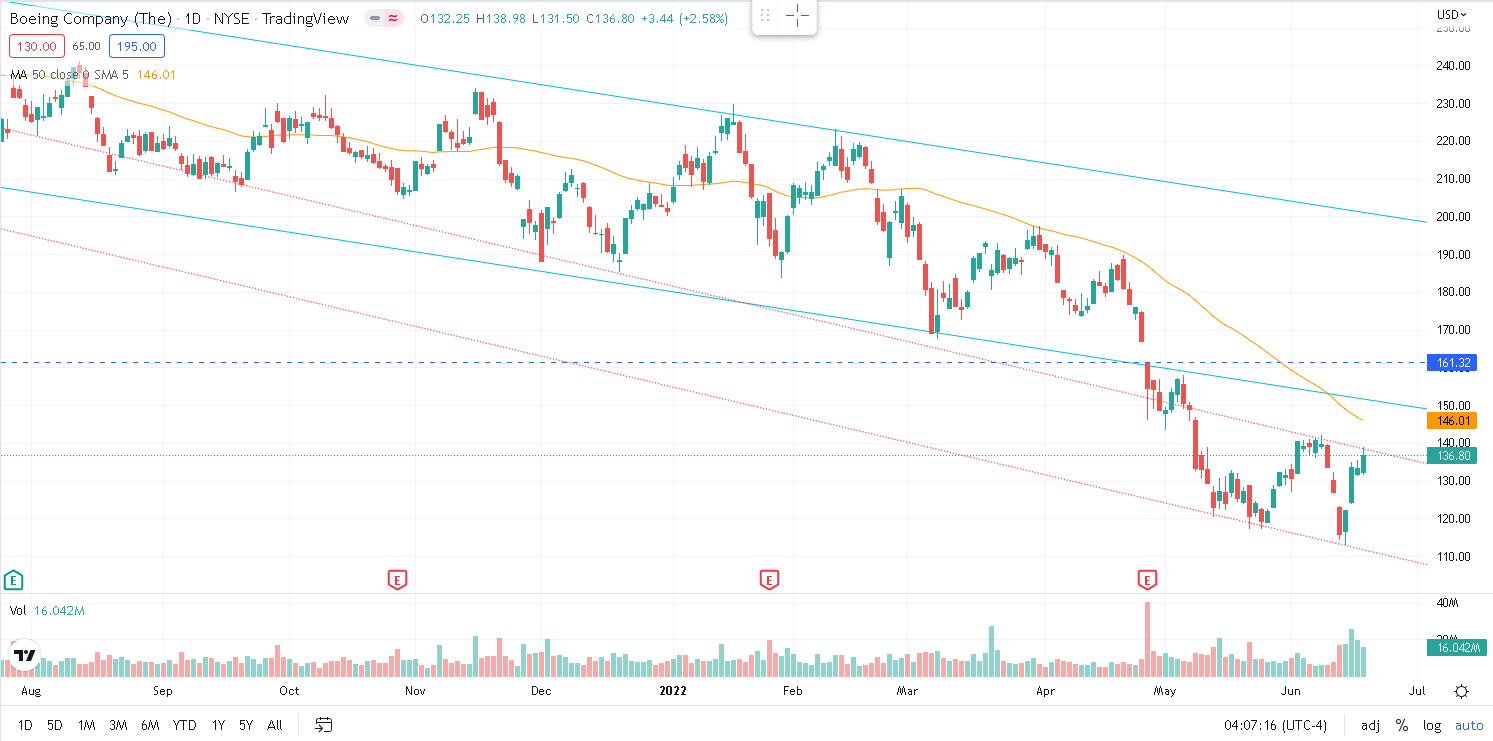
Within the DJIA, one name stood out on the week, it was BA as the company managed to gain almost 7.5% significantly outperforming the rest of the market. The stock remains a strong underperformer over the year losing more than 34% but it is important to note that unusual performance for this week. |
Technically, BA broke the blue channel which it had managed to hold for almost 12 months. That break happened on earnings and with significant volumes and the pullback over the following few sessions that failed to see us reintegrate the channel is a sign that the market has acknowledged and accepted that break. |
Source: Tradingview.com |
As a result, traders may well be trying to establish a new range, displayed in the dotted red lines although we do note that the move last week with three consecutive gaps that have been closed this week may have looked like capitulation. The fact that we bounced with a gap on Wednesday, could be a sign that investors are getting impatient to snap this stock. |
On the upside, the first level to watch will be $140 which marks the last local highs made by the stock. The bottom end of the blue channel will also probably continue to be a zone where bulls and bears fight each other. The large gap at $167 will remain a highly visible target for bulls so it will be one to watch should the stock continue its bounce. On the downside, we need to watch if the red dotted channel is confirmed over the next week. Should it be the case, then it would be a sign that the stock might remain in a downtrend for now with recent local lows an obvious target for bears. |
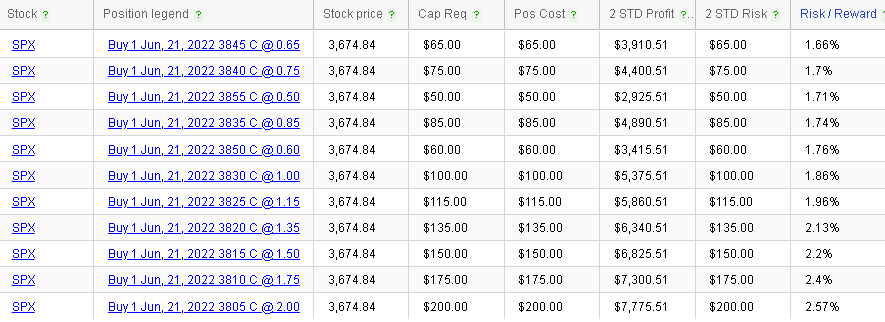
Looking at the RT Spread Scanner for strategies that might allow us to express a bullish or bearish view in the SPX over the next few days, we find the following suggestions. |
|
|
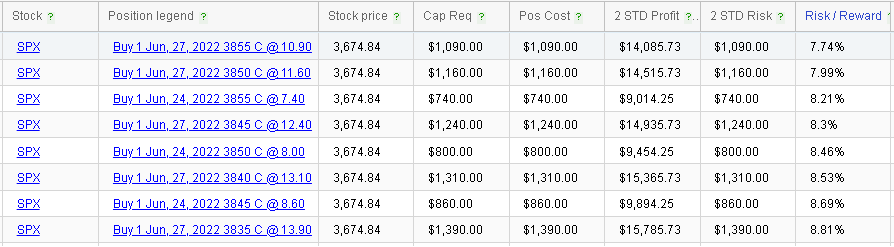
The system recommends both some very short dated options with calls expiring on Tuesday (as a reminder US markets will be closed on Monday) costing only $65 for a potential $3,910 2 standard deviation profit. It also recommends looking at the 27th Jun’22 3855 calls, costing $1,090 for a possible 2 standard deviation profit of $14,085. |
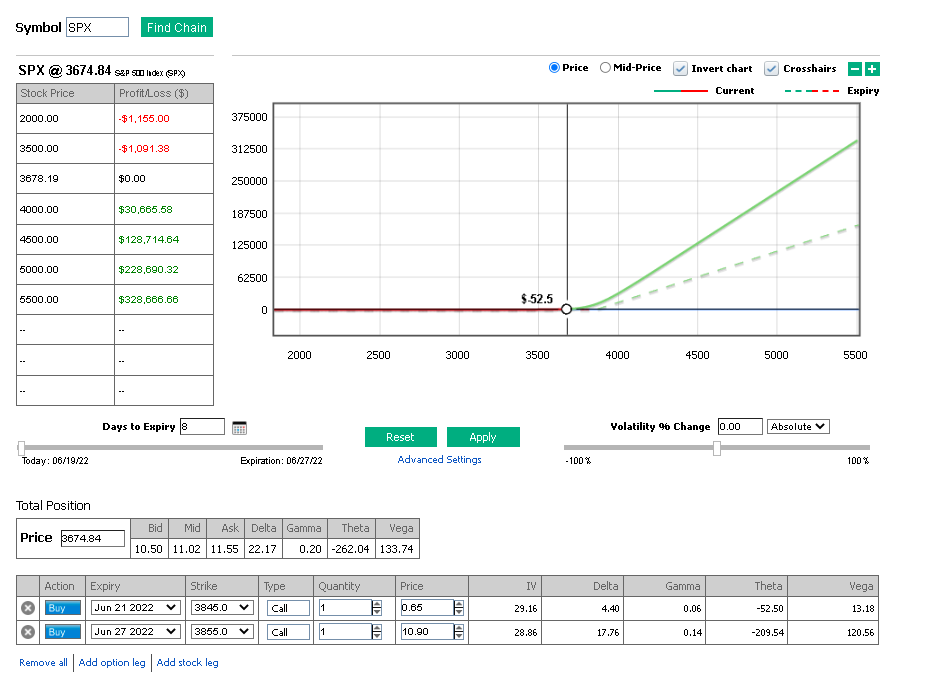
When trading such short-dated options, it is very important to have a clear understanding of the exit points you want to consider as this type of option will lose value very quickly should nothing happen. |
|
Using the PnL Calculator, we can see our expected payoff in the top-right chart. Using the spot price change highlighted in red, we can find that, should the underlying price reach $3,730, we would expect to double the premium of the option, in others words we would make a return of 100% on those. |
On the other end, should the SPX get back to its Friday’s lows around 3630, we would expect to lose 50% of the total premium invested in those calls. |
Naked Puts |
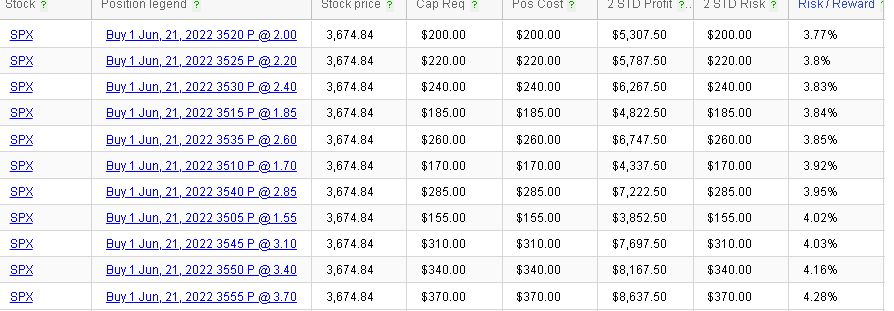
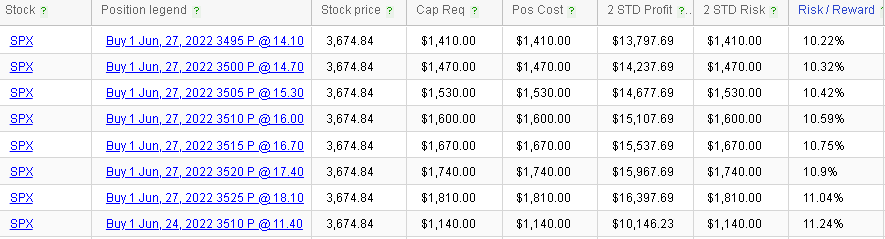
Looking at puts, the system is once again able to recommend very short dated options expiring on the 21st Jun’22 or options that have a little bit more time until expiration and that expire on the 27th Jun’22. |
|
|
A trader looking to perform a complete analysis should then turn to the PnL Calculator to evaluate the optimal exit points depending on the trader’s expectations for profitability and risk for a given trade. |
Disclaimer - This information is provided for general information and marketing purposes only. The content of the presentation does not constitute investment advice or a recommendation. IVolatility.com and its partners do not guarantee that this information is error free. The data shown in this presentation are not necessarily real time data. IVolatility.com and its partners will not be liable for any loss or damage, including without limitation, any loss of profit, which may arise directly or indirectly from the use or reliance on the information. When trading, you should consider whether you can afford to take the high risk of losing your money. You should not make decisions that are only based on the information provided in this video. Please be aware that information and research based on historical data or performance do not guarantee future performance or results. Past performance is not necessarily indicative of future results, and any person acting on this information does so entirely at their own risk. |