Odd spot/vol divergence |
US markets started the week on a fairly strong foot following Monday’s holiday. The SPX gained 2.45%, the NDX pushed 2.49% higher and the DJIA finished 2.15% in the green. |
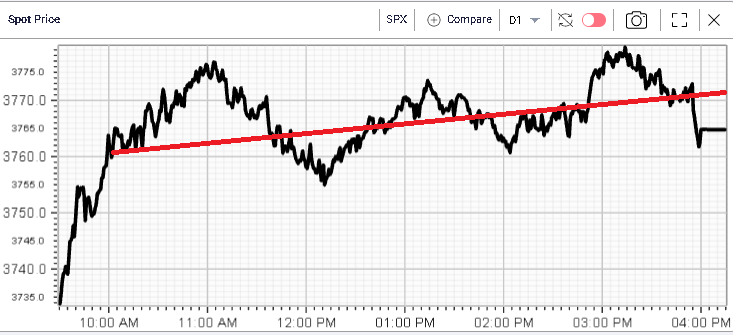
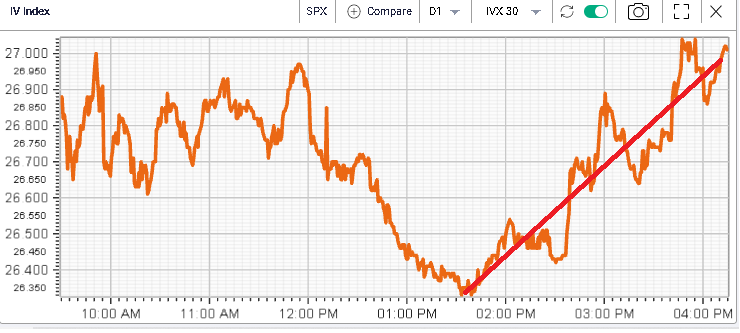
Looking at spot price and volatility, yesterday displayed a very strong divergence between implied volatility and spot prices as evidenced by the below charts, that started around 1.30/2pm EST. |
|
|
It is very interesting to see how the volatility market started to push higher at the same time as the spot market kept on rallying before dropping slightly into the close. |
The market’s focus in terms of options trading was on puts with 7 of the most active options traded being puts. Notably, the 30th Sep’22 3500 and 3400 puts traded respectively 19,840 and 18,972 times. For the 16th Sep’22 expirations, we also saw 11k+ of the 3770 puts and calls being traded, possibly as a strangle. |
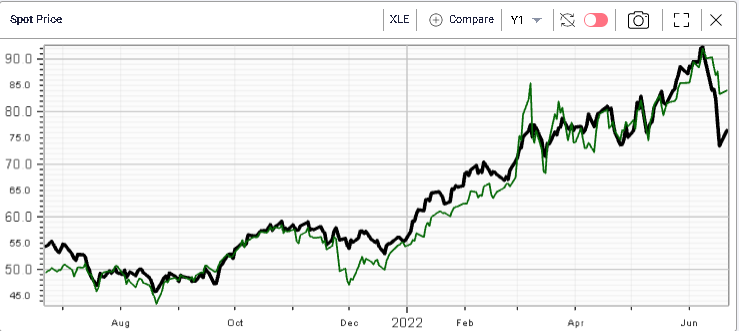
Looking at sectors, the Energy space outperformed on the day and slightly caught up with USO although the recent underperformance of equities vs commodities is still very visible. |
|
The sector gained about 5% on the day. Consumer discretionary stocks finished almost 3% in the green while the Communications sector lagged gaining a mere 0.7%. |
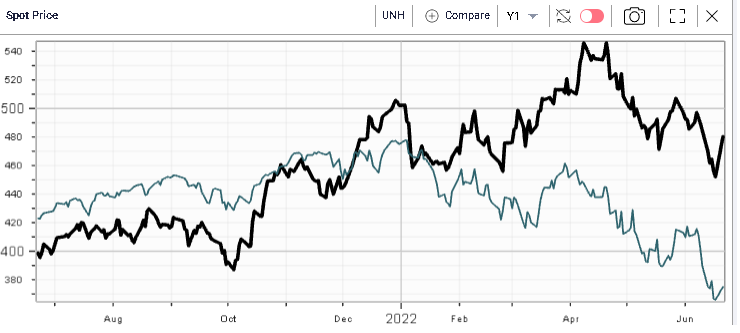
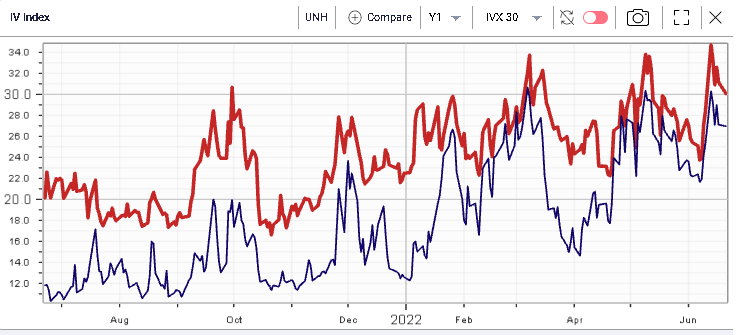
At the single stock level, it is worth noting the performance of UNH which gained 6.25%. The stock continues to outperform the SPX over the past 12 months, as shown on the below chart. |
|
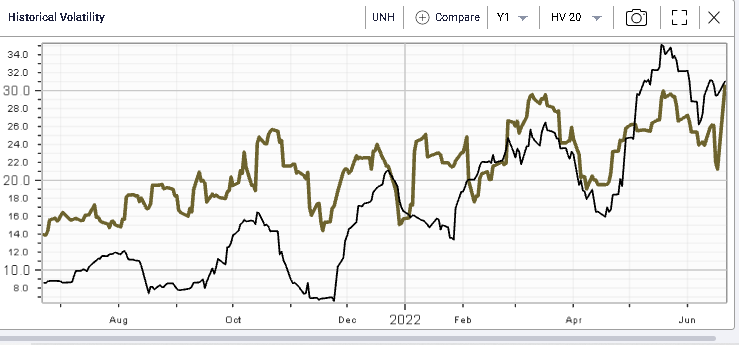
From an implied volatility perspective, things look slightly different with the stock still trading at a premium to the SPX. On the first chart below, we show in red the 30d implied volatility for UNH compared with the 30d implied volatility for the SPX in blue while on the second chart we have in yellow the 20d realized volatility for UNH compared with that of the SPX. |
|
|
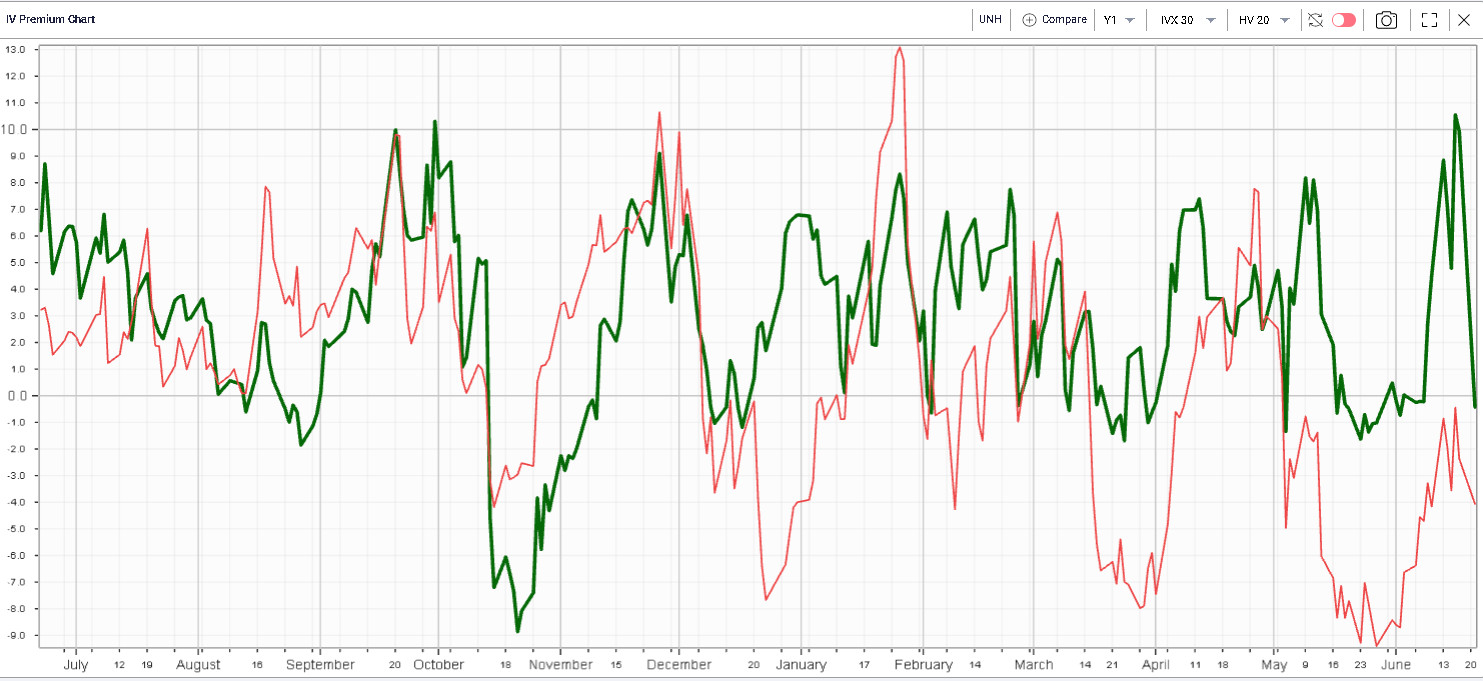
An even easier way to find the same result is to compare the IV Premium (30d/20d) of UNH and the SPX as displayed below. In green we have UNH while in red we have the SPX. We can see that when judged solely on implied vs realized, the SPX seems to offer better value than UNH. |
|
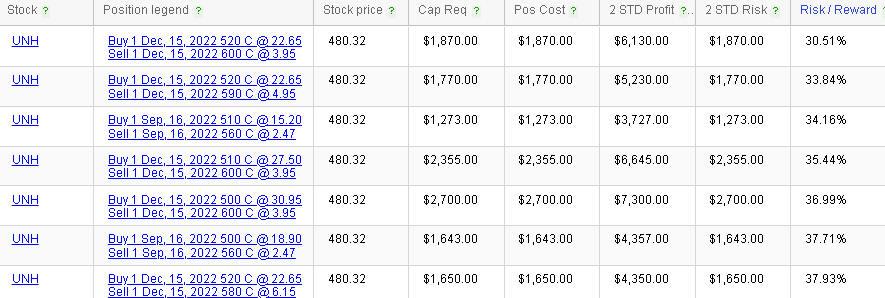
Traders looking to express a view in UNH may favor structures that are net flat options, for instance, bull or bear vertical spreads. |
For instance, using the RT Spread Scanner, we can retrieve the below suggesting the best possible call combination to construct a bull vertical spread. That combination is evaluated based on the 2 standard deviation risk compared with the potential 2 standard deviation profit. |
|
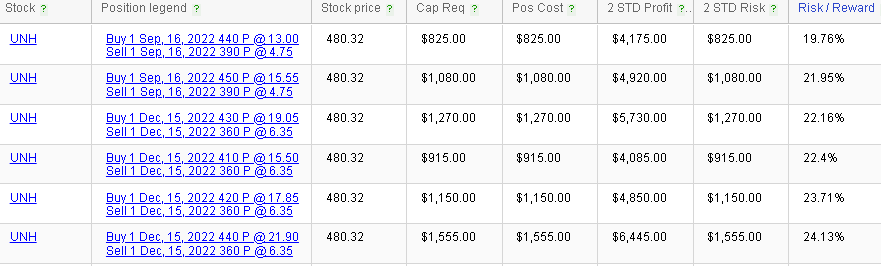
For bearish traders, we can retrieve the following |
|
The Risk/Reward column is particularly important as it quickly allows us to evaluate how much risk we need to take for each structure for a possible profit of $1. For instance, the first bull vertical spread, the Dec’22 520/600 have a risk of $30c for each potential $1 of profit. For the Sep 440/390 bear vertical spread, the risk is around $20c for each $1 of profit. |
Disclaimer - This information is provided for general information and marketing purposes only. The content of the presentation does not constitute investment advice or a recommendation. IVolatility.com and its partners do not guarantee that this information is error free. The data shown in this presentation are not necessarily real time data. IVolatility.com and its partners will not be liable for any loss or damage, including without limitation, any loss of profit, which may arise directly or indirectly from the use or reliance on the information. When trading, you should consider whether you can afford to take the high risk of losing your money. You should not make decisions that are only based on the information provided in this video. Please be aware that information and research based on historical data or performance do not guarantee future performance or results. Past performance is not necessarily indicative of future results, and any person acting on this information does so entirely at their own risk. |