High and Low Volatilities |
US indices finished pretty much unchanged yesterday but far more happened under the surface. Following a fairly strong session on Monday, the overnight price action was extremely poor and the market faded the entire rally leaving US traders with the SPX around 3700 minutes before the open. |
We then proceeded to rally 80 points, pretty much in a straight-line before some resistance was encountered in the 3780-3800 area. SPX traded around for the rest of the day and settled around 3760. |
Looking at sectors, the XLE almost completely reversed the gains seen on Monday finishing 4% lower on the day, a drop pretty much in line with the drop in Crude Oil. Materials also underperformed losing 1.3% on the day while on the upside, the healthcare sector gained on average 1.39% and the utilities finished 1.05% in the green. |
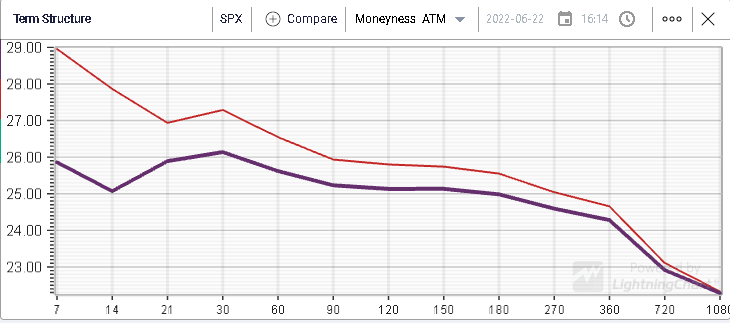
Implied volatilities shifted lower, led by the front-end with weekly implied volatility losing 3 points on the day and 1 month IV dropping a full point yesterday as well. |
|
As a result, for the SPX, we remain below the 30% mark for 30d IV which we flagged a few weeks ago and that has acted so far this year as a meaningful psychological level for option traders. |
|
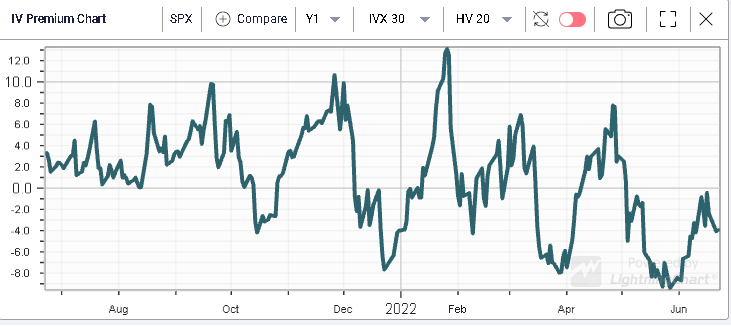
If we look at the IV Premium across all of the DJIA components, 21 of the 30 components of the index are currently trading with an IV Premium (30/20) which is positive. The average positive IV Premium (30/20) is 4.5 points, a fairly decent premium that is not visible at the index level as shown below with the SPX 30/20 IV Premium historical chart currently around -4 points. |
|
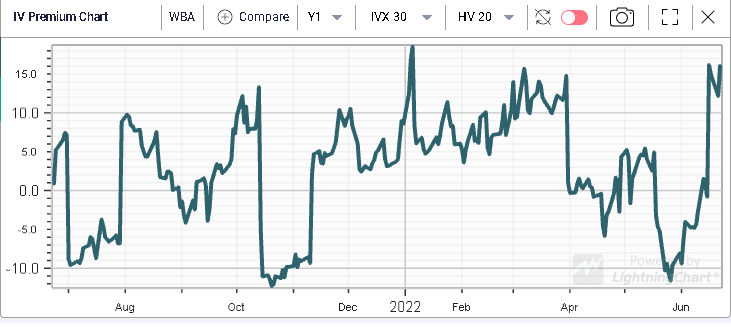
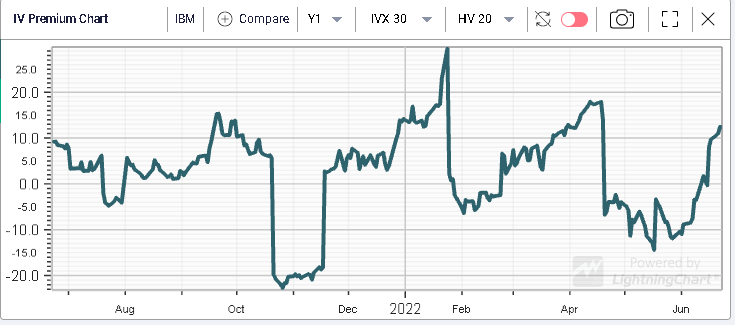
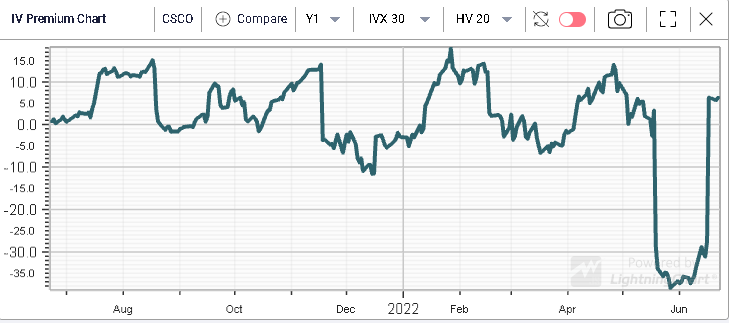
The three stocks that are displaying the highest IV Premium (30/20) are WBA with 16 points, IBM with 12.5 points and CSCO with 6.3 points. |
For WBA, we can see that the IV Premium is now trading at its highest level off the past 12 months. |
|
For IBM and CSCO it remains far off the 12 months highs but still has pushed higher by a decent amount. |
|
|
There are plenty of reasons why such a premium could exist, for instance with IBM and WBA, we will be getting earnings over the next 30 days which explains why options traders are willing to pay a premium for those options. |
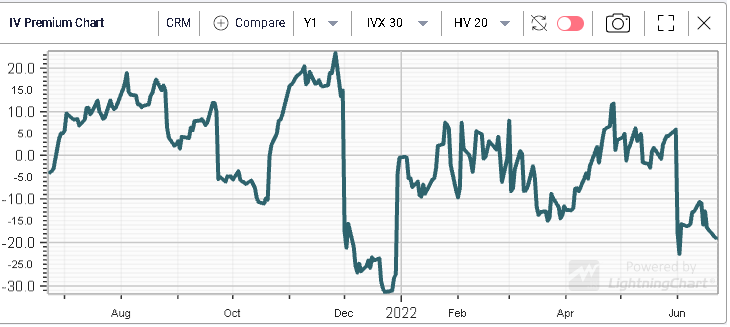
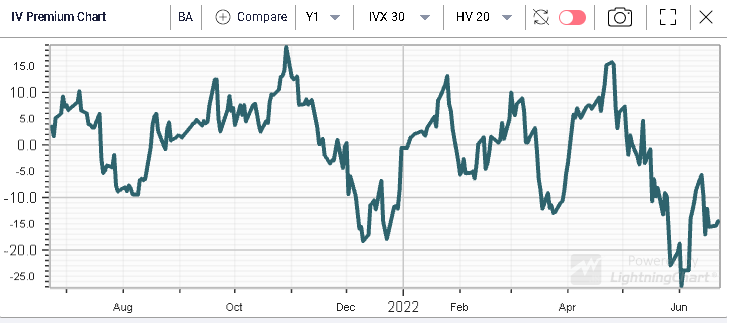
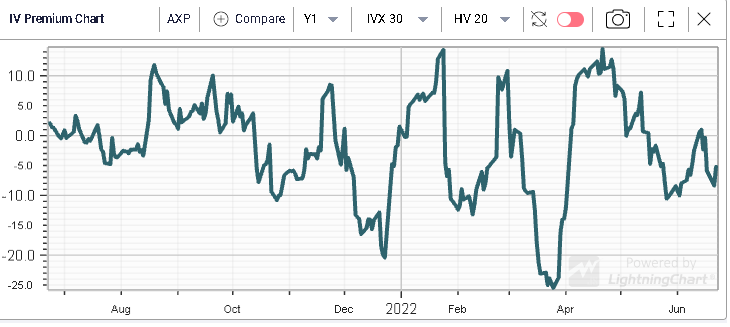
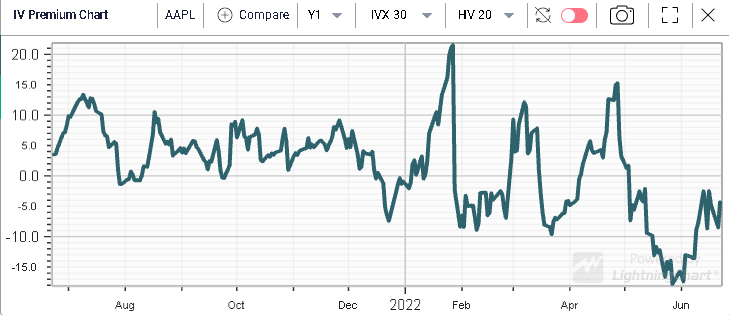
On the other hand of the spectrum, we get companies like CRM, BA, AXP and AAPL where options traders are showing respectively -19 points, -14.5 points, -5.2 points and -4.3 points for the IV Premium (30/20). |
We show below the 12 months history of those IV Premium. |
|
|
|
|
This work is important when trading options because it helps you think about how you can express a view on the stocks that you like. Â If you find that volatility looks relatively attractive, then you should not mind owning options. On the other hand, if you find that volatility looks rich, you should not mind selling options. |
For others, who like to focus on a more systematic approach, they will find that opportunities are constantly changing. For instance, a trader who sells out of the money puts or calls in order to try and collect the premium on options where implied volatility looks rich will have to jump from one stock to the next in order to chase the opportunities provided by market conditions. |
Once you understand your methodology and are able to clarify the process you want to follow, IVolLive can be of tremendous help. We’ve helped thousands of retails investors find the right information within our platform over the past few years and we would love to help you too. |
All our customers are entitled to a free complimentary call per year with one of our experienced options traders. Do not hesitate to write to us on support@ivolatility.com and book a session today. |
Disclaimer - This information is provided for general information and marketing purposes only. The content of the presentation does not constitute investment advice or a recommendation. IVolatility.com and its partners do not guarantee that this information is error free. The data shown in this presentation are not necessarily real time data. IVolatility.com and its partners will not be liable for any loss or damage, including without limitation, any loss of profit, which may arise directly or indirectly from the use or reliance on the information. When trading, you should consider whether you can afford to take the high risk of losing your money. You should not make decisions that are only based on the information provided in this video. Please be aware that information and research based on historical data or performance do not guarantee future performance or results. Past performance is not necessarily indicative of future results, and any person acting on this information does so entirely at their own risk. |