A very important half-year end next week |
In last week’s technical update, we discussed the SPX selloff which was sending signals that it was getting overextended in short run. This week saw a solid bounce from the lows with the SPX gaining around 6.5%, the NDX up almost 8% and the DJIA up 5.5%. The solid performance over in the US was fairly unique as other regions struggled on the week. Europe lagged with very dislocated performances across the board. The French CAC gained slightly more than 3% on the week while the German DAX trailed and was largely unchanged. |
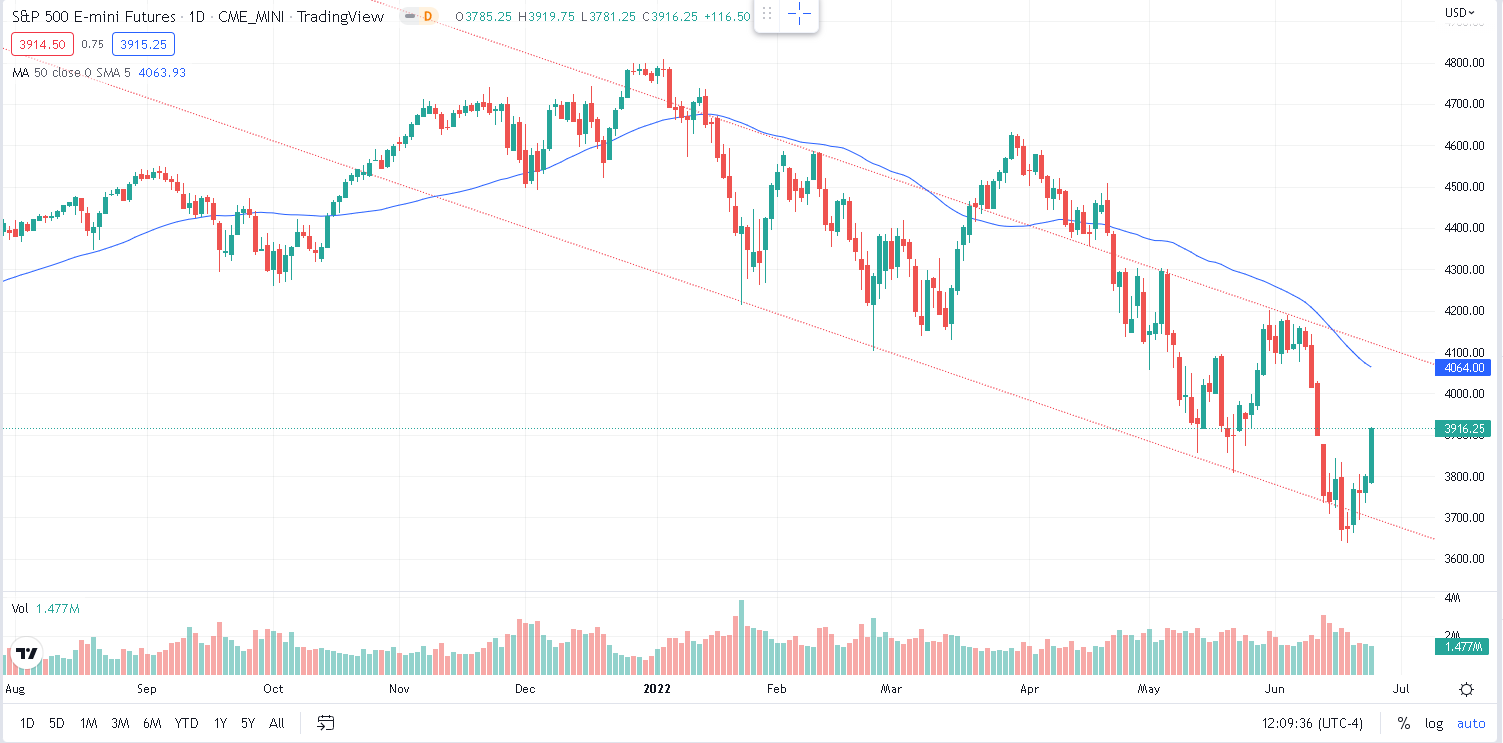
Looking at ES Futures technicals, we have now reintegrated the downtrend channel that was seen as at risk at the end of last week. |
Source: Tradingview.com |
The 50day moving average is also trending down against the upper bound of the channel in the 4050-4100 area. Given the strength of the move seen last week this area will represent a zone of attention and attraction for many traders. Looking at the waves we described in last week’s technical update, a break of 4180-4200 would be seen as an invalidation of the downtrend and as such give confidence to bulls that the correction may have been completed. |
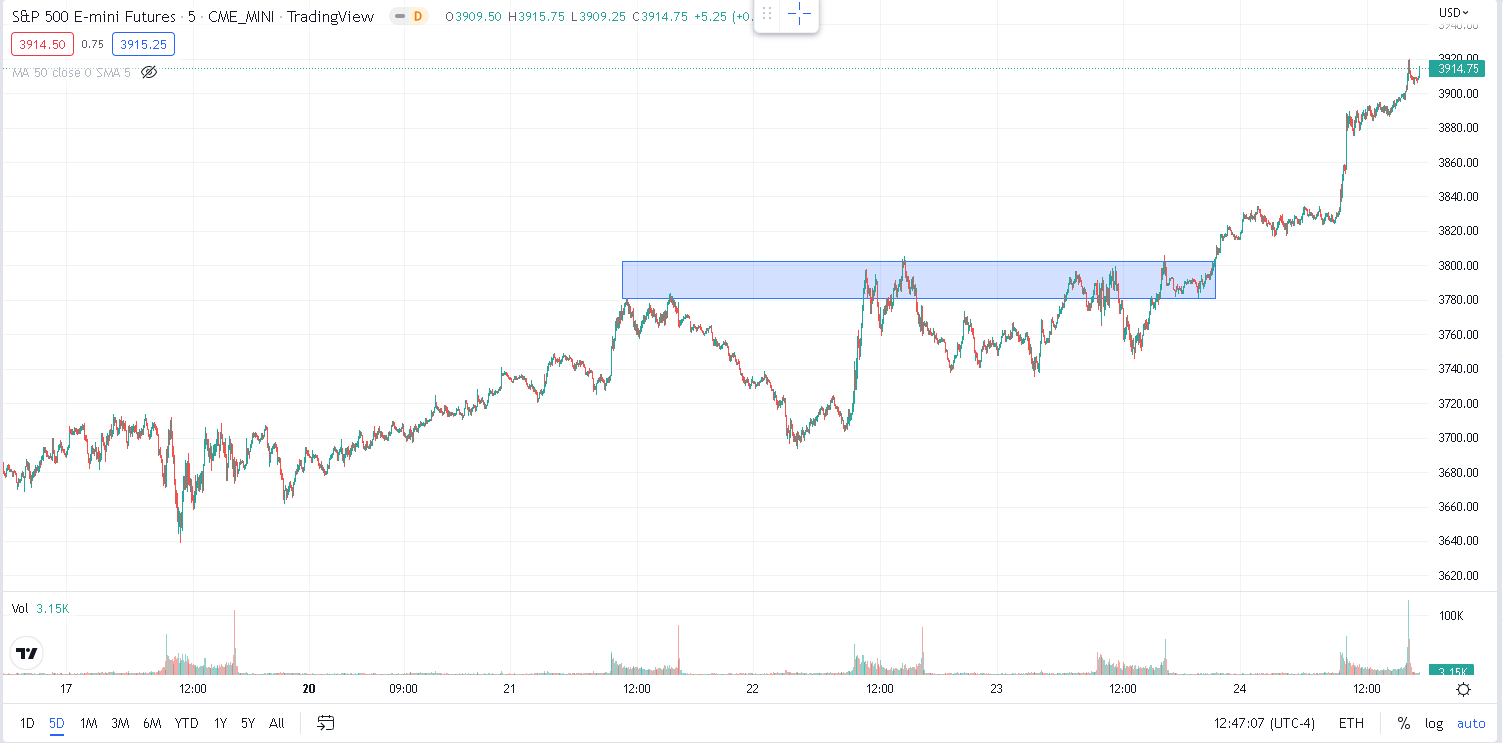
The key area over the past week was the zone around 3800 where bulls and bears fought for three consecutive days before bulls managed to get the upper end in the overnight session on Thursday. |
Source: Tradingview.com |
We flagged the 3800 area on the way down as one that mattered for the overall momentum of the market. It was the lowest point reached during the third wave and the break lower of that level gave confidence to bears that the market had further to go on the downside. |
After finding support around 3650, the market started to pullback towards the level of the break, which is a fairly common trait of selloffs (or rallies) and from 3650 to 3800 it looked as if both bulls and bears agreed that it was not worth fighting over such a pullback. The market proceeded to rally during the US public holiday on Monday and reached 3800 by the open on Tuesday. |
The blue rectangle was the only zone where bulls and bears tried to argue because it reflected different interpretations for each camp. For bulls, a break above that level was a key condition for them to gain confidence that this bounce had some legs and could extend beyond what a simple pullback would offer. For bears, keeping ES under that area was necessary because it would reduce the impact of this up-move to a mere pullback allowing them to add to their shorts. |
As it turned out, overnight on Thursday the market breached the level on very little volume. Bears gave up almost instantly at the market open and Friday saw a typical bottom left, top right price action with the market finishing at the highs. |
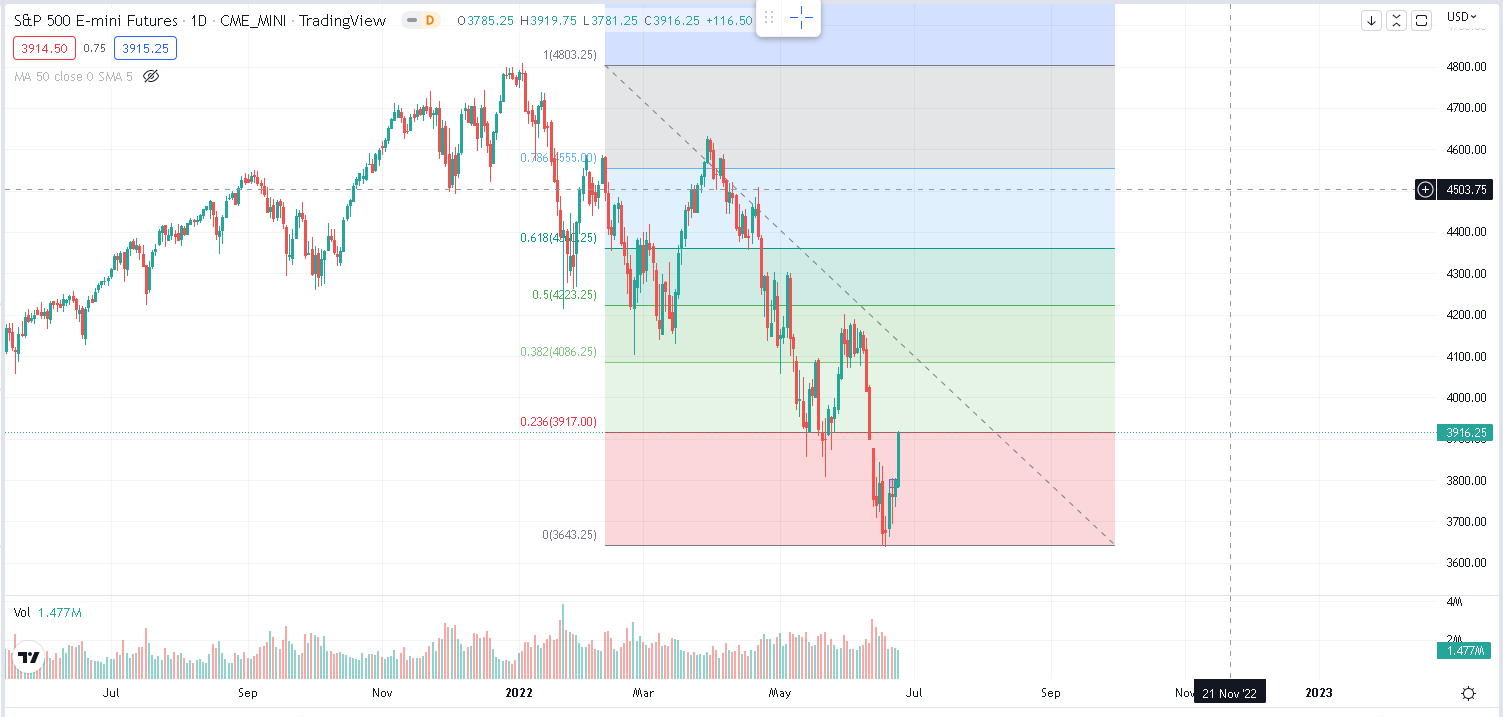
In terms of target for next week, the trend channel highlighted in the first chart above will play a key role should the market manage to get there. On the downside, the Fibonacci retracements of 2020-2022 highlighted a few weeks back remain in play around 3500 and 3200. In the short term, should the market rotate back lower, we should expect some action around the 3650 level. |
On the upside, the 2022 high-low range Fibonacci retracements could provide some indication. For instance, we note that Friday we stopped right around the 23.6% retracement. Next levels are seen at 4086 for the 38.2% level and 4223 for the 50% level. The 4200 area will be very important for bears as it is the last local high where they managed to stop bulls’ advance. Should we break 4200, bears’ confidence in the move lower would probably be shaken. |
Source: Tradingview.com |
To finish, let’s look at the flows that were seen over the past week across the SPX skipping Monday which was a holiday in the US. |
On Tuesday, Wednesday and Thursday, the majority of the large flows was concentrated towards the put side. We saw on Tuesday around 19,840 of the 30th Sep’22 3500 puts and 18,972 of the 30th Sep’22 3400 puts exchange hands. |
There were also 11,149 of the 16th Sep’22 3770 puts and 11,078 of the 16th Sep’22 3770 calls that traded, most likely as a straddle. |
On Wednesday, the only notable flow for the SPX was the 9,878 of the 30th Jun’22 3800 puts that traded while on the call side nothing really stood out. Thursday looked fairly calm form an options flow perspective and its only on Friday that we got another big trade with 10,738 of the 15th Jul’22 4,000 calls that traded. |
Many more options traded throughout the week, some with far greater volumes than the ones we highlight here but those generally exhibit very short dated maturities and premiums and as such do not convey much about the market’s view. |
The way flow was distributed over the week was thus fairly interesting with the attention mostly on puts until the break of 3800 happened overnight on Thursday. The attention then turned to upside calls on Friday and it will be interesting to see if this continues on Monday. |
With month end next week, traders and investors have an opportunity to take a step back and reevaluate how their year is going and where they expect the market to move over the next few months. As such, this week will be very important as some large flows can be anticipated considering the amount of action that was witnessed in H1. |
Disclaimer - This information is provided for general information and marketing purposes only. The content of the presentation does not constitute investment advice or a recommendation. IVolatility.com and its partners do not guarantee that this information is error free. The data shown in this presentation are not necessarily real time data. IVolatility.com and its partners will not be liable for any loss or damage, including without limitation, any loss of profit, which may arise directly or indirectly from the use or reliance on the information. When trading, you should consider whether you can afford to take the high risk of losing your money. You should not make decisions that are only based on the information provided in this video. Please be aware that information and research based on historical data or performance do not guarantee future performance or results. Past performance is not necessarily indicative of future results, and any person acting on this information does so entirely at their own risk. |