Single stock vols drift higher |
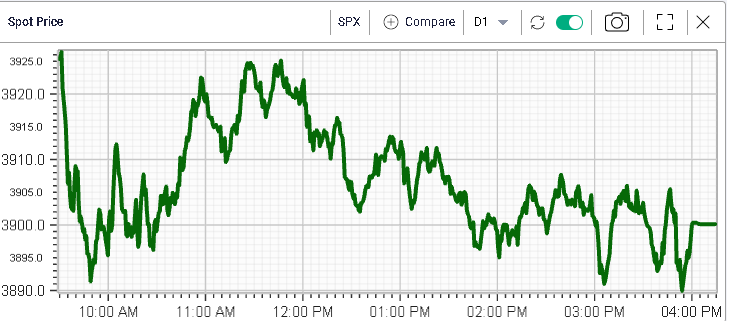
Markets consolidated yesterday in a fairly tight range with a high print around 3925 for the SPX and a low print around 3890. The index settled 0.3% in the red on Monday. |
|
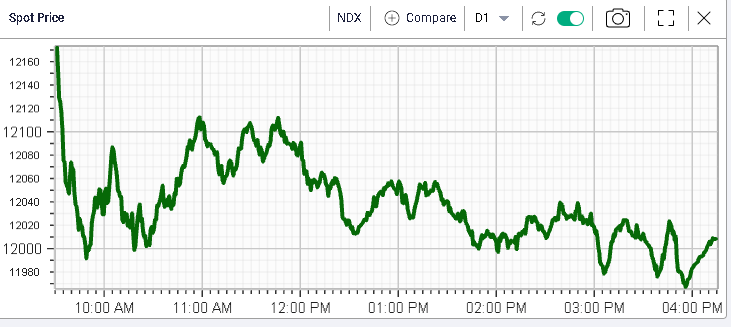
Same picture for the NDX which traded with a high print around 12160 and a low print around 11970. The Index finished 0.8% lower on the day. |
|
Flows in options were fairly quiet considering the recent activity we have seen but it is still worth noting that a decent number of trades were executed on short dated downside puts for the SPX. For instance, the 1st Jul’22 3600 puts traded 14,884 times alongside the 3625 puts which traded 14,433 times. The 3400 and 3375 puts with expiration 29th Jun’22 traded respectively 13,220 and 11,718 lots. |
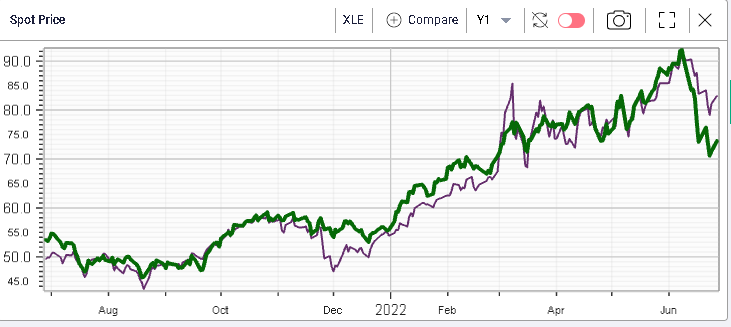
In terms of sectors, the outlier was the Energy space which gained almost 3% driven by Crude prices moving higher again. |
The gap between equities and the underlying market remains for now. |
|
The rest of the sectors were fairly muted with performances ranging from -1% for the Consumer Discretionary space as well as Communications to +1% for utilities. |
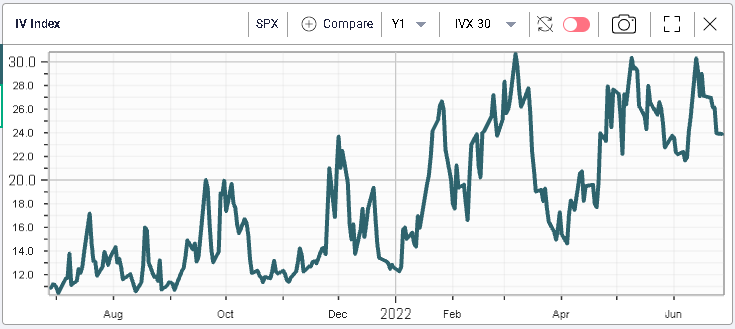
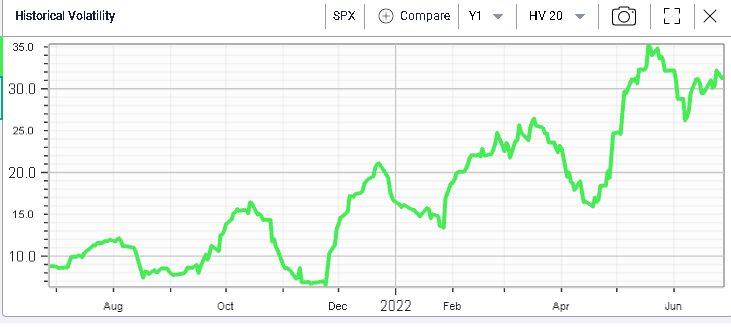
Implied volatilities stabilize and have dropped recently albeit at a fairly slow pace as shown below with 30d IVX on the SPX. This is first and foremost driven by realized volatilities that remain supported for now with 20 days HV around 30 for the SPX. |
|
|
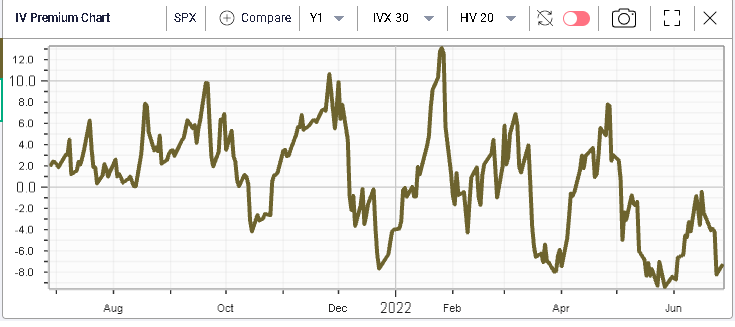
As a result, looking at the IV Premium chart for the SPX, we find that IV for the index is almost back at its lowest value compared with HV over the past 12 months. |
|
At the single stock level, the picture was fairly similar with all of the DJIA 30 components showing a performance between -2.5% and +2%. |
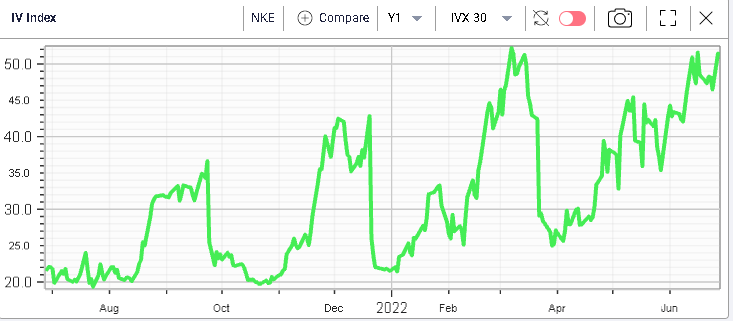
As June comes to an end, attention will slowly shift towards single stock stories again as earnings will take center stage. We discussed the highly anticipated NKE earnings that were released yesterday. It will be interesting to see how the stock trades on the day as the anticipation for a large move had grown over the past few weeks with short dated volatility drifting higher into the numbers. |
|
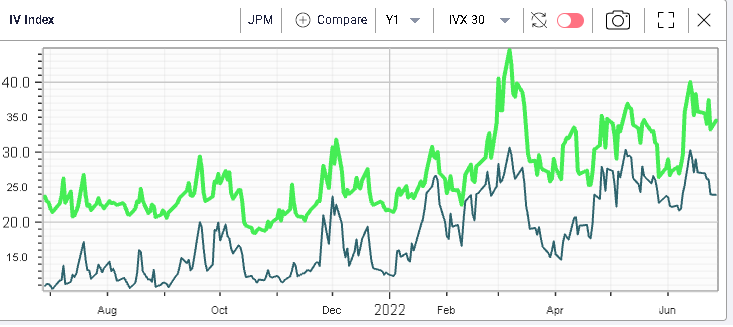
JPM is due to release numbers on the 14th Jul’22 which may seem far away but the implied volatility has already started to move higher as shown below with in green the 30d IVX for JPM and in blue the 30d IVX for the SPX. |
|
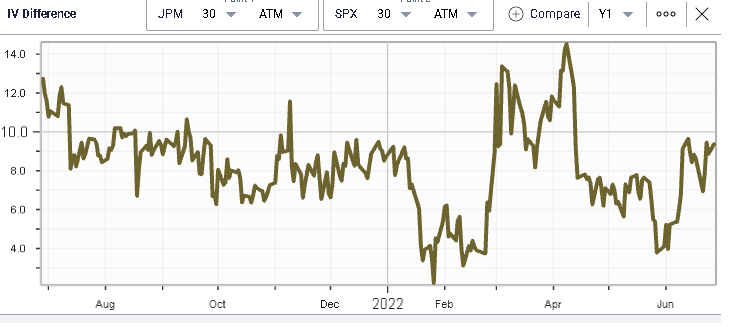
Using our newly released IV difference feature, we can build the following chart displaying the difference between the 30d ATM IV for JPM and the 30d ATM IV for the SPX over the past 12 months. |
The spread has increased recently but remains far off its extremes seen over the past year. |
|
Disclaimer - This information is provided for general information and marketing purposes only. The content of the presentation does not constitute investment advice or a recommendation. IVolatility.com and its partners do not guarantee that this information is error free. The data shown in this presentation are not necessarily real time data. IVolatility.com and its partners will not be liable for any loss or damage, including without limitation, any loss of profit, which may arise directly or indirectly from the use or reliance on the information. When trading, you should consider whether you can afford to take the high risk of losing your money. You should not make decisions that are only based on the information provided in this video. Please be aware that information and research based on historical data or performance do not guarantee future performance or results. Past performance is not necessarily indicative of future results, and any person acting on this information does so entirely at their own risk. |