Getting positioned for an up-crash? |
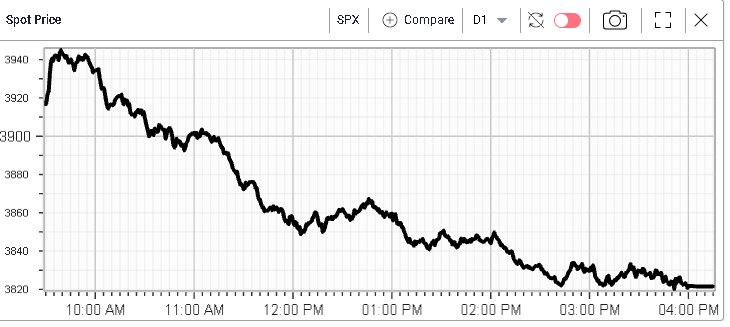
Headline indices reversed course yesterday and finished the day much lower than where they started. The SPX settled 2% in the red, the NDX 3% and the DJIA 1.56%. |
Spot and implied volatility traded in line throughout the session yesterday but it will come to no surprise to frequent readers of this market update that volatility has failed to realize on the downside over the past few months. Today we look in more details at this phenomenon. |
|
|
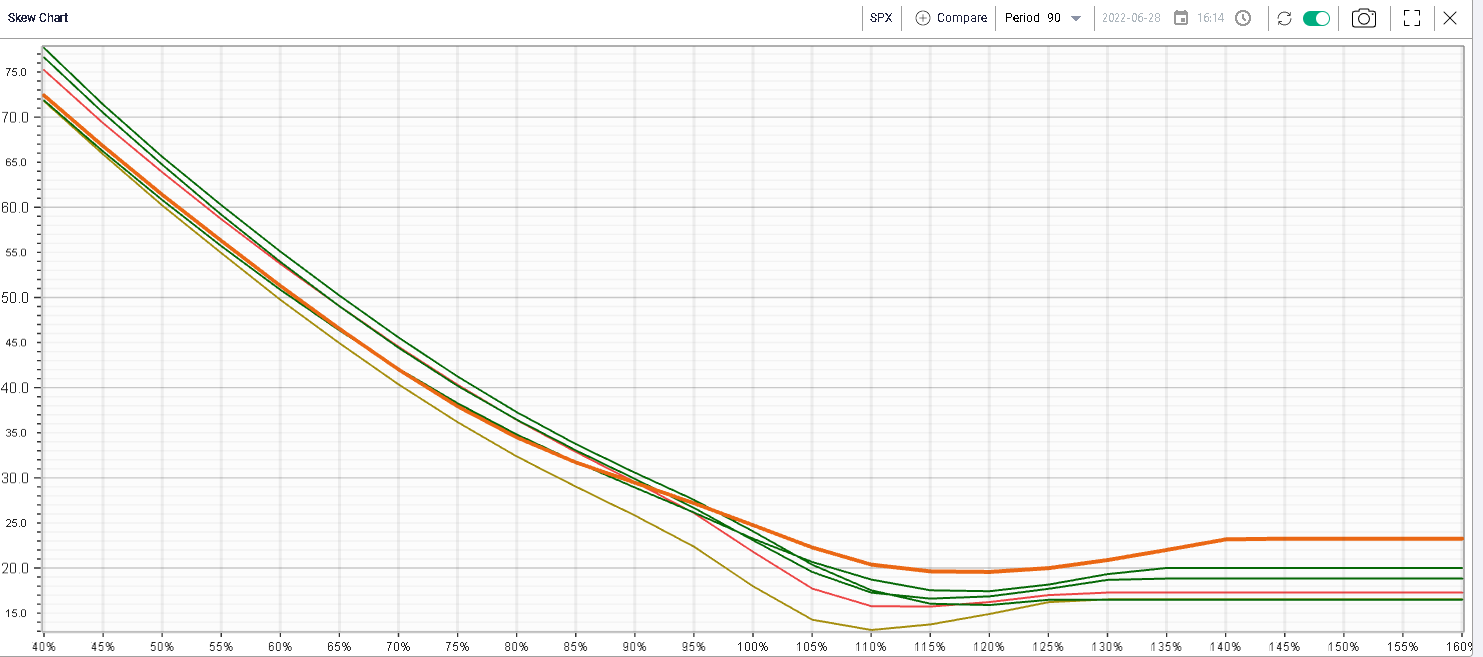
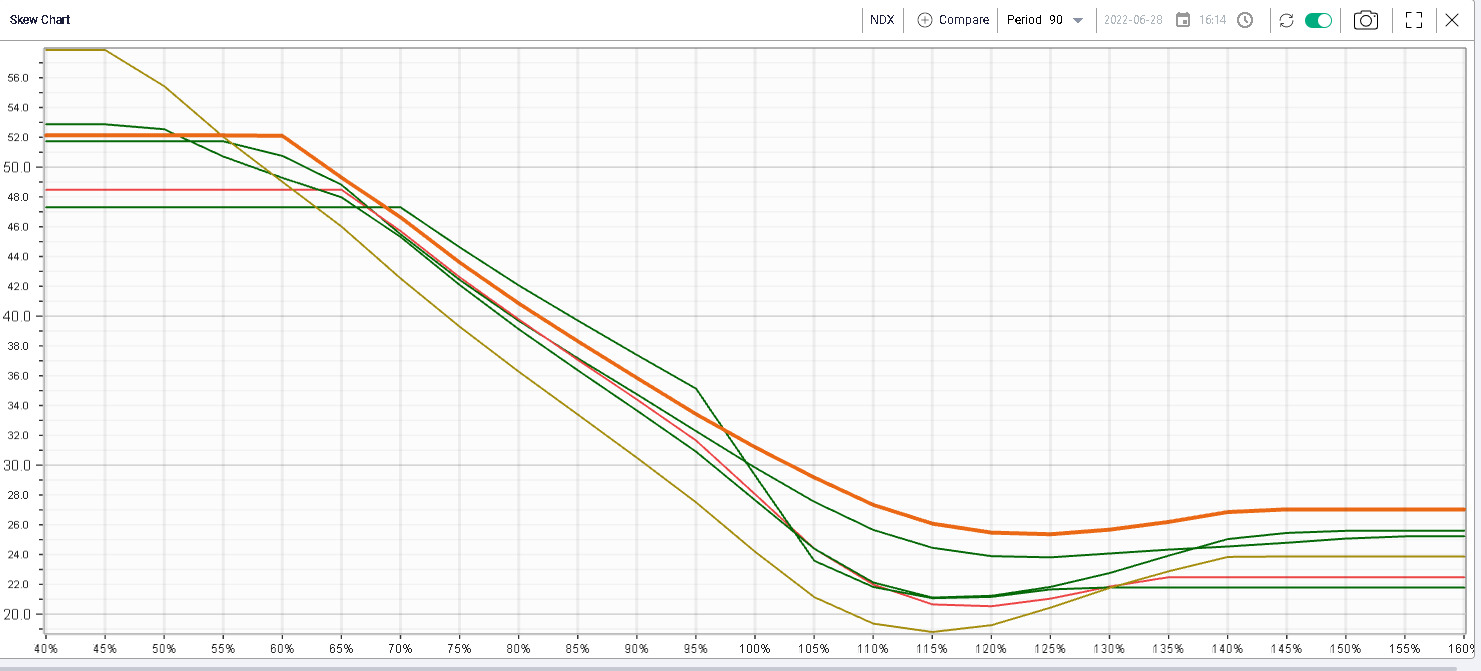
On the below chart, we display the skew curve for the SPX with a term of 90 days until expiration and for the last day of each month in 2022. |
|
The orange bold line is the current skew curve snapped as of the 28th Jun’22. |
A few points are worth mentioning here: |
|
Point 2 is very important because it echoes a phenomenon, we have highlighted on multiple occasions in the market update. Despite spot moving lower and continuing to reach lower lows, the volatility market has remained fairly calm about the prospects of a very large move lower. |
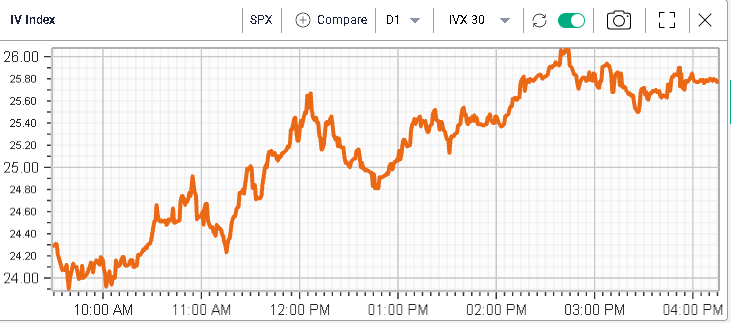
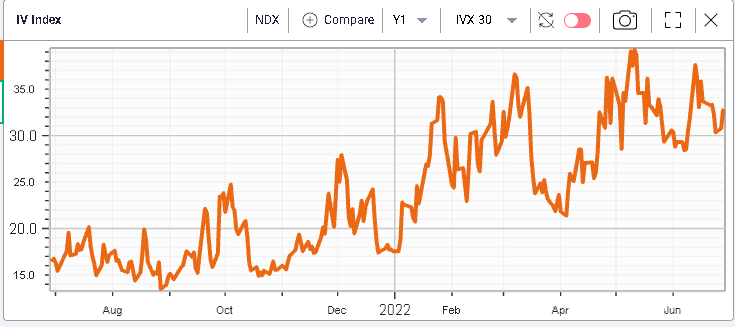
The below chart, displaying our proprietary 30d IVX index shows that we stalled at 30 every time we attempted to break it so far in 2022. |
|
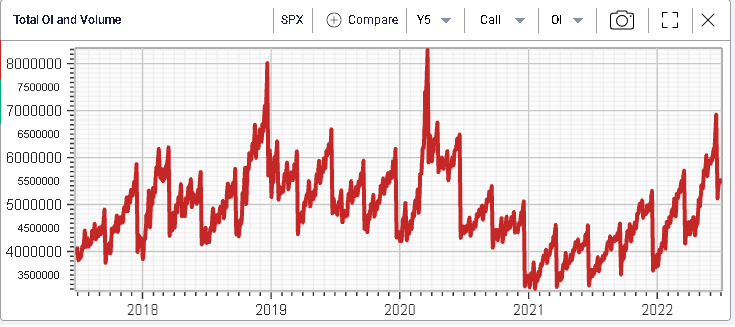
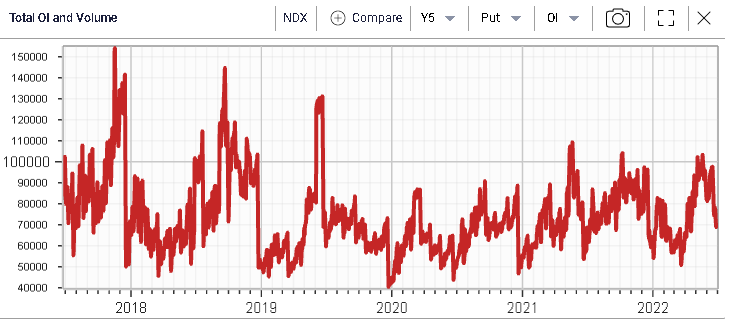
Looking at flows generally provides some useful insights as to what is happening in the market. Below we display a 5-year chart of the open interest for the SPX. |
|
Following the Jun’22 expiration, we are now pretty much back to where we were at the start of the year in terms of outstanding positions. |
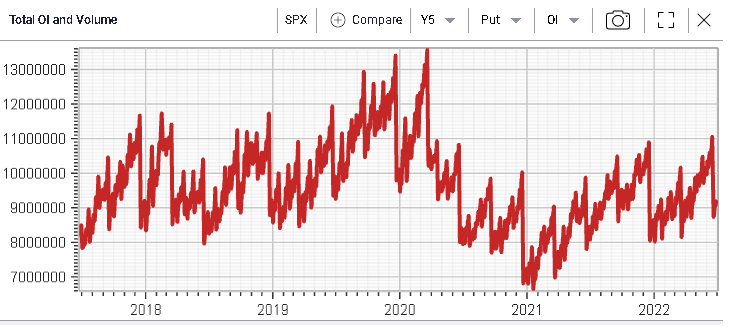
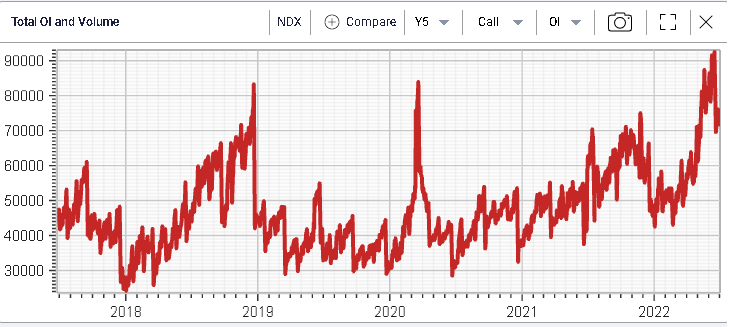
Calls on the other hand offer a completely different picture as shown below. Traders seem to have built positions that are still active on the call side. |
|
What hypothesis can we formulate in light of the flow analysis? |
First, it is likely that traders have used very short dated options to hedge themselves. We can postulate that this is the case as we see the open interest for puts going nowhere overall in 2022 despite decent weeks of accumulation seen on the volume side. |
On the other hand, calls have been in greater demand and expirations used seem to be longer than those used for puts. This is visible on the OI chart as the call OI continues to trend higher for the SPX options despite expiration dates. |
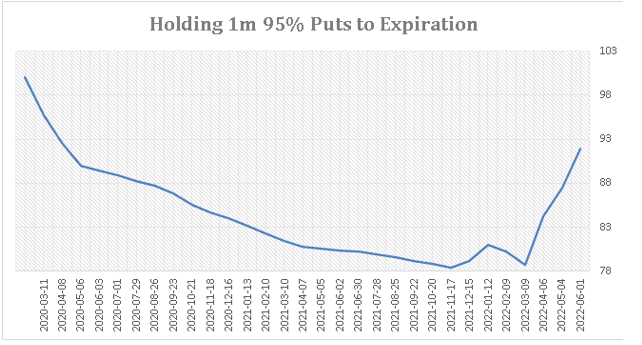
The below chart created using Ivolatility.com data, displays the performance of a long 30 days 95% put on the SPX held until expiration. This is the sort of strategy that traders would combine with a core long position for instance in order to reduce the overall risk of their strategy and we can see that the strategy has performed well in 2022 despite a long series of drawdowns following the pandemic in 2020. |
|
Let us turn to the NDX to see if the same is visible there. First on the NDX, the absolute level reached by our IVX index has not been as clear as for the SPX as we see below but the overall logic prevails, lower spots have not been directly associated with higher vols. |
|
Second for the Open Interest, upside calls have been accumulated on what looks like longer time horizons than puts. We see that the OI in the NDX has moved higher throughout 2022 while at the same time the puts OI has remained subdued and dropped significantly post Jun’22 expiration date. |
|
|
Looking at the evolution of skew shows a slightly different picture on the put side but for 100% options, we find that IV has continued to rise when evaluated once a month. |
|
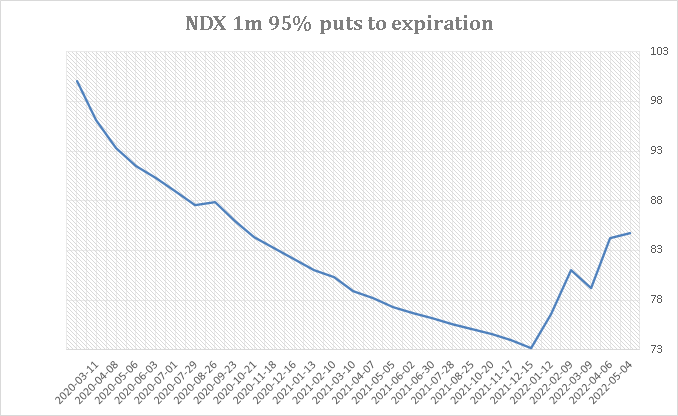
For upside options we also find that the IV has remained most expensive in the current period but contrary to the SPX, the cheapening of put options has not been as visible for the NDX. |
This has happened once again despite the fact that holding puts (here 1m 95% on NDX) has been an acceptable strategy in terms of performance in 2022. |
|
Overall, there seems to be a few reasons why market makers have remained happy to sell puts cheaper, especially on the SPX: |
|
Overall, it seems possible that the lack of performance of the skew curve can be attributed to the lack of interest and need for hedges. The fact that investors are now piling into upside calls is very interesting and might point to the fear that an “up-crash” might happen. Some media outlets were running stories recently pointing to the underweight in Equities chosen by many hedge funds. As such, owning upside calls would allow them to get exposure should the market suddenly move higher. |
Disclaimer - This information is provided for general information and marketing purposes only. The content of the presentation does not constitute investment advice or a recommendation. IVolatility.com and its partners do not guarantee that this information is error free. The data shown in this presentation are not necessarily real time data. IVolatility.com and its partners will not be liable for any loss or damage, including without limitation, any loss of profit, which may arise directly or indirectly from the use or reliance on the information. When trading, you should consider whether you can afford to take the high risk of losing your money. You should not make decisions that are only based on the information provided in this video. Please be aware that information and research based on historical data or performance do not guarantee future performance or results. Past performance is not necessarily indicative of future results, and any person acting on this information does so entirely at their own risk. |