Scanning for opportunities |
Markets stabilized yesterday with the SPX finishing down 0.07% on the day, the NDX was up 0.18% and the DJIA up 0.27%. |
Looking at sectors, Energy underperformed and finished 3.5% in the red. Financials, Industrials and Materials also lagged on the day finishing about 1% lower. On the upside, healthcare performed well gaining almost 1% on Wednesday while Staples up 0.6% were the second-best performing segment of the market. |
Within the DJIA, performance was contained between -2% and +2%. MCD was the best performing name posting a 2.02% gain on the session. Tech stocks were also amongst the best performers with AAPL up 1.3% and MSFT up 1.5%. GS also performed well gaining 1.3% on the day. |
On the downside, CAT was the worst performer settling 2.11% lower on the day, CVX also lagged finished 2% lower alongside AXP down 1.9%. |
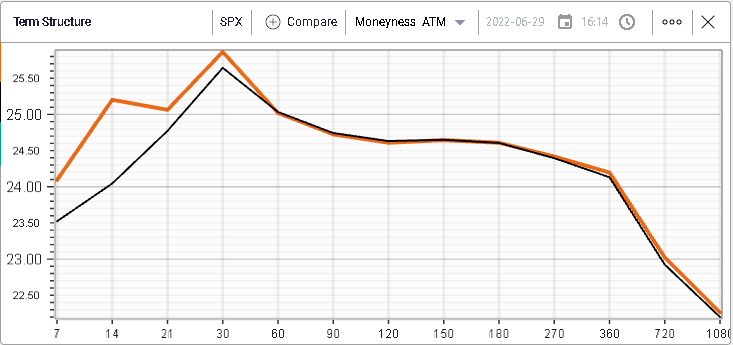
Implied volatilities were steady on the day with the front -end remarking slightly higher while the back-end was unchanged. |
|
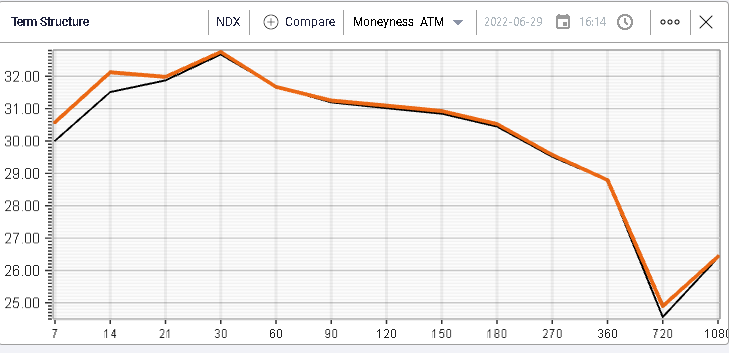
Same story for the NDX with short dated implied volatilities marked higher while longer dated did not budge. |
|
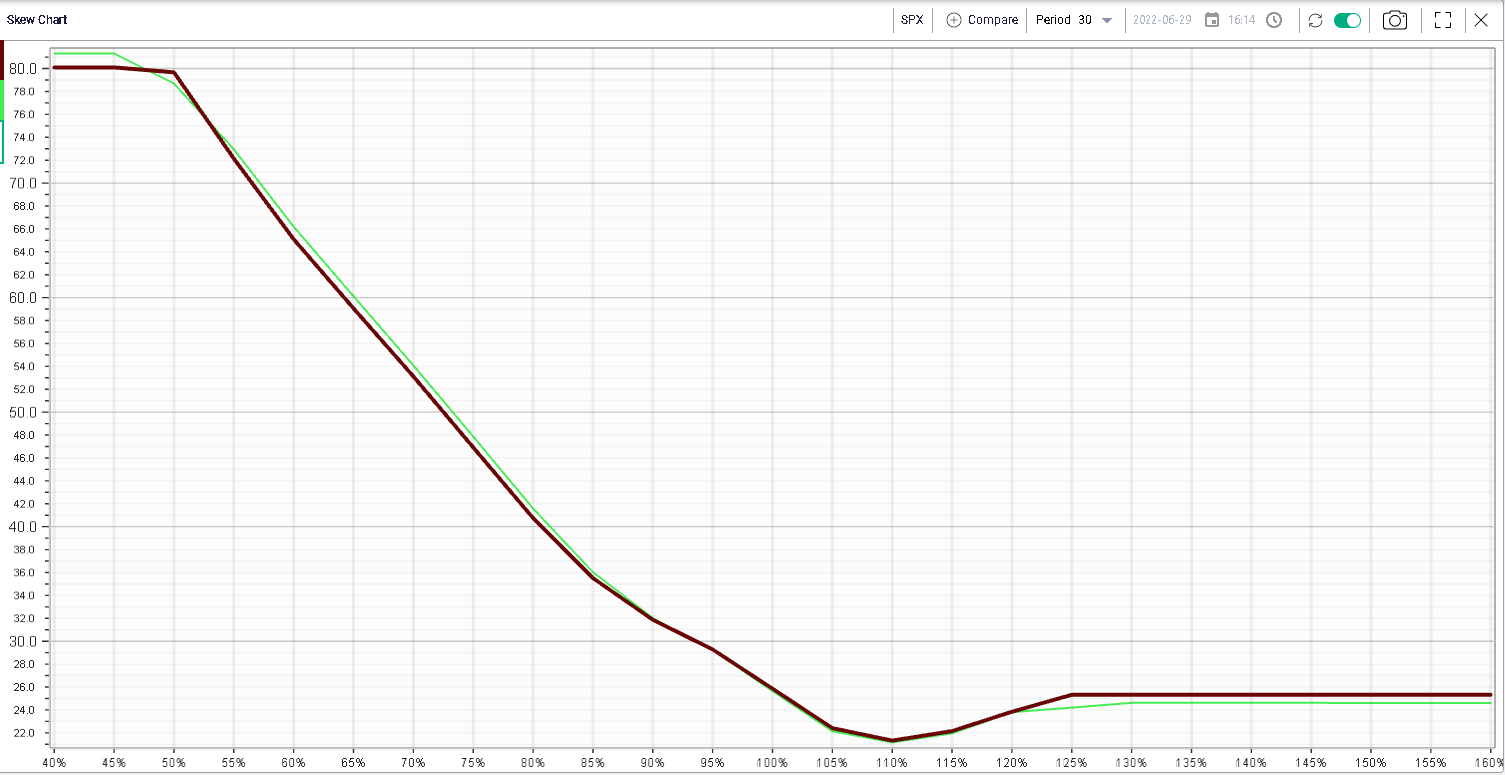
Looking at 30d skew for the SPX, the difference between the green light (Tuesday’s close) and the purple line (Yesterday’s close) is hardly visible. The only slight notable change was that downside puts seem to continue to be marked down by market makers. |
|
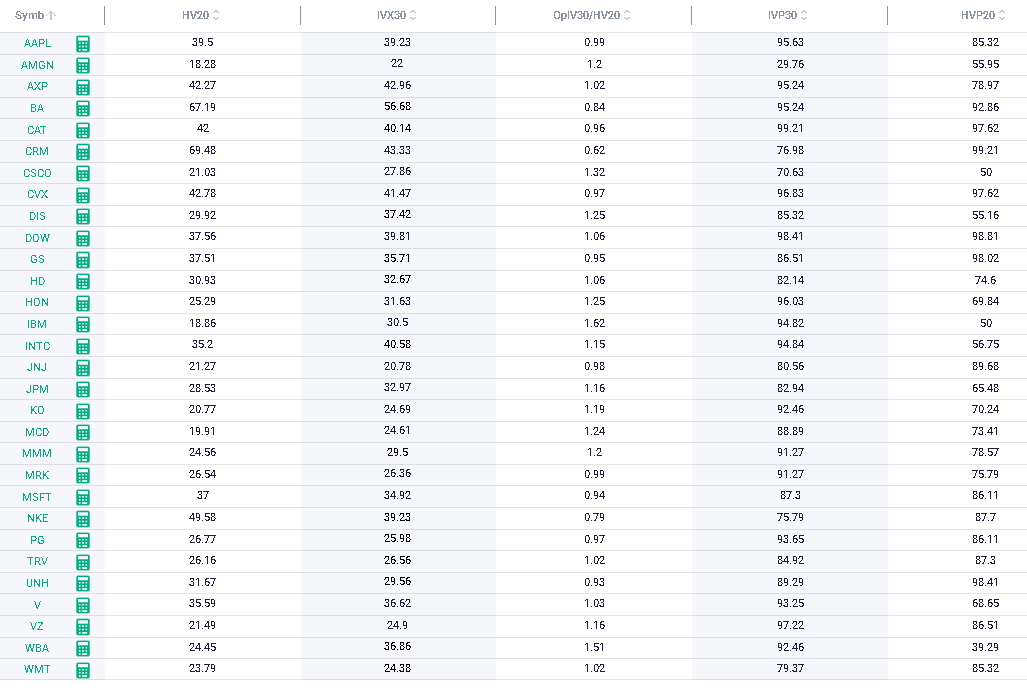
Looking at the Stock Monitor on the DJIA components, we can scan for dislocations within the names making up that index on various metrics. |
|
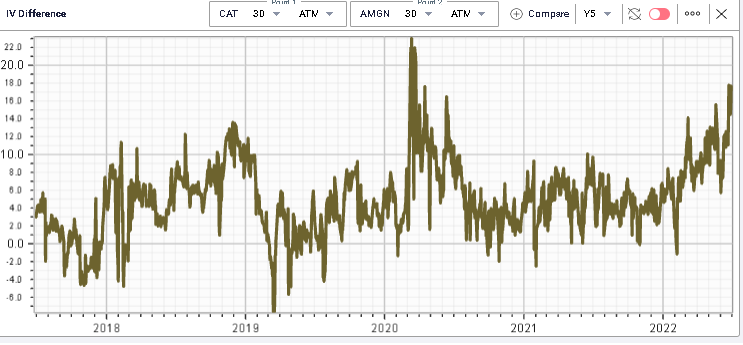
1. Using IVP30:This metric measures the frequency of the 30d IVX of a given stock being below the current level over the past 12 months. For instance, an IVP30 for AMGN of 29.76 means that around 30% of the time over the past 12 months, implied volatility was lower than where it is now. On the opposite side, an IVP30 of 99.21 for CAT shows that the implied volatility was hardly ever higher than the current level over the past year. |
Using that logic, combined with the IV Difference chart allows us to quickly spot that the implied volatility of CAT relative to the IV of AMGN is trading at a historical premium. |
|
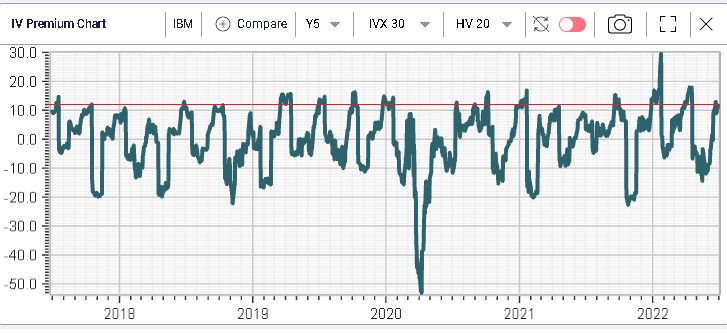
2. IV30/HV20: This second metric helps us compare the implied volatility with the realized volatility. For instance, we can quickly spot that the IBM implied volatility is trading at a 60% premium to the realized volatility. Using the IV Premium chart, we can see that historically, the level where the IV Premium is sitting (>+10) is elevated. |
|
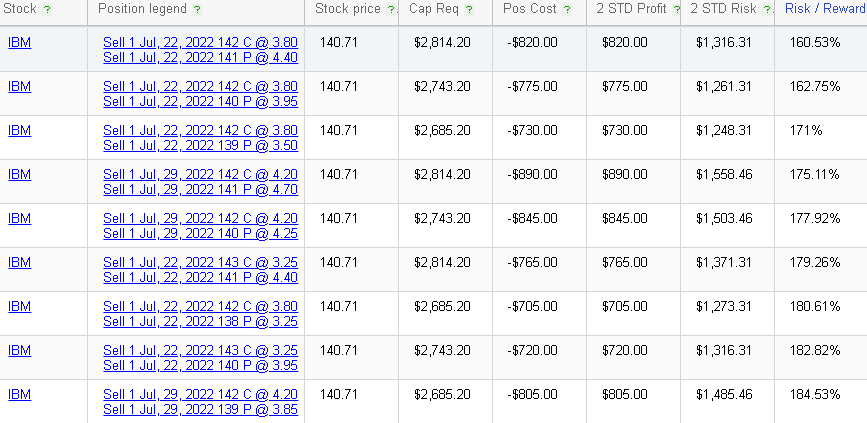
This type of analysis should help us decide whether we want to buy or sell volatility. Once this has been decided, we can use the other tools to find the best possible combinations. For instance, scanning for short strangles on IBM with a maturity before Sep’22 returns the following combinations: |
|
The most attractive combination according to the RT Spread Scanner and based on the amount of Risk taken relative to the potential Reward is to sell the 22nd July 141/142 strangles for $820. |
Disclaimer - This information is provided for general information and marketing purposes only. The content of the presentation does not constitute investment advice or a recommendation. IVolatility.com and its partners do not guarantee that this information is error free. The data shown in this presentation are not necessarily real time data. IVolatility.com and its partners will not be liable for any loss or damage, including without limitation, any loss of profit, which may arise directly or indirectly from the use or reliance on the information. When trading, you should consider whether you can afford to take the high risk of losing your money. You should not make decisions that are only based on the information provided in this video. Please be aware that information and research based on historical data or performance do not guarantee future performance or results. Past performance is not necessarily indicative of future results, and any person acting on this information does so entirely at their own risk. |