Looking at option volumes |
Last week saw indices continue to correct overall with the SPX dropping 2.21% and the NDX losing 4.3%. The DJIA did slightly better losing only 1.3% on the week. In Europe stocks continue to slide as well with the French CAC and the German DAX both dropping 2.5% on the week. The one major index that managed to finish in the green was the Chinese HSCEI which gained 0.5% on the week. |
Looking at volatilities, they moved slightly higher over the week with the 30d IVX gaining about 1 point for the NDX, and 0.5 points for the SPX. |
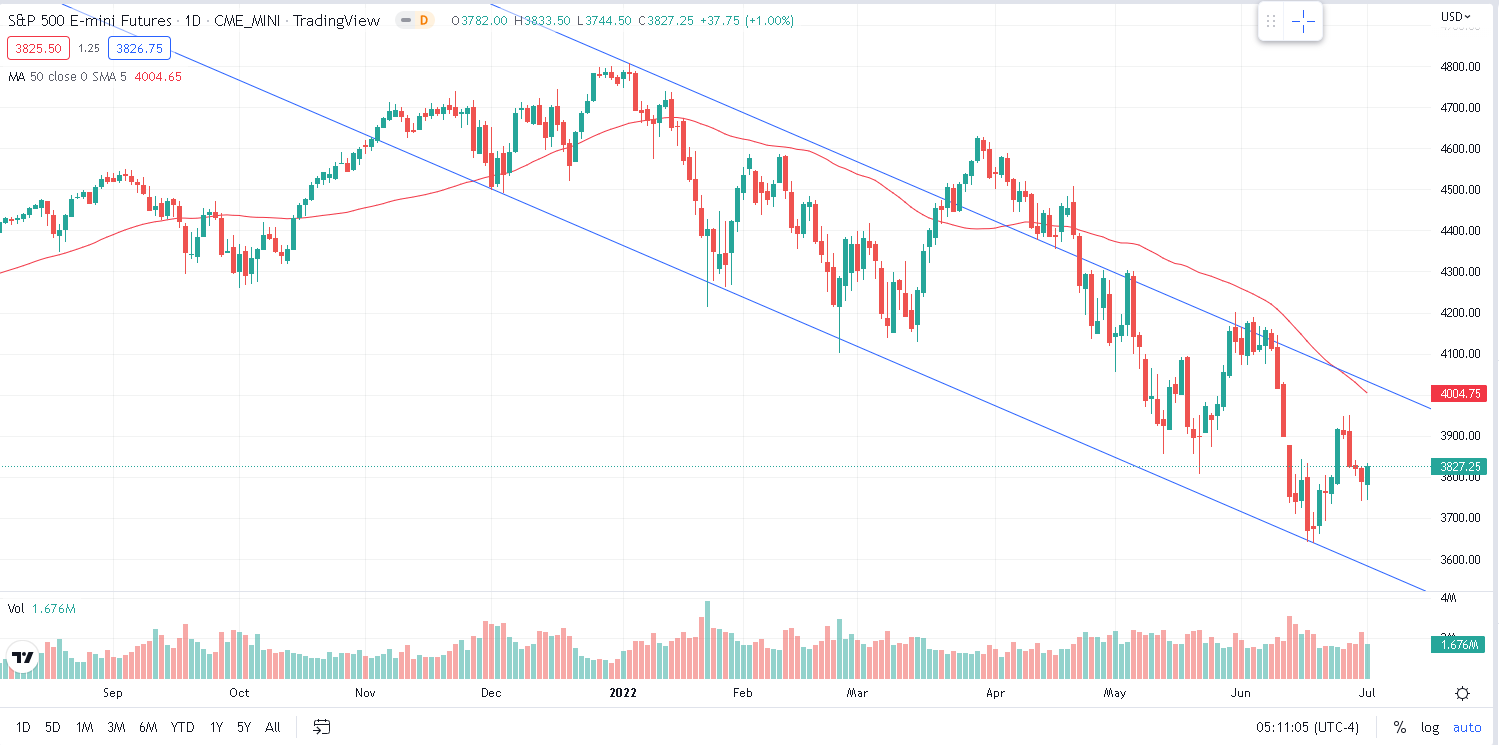
Technically the market remains in a downtrend driven by a channel that has been in place since the end of 2021 with the 50d moving average at the top end of the channel. |
Source: Tradingview.com |
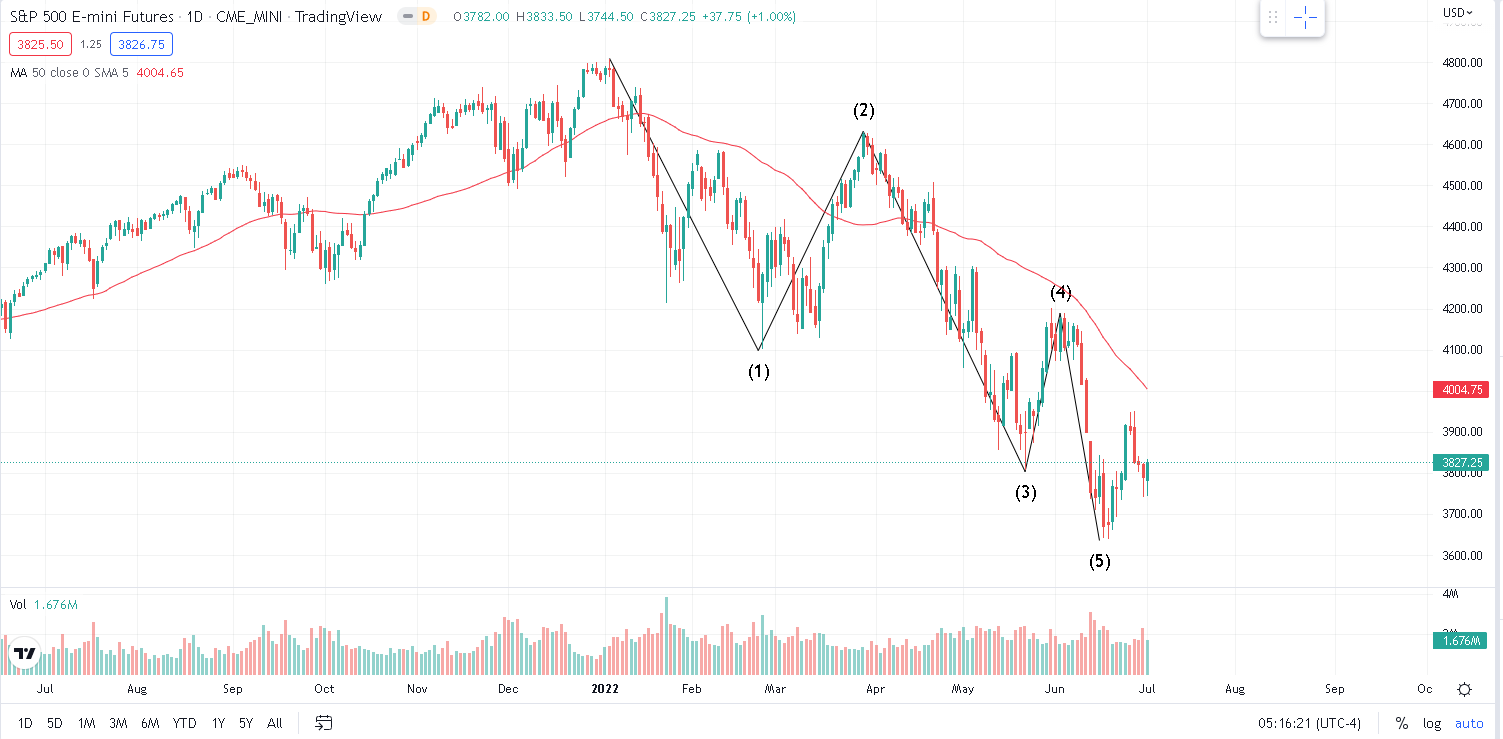
Looking at the selloff in 2022, it seems that we have witnessed 5 complete waves so far which are highlighted on the below chart. The next logical step should be a 3-step correction in the opposite direction of the main trend which may have started around the Jun’22 expiration with a bottom at 3640 on the E-Minis and a consecutive local high on Tuesday around 3950 possibly making up the first of the three legs of that corrective wave. |
Source: Tradingview.com |
This is all fine and well from a theoretical perspective but if you have been in the market long enough you know that the theory never really fully delivers and the reality always finds a way to surprise us. |
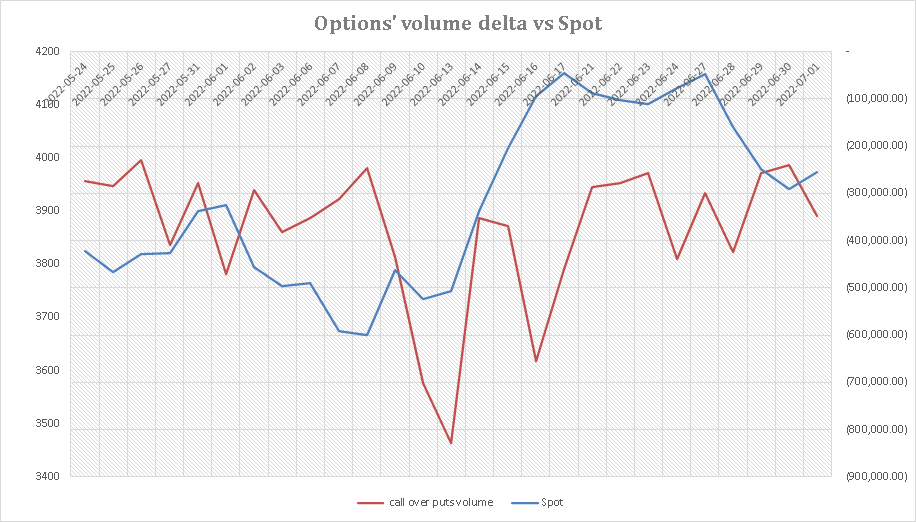
Volumes on options is one of the key metrics to look at when trying to assess the message provided by the underlying market. Below, we use the concept of option’s volume delta which is simply defined as the difference between the volume of calls and the volume of puts. |
|
In the chart above we see that over the past 30 days, puts have always been more active than calls in terms of total volume. In blue, we show the subsequent closing price of the SPX for that day. It is not unusual for the point of maximum bearishness (proxied by the point where put volumes exceed call volumes by the largest amount) to mark a local low in spot prices and this is what we have seen recently. |
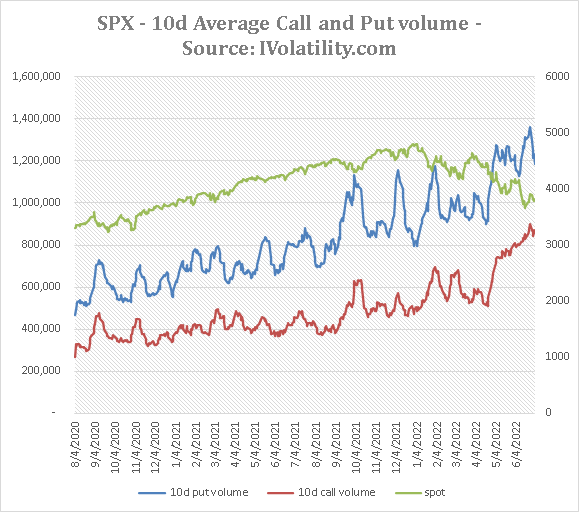
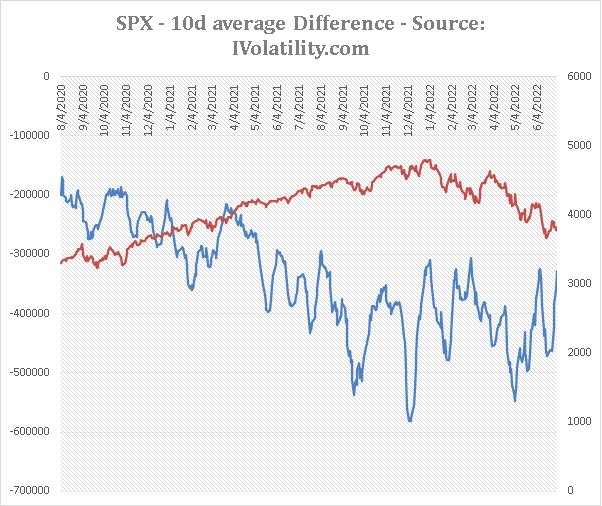
Furthermore, looking at longer time series, we can calculate the 10d average volume on the call and put side which we show below against the spot price (right axis). |
|
The increase in put and call activity has been steady since the middle of 2020 and it is worth noting the acceleration of those volumes since the FED has started tightening. More recently, the leg lower in spot has seen a reduction of the volume of puts exchanged and an increase in the volume of calls traded. This is a phenomenon we discussed in a recent market update where it seemed that some market participants were hedging the risk of a large move higher in spot. |
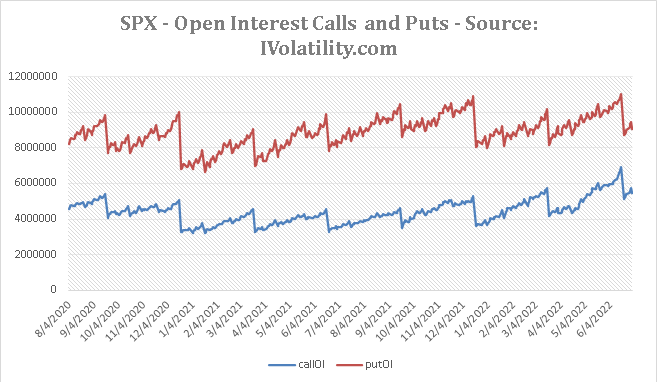
Looking at open interest we can also see that the outstanding number of positions on the put-side has remained steady since 2020 while the amount of outstanding call positions has increased. For more information on this phenomenon, please read the market update called “Getting positioned for an up-crash?”. |
|
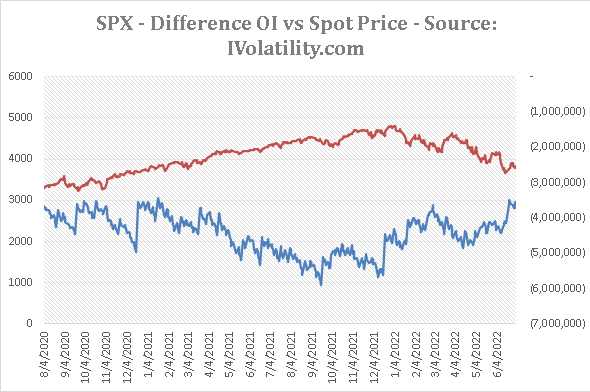
Looking at the difference both in volumes and open interest between calls and puts can provide some useful insight. |
|
The chart above displays in red the SPX closing values against the 10d difference between the call volume and the put volume. Note that the focus on the put side increased very early and gradually increased throughout 2021 with a lot of traders seemingly hedging themselves with puts during the great rally we saw last year. It seemed that by Q3/Q4 2021, some traders were getting ready for a selloff already with very large spikes in put volumes associated with spot prices moving lower. In 2022, we saw some periods of large increases in put volumes but those never really lasted for long and reverted over the following days. |
Looking at the open interest chart below, we can see that the outstanding number of calls measured against the outstanding number of puts has reached a 2 year high over the past few days. |
|
This accumulation of call positions has really increased since the 10th Jun’22 a period when the SPX lost around 370 points in 3 sessions and that could be considered as the end of wave 5 in the second chart of this market update, a drop that could be regarded as capitulation with the SPX selling off very aggressively in a very short period of time leading to the Jun’22 expiry. |
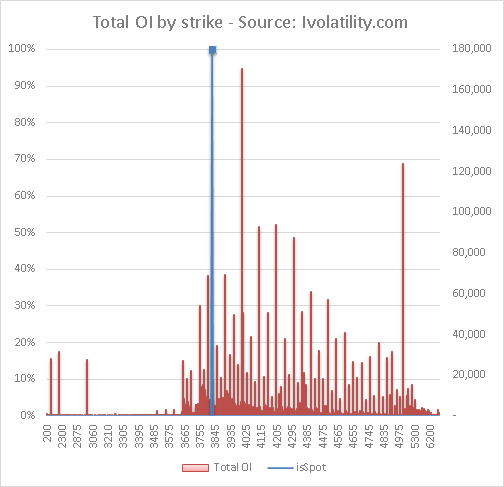
Looking into the options chains, it will come to almost no surprise that the strike getting the most attention is the 4,000 strike. Big figures are known to draw the attention of traders and this is the case here as well with 60,780 of the Sep’22 calls outstanding, 49.6k of the July 4,000 calls and 47.4k of the Dec’22. |
Specifically, if we look at the sum of all outstanding call positions with an expiration before the 30th Sep’22, we get the following distribution of the strike interest. |
|
The 4,000 strike and the 5,000 are the two largest areas of focus for the market and traders have accumulated positions on the following call strikes as well: 3900 – 4000 – 4100 – 4200 and 4300. The interest then drops out until the 5,000 strike which is very visible on the chart above. In blue we highlight Friday’s closing level. |
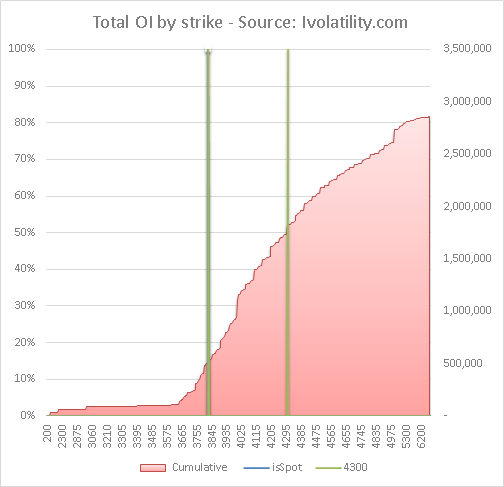
On the chart below, we show the cumulative distribution of strikes with the same parameters as before and we highlight the current spot price as the lower bound and the strike 4300 as the upper bound. We find that around 35% of all outstanding call positions with expiration before 30th Sep’22 have strikes between 3825 and 4300. |
|
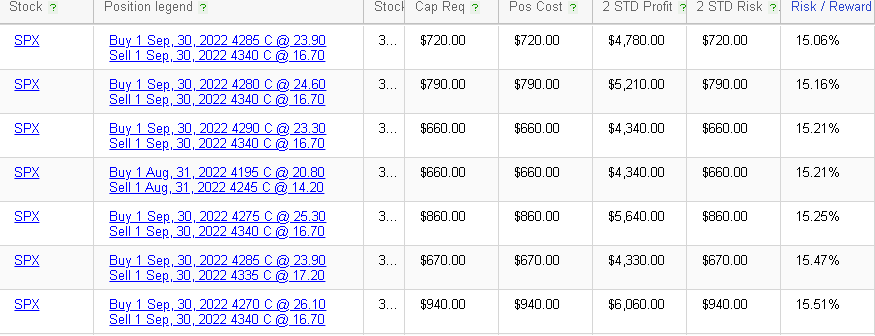
For traders looking to participate in a possible rally, using the RT Spread Scanner is a good starting point to build an options position. For instance, using a bull vertical spread would be useful to control the amount of risk taken on the trade. |
For instance, we find the following screen returning some bull vertical spreads sorted by Risk/Reward with the 4285/4340 for $7.2 offering a 15.06% RR. In other words, the trader stands to lose $720 of premium for a potential $4,780 net profit which means that for every $15c risked, there is a $1 potential profit in the balance. |
|
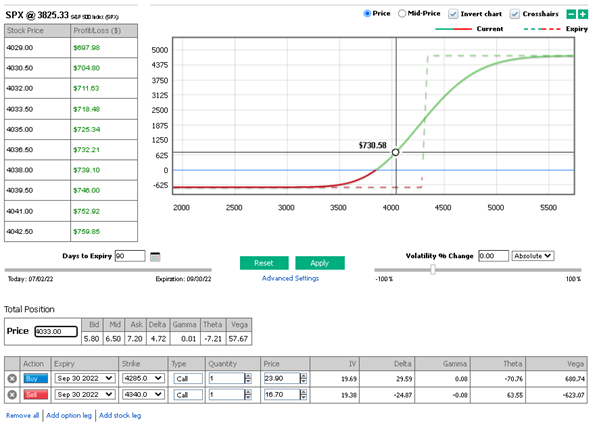
Some traders do not like to hold position until expiration and like to trade dynamically. Using the PnL Calculator is a good solution to prepare for various scenarios that might happen in the market. |
For instance, you might ask where the spot would need to get to for you to realize a 100% return on investment on owning those 4285/4340 bull spreads expiring 30th Sep’22. |
The below screenshot shows that if the SPX reaches 4,033 (a move higher of 5.4% in the underlying) then the strategy would return 100% of profitability (excluding transaction costs which are not simulated here). |
|
In this example we have assumed that volatilities remain unchanged which may not be a good assumption and this is only an estimate provided by the system with no certainty that the market will realize that but it helps make educated guesses when it comes to options trading. |
Disclaimer - This information is provided for general information and marketing purposes only. The content of the presentation does not constitute investment advice or a recommendation. IVolatility.com and its partners do not guarantee that this information is error free. The data shown in this presentation are not necessarily real time data. IVolatility.com and its partners will not be liable for any loss or damage, including without limitation, any loss of profit, which may arise directly or indirectly from the use or reliance on the information. When trading, you should consider whether you can afford to take the high risk of losing your money. You should not make decisions that are only based on the information provided in this video. Please be aware that information and research based on historical data or performance do not guarantee future performance or results. Past performance is not necessarily indicative of future results, and any person acting on this information does so entirely at their own risk. |