Energy crisis in Germany |
US markets were shut yesterday as the country celebrated the 4th July, Independence Day. Over in Europe, the German DAX lagged slightly finishing down 0.35% while the French CAC was up 0.4%. |
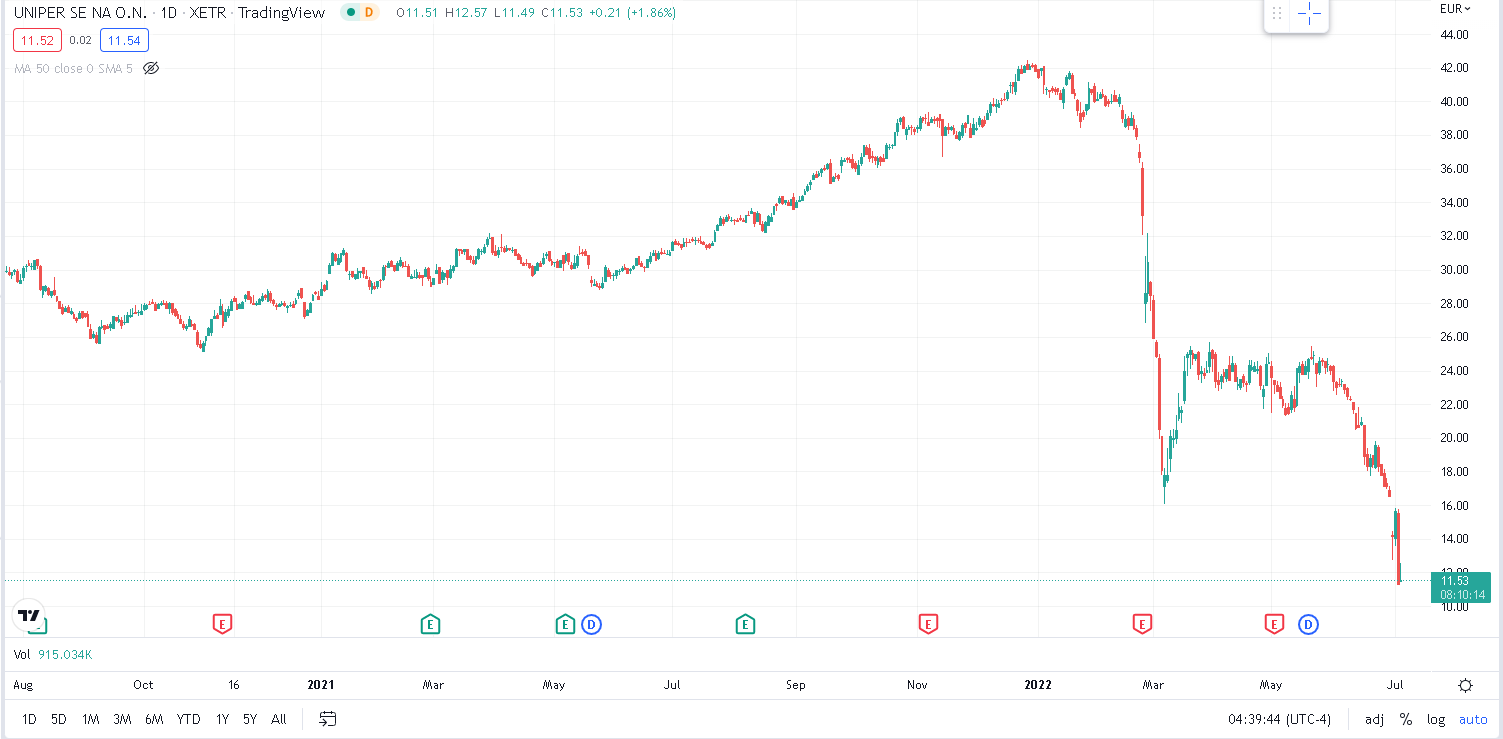
In Germany, the market is getting concerned about the Energy situation and the consequences that a crisis in the next few months could have on domestic companies. Uniper for instance recently issued a profit warning and there were media reports yesterday that the German government is now considering a bailout for the energy company. |
Source: Tradingview.com |
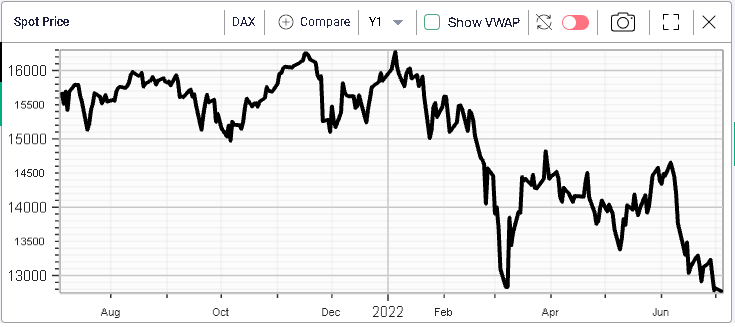
Concerns about a potential recession on the back of increased ECB interest rates, inflation and an energy crisis in Europe have slowly reduced investors’ confidence and the DAX has now broken its March 2022 lows. |
|
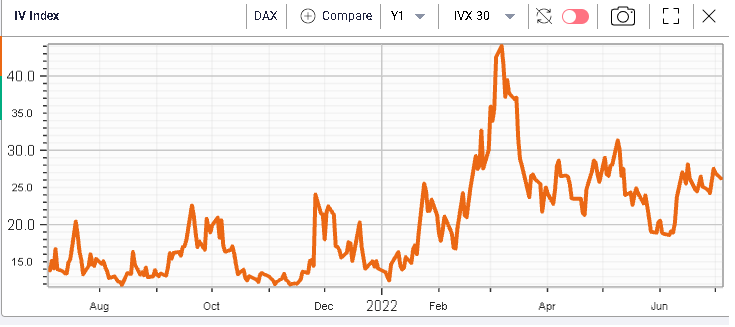
Those news lows have been broken on relatively subdued implied volatility as shown with the 30d IVX below which remains very much contained and around 26.2 compared with a spike around 44 in early March. |
|
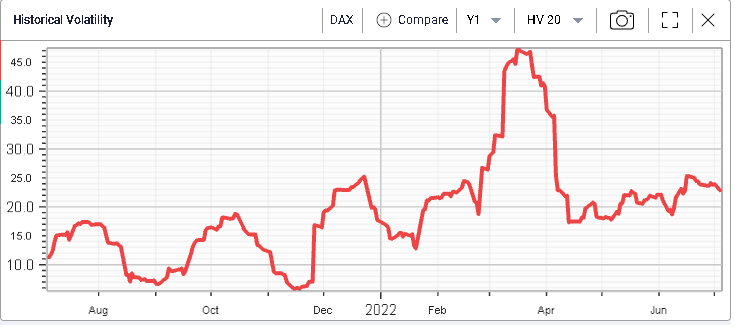
This is best explained by the very slow pace at which the market has been selling off as evidenced by the 20 days historical volatility chart below with the current realized volatility levels around 23. |
|
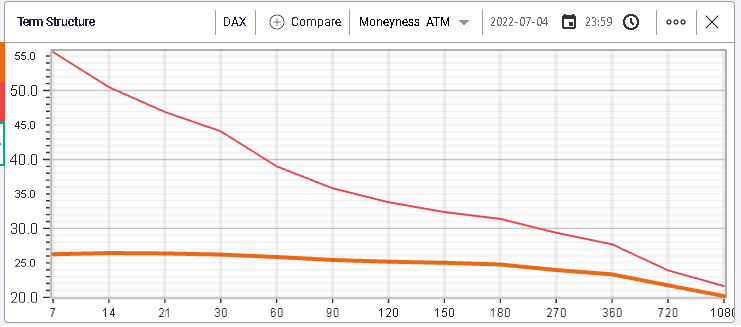
Looking at a comparison of yesterday’s term structure for the DAX against the term structure as of the 7th Mar’22, we can see that vols have compressed across the entire curve. |
|
Furthermore, the current TS (in orange) looks extremely flat relative to the one of March in red. That shows that the market is now expecting a prolonged period of volatility with no particular emphasis on short term action. |
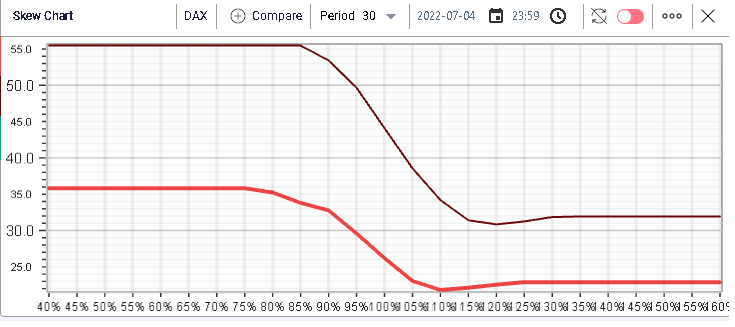
We do the same comparison exercise on the skew curve shown below with in red yesterday’s skew and in brown the skew in March. We can see that the difference between the two curves seems to be the greatest on the put side, a sign that traders back then thought they needed to hedge whereas here it could be seen as a sign that market makers are comfortable with implied volatility levels and happy to sell puts slightly above 30 vols for 30d options. |
|
This phenomenon of downside pressure has been discussed at length in previous market updates especially over in the US so please take a look at prior issues for more information: www.ivolatility.com/news.j |
Disclaimer - This information is provided for general information and marketing purposes only. The content of the presentation does not constitute investment advice or a recommendation. IVolatility.com and its partners do not guarantee that this information is error free. The data shown in this presentation are not necessarily real time data. IVolatility.com and its partners will not be liable for any loss or damage, including without limitation, any loss of profit, which may arise directly or indirectly from the use or reliance on the information. When trading, you should consider whether you can afford to take the high risk of losing your money. You should not make decisions that are only based on the information provided in this video. Please be aware that information and research based on historical data or performance do not guarantee future performance or results. Past performance is not necessarily indicative of future results, and any person acting on this information does so entirely at their own risk. |