An important cross on XLE / USO vol-spread |
After the long weekend in the US, the NDX started on a very strong footing gaining 1.7% while the SPX and the DJIA lagged behind respectively +0.16% for SPX and -0.42% for the DJIA. |
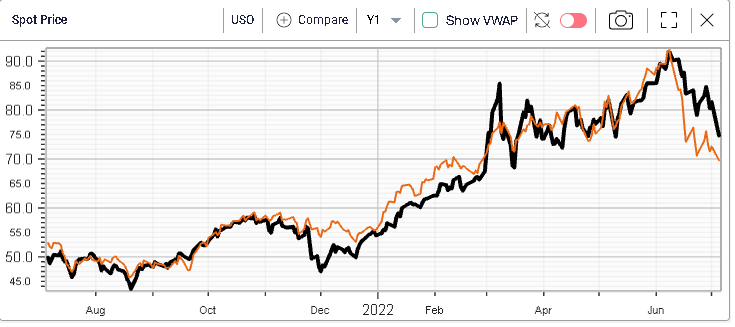
The main event of the day was undoubtedly the large drop of Oil prices with a high to low range of around 12.4%. As a result, the energy space in the US was under significant pressure but outperformed commodities by losing only 4% on the day helping correct the spread that had appeared around the beginning of June and shown below with in black the USO ETF and in orange the Energy sector spot price. |
|
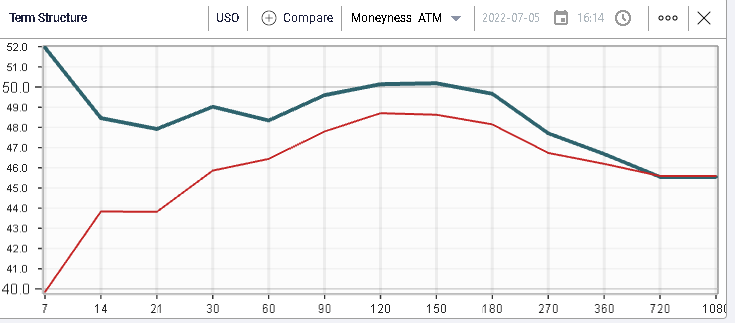
Looking at volatility in USO, we can see how the term structure has inverted now with short dated options trading above 50 IV and the curve fairly flat around 49-50 for the next 6 months. |
|
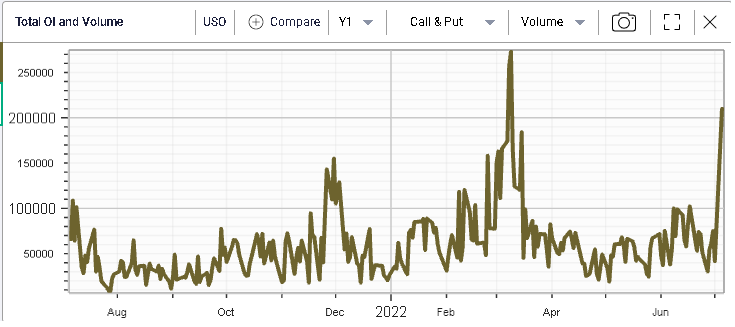
Unsurprisingly, volumes in USO spiked yesterday, both on the call side and on the put side. |
|
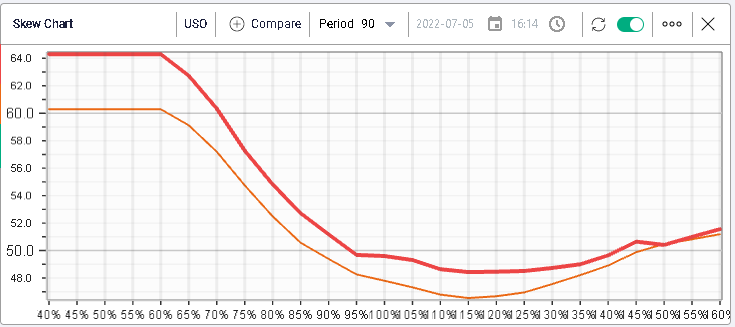
Looking at skew in USO, we see that it parallel shifted from the orange line to the red line over the day without any notable changes either towards puts or calls. |
|
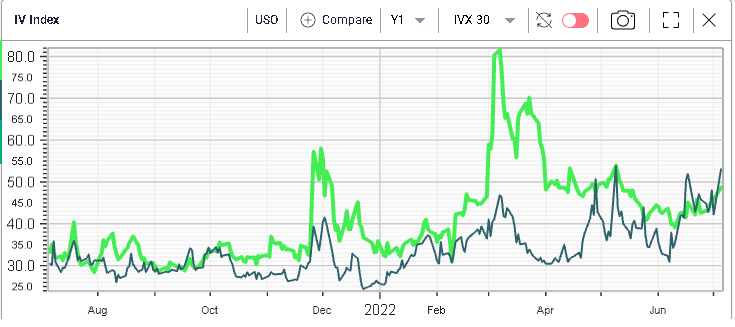
Looking at 30d IVX for the XLE space and the USO ETF, we find that the XLE implied volatility closed higher than the USO volatility yesterday, a rare occurrence over the past 12 months. |
|
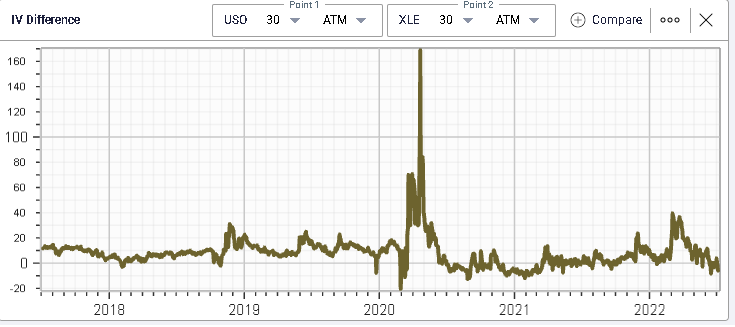
In fact, looking at our new service IV Difference, we get the following chart where we can see that the 30d implied volatility for the XLE is now higher than that of the USO. This chart has 5 years of history and displays that even on long time frames it has been relatively rare. |
|
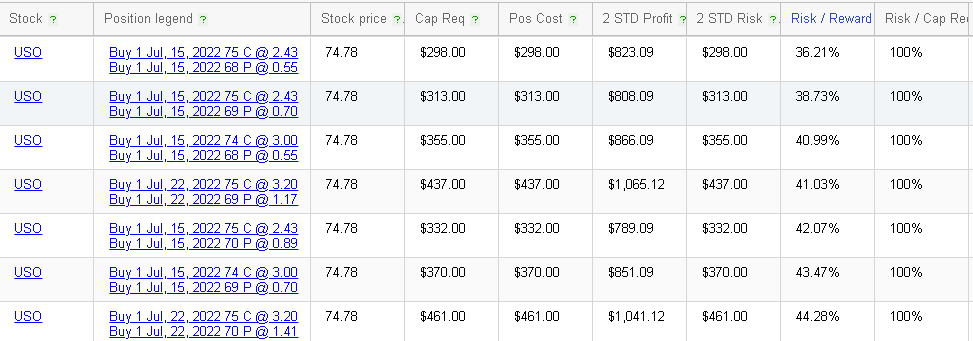
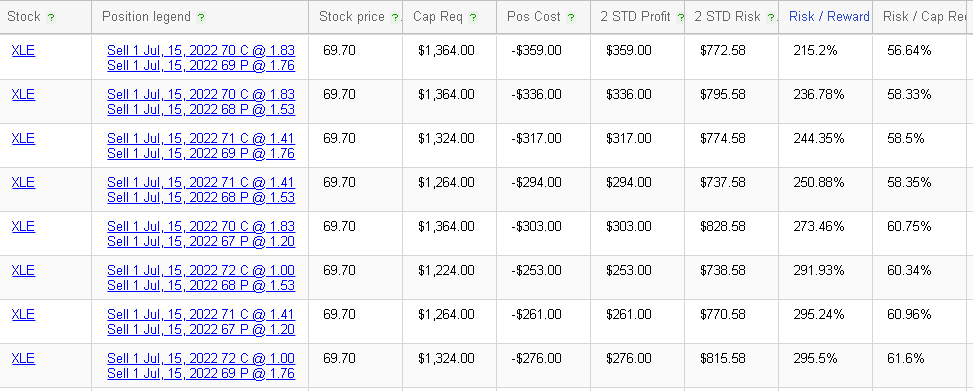
For a trader looking to fade this, looking at the RT Spread Scanner helps to find the most attractive combinations of a particular strategy. For instance, let us imagine that a trader is keen to buy short dated strangles on USO and to sell short dated strangles on XLE. The RT Spread Scanner would return the following for USO: |
|
And for the XLE: |
|
If you have any questions about the tools or require assistance, do not hesitate to write to us on support@ivolatility.com |
Disclaimer - This information is provided for general information and marketing purposes only. The content of the presentation does not constitute investment advice or a recommendation. IVolatility.com and its partners do not guarantee that this information is error free. The data shown in this presentation are not necessarily real time data. IVolatility.com and its partners will not be liable for any loss or damage, including without limitation, any loss of profit, which may arise directly or indirectly from the use or reliance on the information. When trading, you should consider whether you can afford to take the high risk of losing your money. You should not make decisions that are only based on the information provided in this video. Please be aware that information and research based on historical data or performance do not guarantee future performance or results. Past performance is not necessarily indicative of future results, and any person acting on this information does so entirely at their own risk. |
