Finding the best covered calls |
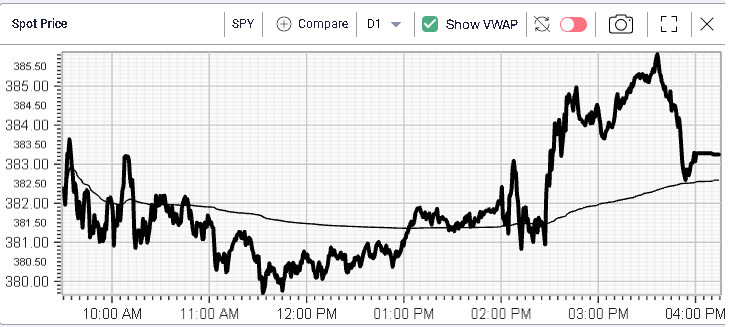
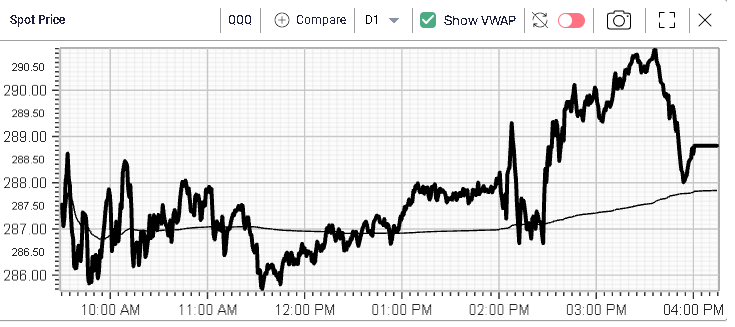
Timid bounce in the market yesterday with the SPX gaining 0.4%, the NDX 0.6% and the DJIA 0.2%. SPYs and QQQs traded around VWAP all day with the early part of the session under bears’ control while the latter part went to the bulls. |
|
|
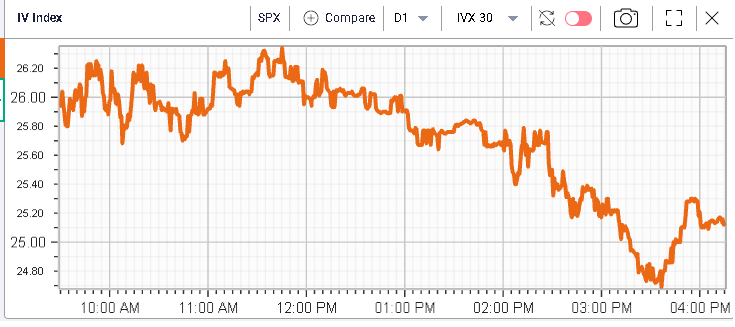
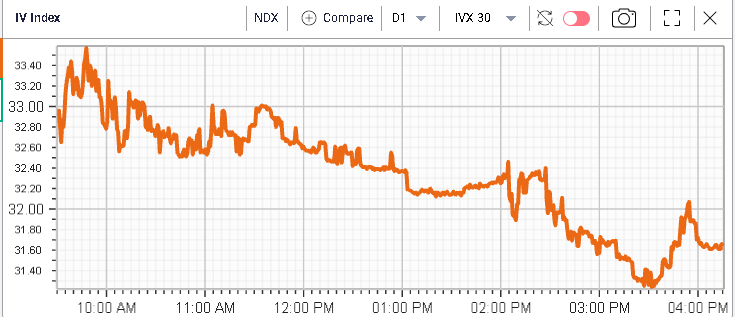
As a result of the last two days’ bounce, the implied volatility has continued to correct lower with 30d IVX on the SPX settling around 25 and 30d IVX for the NDX closing around 32. |
|
|
Sector wise, the XLE remains under pressure losing around 1.5% on the day. Consumer Discretionary and Financials also finished the day in the red losing around 0.3% each. |
On the upside, Utilities, Tech and Healthcare topped the leaderboard gaining respectively, 1%, 0.9% and 0.7%. |
At the single stock level, the day was fairly concentrated with all components of the DJIA finishing within a +/- 2% range. Leaders were UNH (+2%), CSCO (+1.74%) and TRV (+1.61%) while laggards were WBA (-1.9%), CVX (-1.32%) and GS (-1.16%). |
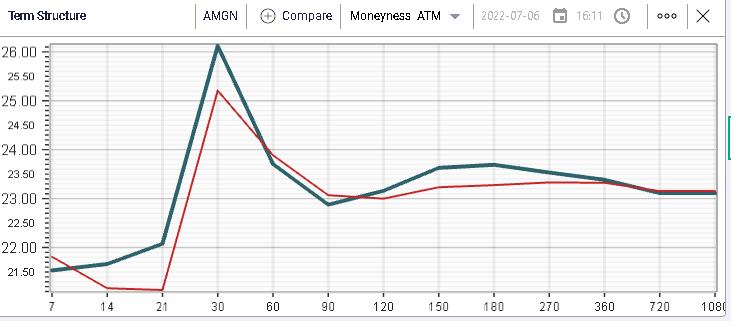
In terms of in demand IVs, we can flag AMGN with short dated vols moving slightly higher despite the IV on indices moving down on the day. |
|
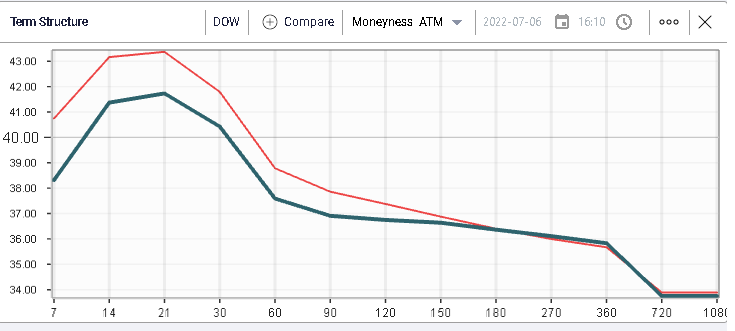
Vols that were most under pressure on the day include names such as DOW shown below with 30d volatilities losing around 1.5 points on the day. |
|
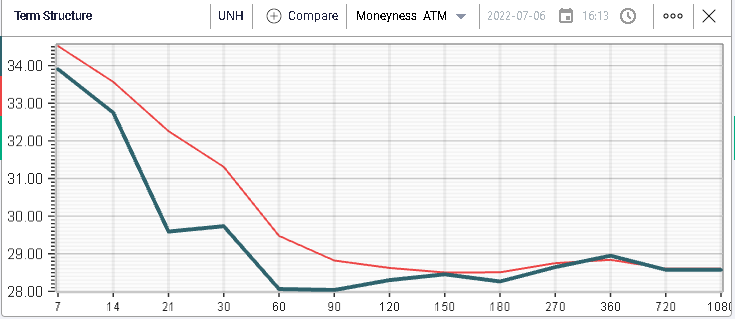
Despite an expected earnings date next week, UNH implied volatilities also compressed over the session with 30d implied volatility losing around 1.6 points. |
|
And for the XLE:As we approach earnings season, it makes sense to look at one of the most popular strategies, covered calls. |
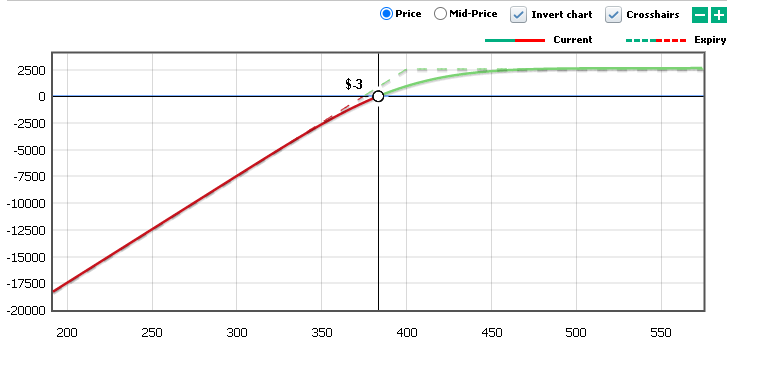
The logic is fairly simple, buy a stock and sell a call at the same time. In the below example, we display the payout of a covered call on SPY using the PnL Calculator tool. |
|
By selling a call, the trader ensures that he would be profitable should the stock price remain unchanged. If the stock goes down, the sale of the call also helps cushion some of the losses incurred by the trader. Finally, if the stock moves higher, the upside of the trader is capped as the call acts as an automatic profit taker. |
Most traders will execute this kind of strategy on stocks that they like and already own but there are also some systematic traders who like to search for the most attractive candidates amongst a specific subset of names. |
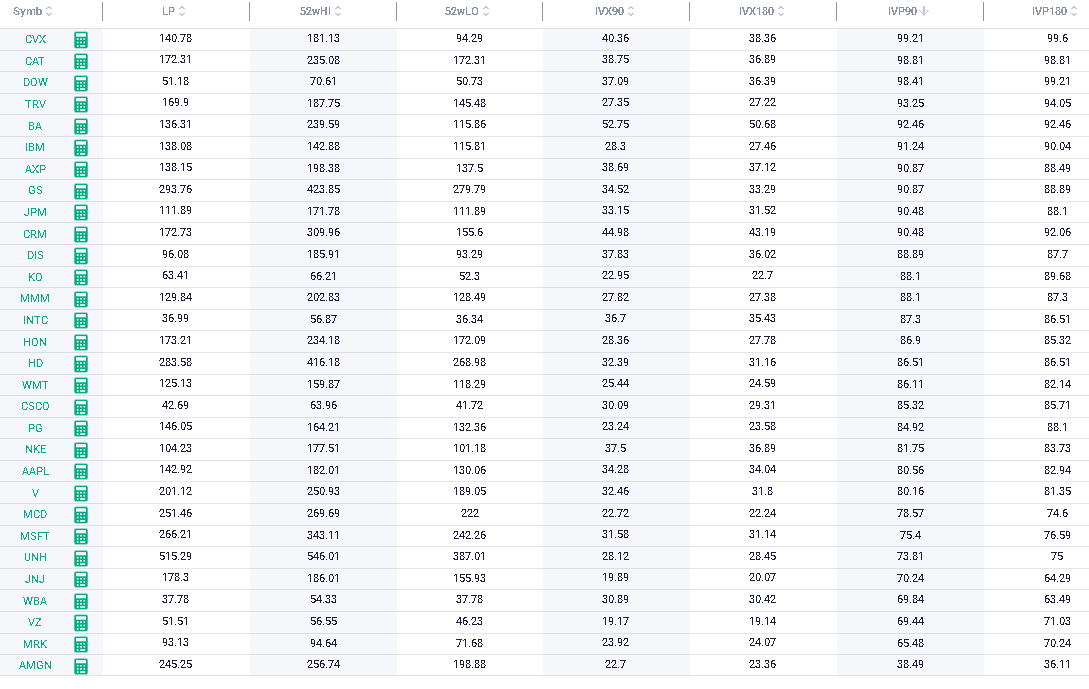
In all instances, because the strategy consists in selling a call, traders generally like to scan for expensive implied volatilities to sell. Using Stock Monitor, we have a column called IVP which stands for Implied Volatility Percentiles which simply returns the position of the current IVX relative to its own 12 months history. For example, if AAPL has an IVP 30 of 95 then it means that only 5% of the time, AAPL’s 30d IVX was higher than where it is now over the past year. |
Sorting names by IVP90 for instance on the DJIA components returns the following list. |
|
Out of those names, we can see that CVX is the one with the highest relative implied volatility index over the past 12 months. |
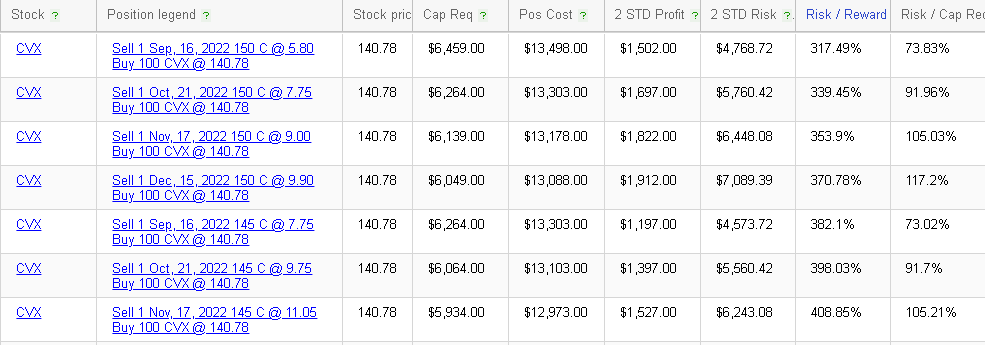
Let us now imagine that a trader who has owned CVX for a while wants to sell a call. Going into the RT Spread Scanner would be an easy starting point in order to find some potential candidates. The system will create combinations of stock positions with short calls and will then sort them by Risk/Reward returning those that offer the best combinations first. |
|
For instance, in the example above, we can see that the system suggests selling the 150 calls in Sep’22 for $5.80. The trader then has a risk evaluated at $4.8k and a potential profit of $1.5k. |
Our systems are designed to help traders better understand their options positions and risks. Do not hesitate to try them out for free using our free trial: https://www.ivolatility.com/services.j |
Disclaimer - This information is provided for general information and marketing purposes only. The content of the presentation does not constitute investment advice or a recommendation. IVolatility.com and its partners do not guarantee that this information is error free. The data shown in this presentation are not necessarily real time data. IVolatility.com and its partners will not be liable for any loss or damage, including without limitation, any loss of profit, which may arise directly or indirectly from the use or reliance on the information. When trading, you should consider whether you can afford to take the high risk of losing your money. You should not make decisions that are only based on the information provided in this video. Please be aware that information and research based on historical data or performance do not guarantee future performance or results. Past performance is not necessarily indicative of future results, and any person acting on this information does so entirely at their own risk. |