Are you listening to the bond market? |
Markets managed to break higher yesterday led once again by tech stocks with the NDX up 2.16%. The SPX gained 1.5% and the DJIA 1.12%. |
As a result, implied volatilities remarked lower in the front-end with 30d IV losing 1.5 points. |
|
Looking at the 30d volatility by strike, we can see that it pretty much parallel shifted lower over the day across the entire curve. |
|
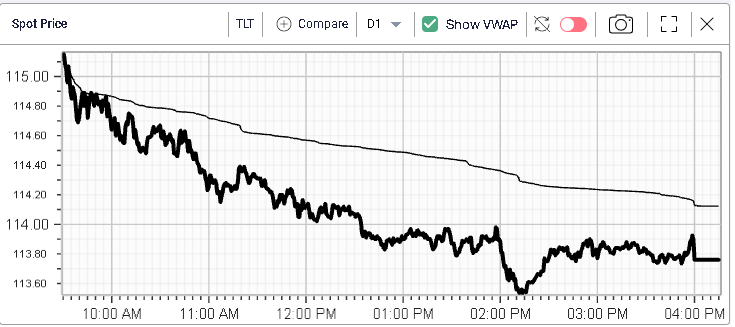
Yesterday also saw interest rates continue to move higher with the 10-year closing just below 3% and the 2-year at 3.02%. |
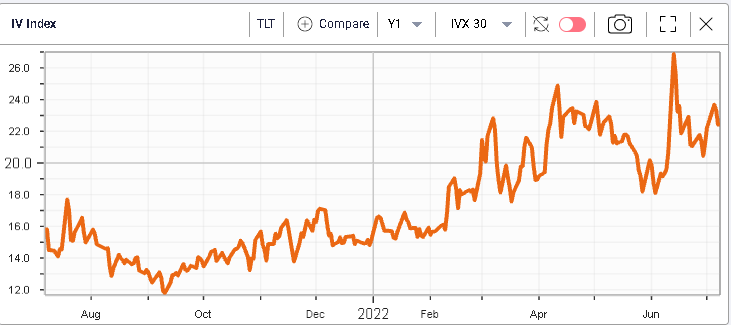
Looking at TLT as a proxy for long rates, we can see that the selloff was continuous throughout the session with the ETF trading below the VWAP for the entirety of the day. |
|
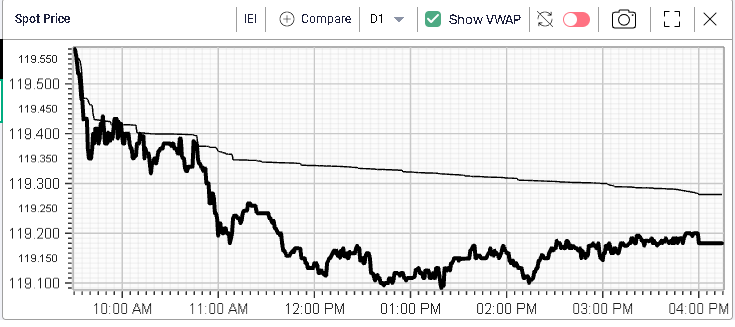
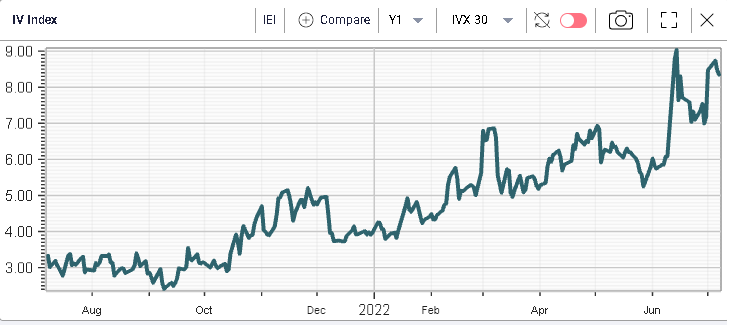
The same was visible on intermediate maturities, proxied here by IEI. |
|
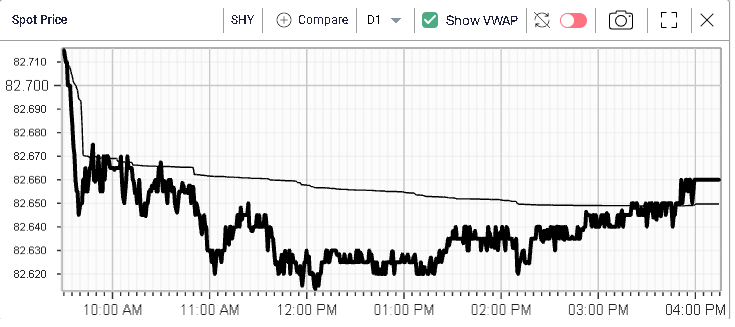
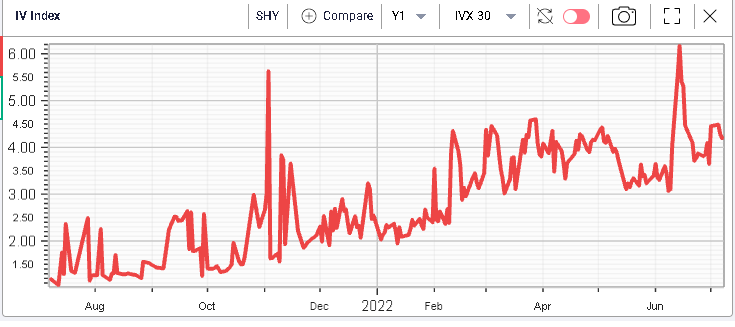
For short bonds, proxied here by SHY, they were bought late in the day and showed slightly more strength than longer terms. |
|
Looking at volatility as a way to measure market’s uncertainty, we can see that the intermediate part of the curve seems to be where market participants are most unsure of where things will eventually settle. This is where for instance 30 days implied volatility looks the most expensive relative to its own history as shown on the below charts. |
|
|
|
In the short run the market seems to be anticipating a steady increase in interest rates by the FED. Consensus seems to be for a 0.75% increase in July followed by a 0.5% increase in September. |
The big question at the moment seems to be around what happens after the initial hiking phase. Some argue that the FED will have to pause while the economy cools down while others think that the FED will take monetary policy into restrictive territory in order to constrain demand and will then have to start cutting rates again in order to stimulate the economy once again. |
This debate probably helps shed some light on the high implied volatility seen for intermediate maturities compared to their own history and measured relatively to short and long terms. |
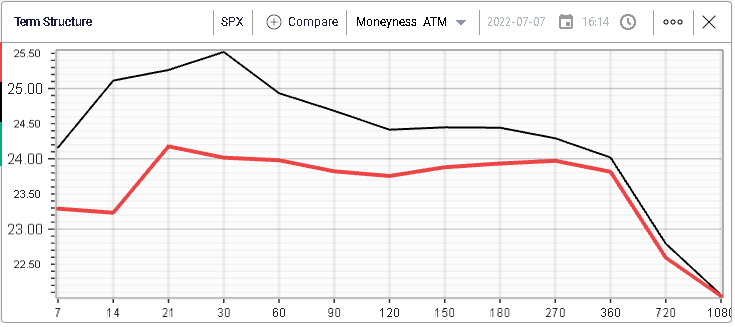
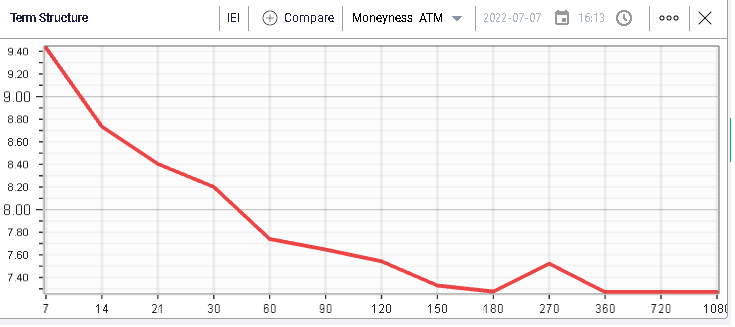
Zooming in on the implied volatility of IEI, we get the following term structure. It is notable that the shape of the term structure is fairly different from that of the SPX which is much flatter (see above) |
|
In other words, the Bond market is looking for a much more sanguine price action in fixed income over the next few weeks while the Equity market seems to be slightly more relaxed about it. |
Despite the fact that it is the summer period, the market will see a flurry of releases hitting the tape: |
|
Considering the above list, the potential for market moving headlines is large and the Fixed Income market seems to have taken note of it. For equities, we should also add that the earnings season will start in a few days and it might bring some useful information about how companies are navigating the current environment. |
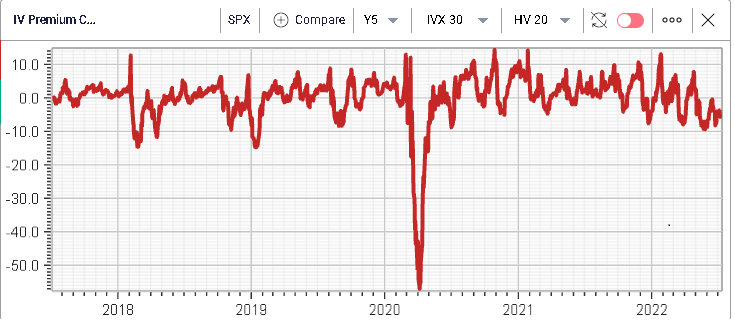
Looking at SPX volatility via the IV Premium chart (30d/20d), we can see that implied volatility for the SPX is trading around historically low levels relative to its historical volatility. |
|
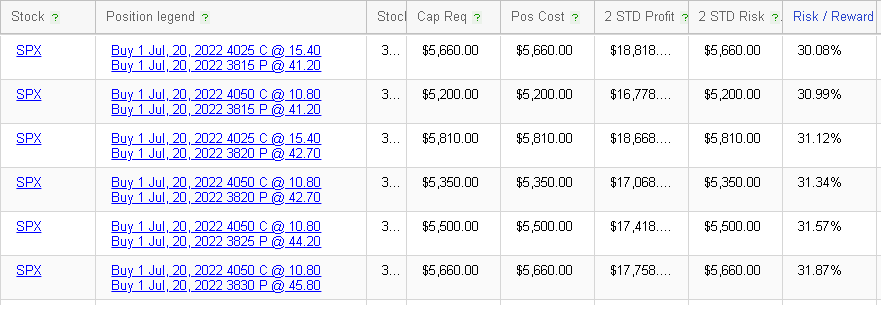
Let us now look at the RT Spread Scanner in order to see the kind of Risk to Reward ratio that we could get on long strangle positions on the SPX. |
|
We find that the 20th July 3815/4025 strangles are the most attractive combination from a Risk to Reward perspective offering a potential 18,818 of net profit vs a 5,660 potential loss. |
As with all things, there is no reason why the Fixed Income market should be right and the Equity market wrong but as we have pointed out in previous market updates, it has been sending some interesting clues so far this year and as such it is worth listening to the message it is sending. |
Disclaimer - This information is provided for general information and marketing purposes only. The content of the presentation does not constitute investment advice or a recommendation. IVolatility.com and its partners do not guarantee that this information is error free. The data shown in this presentation are not necessarily real time data. IVolatility.com and its partners will not be liable for any loss or damage, including without limitation, any loss of profit, which may arise directly or indirectly from the use or reliance on the information. When trading, you should consider whether you can afford to take the high risk of losing your money. You should not make decisions that are only based on the information provided in this video. Please be aware that information and research based on historical data or performance do not guarantee future performance or results. Past performance is not necessarily indicative of future results, and any person acting on this information does so entirely at their own risk. |