Will the bounce continue this week? |
Last week saw global equity markets continue to rally led by US Tech with the NDX gaining 4.6% over the shortened week. The SPX managed to gain just a little less than 2%. The Japanese NKY was the second-best performing index over the week finishing higher by 2.2%. Over in Europe, the Germany DAX and the French CAC managed to gain around 1.5% over the week. Finally, the DJIA lagged with a gain of only 0.8% and the Chinese HSCEI finished in the red by around 1.5%. |
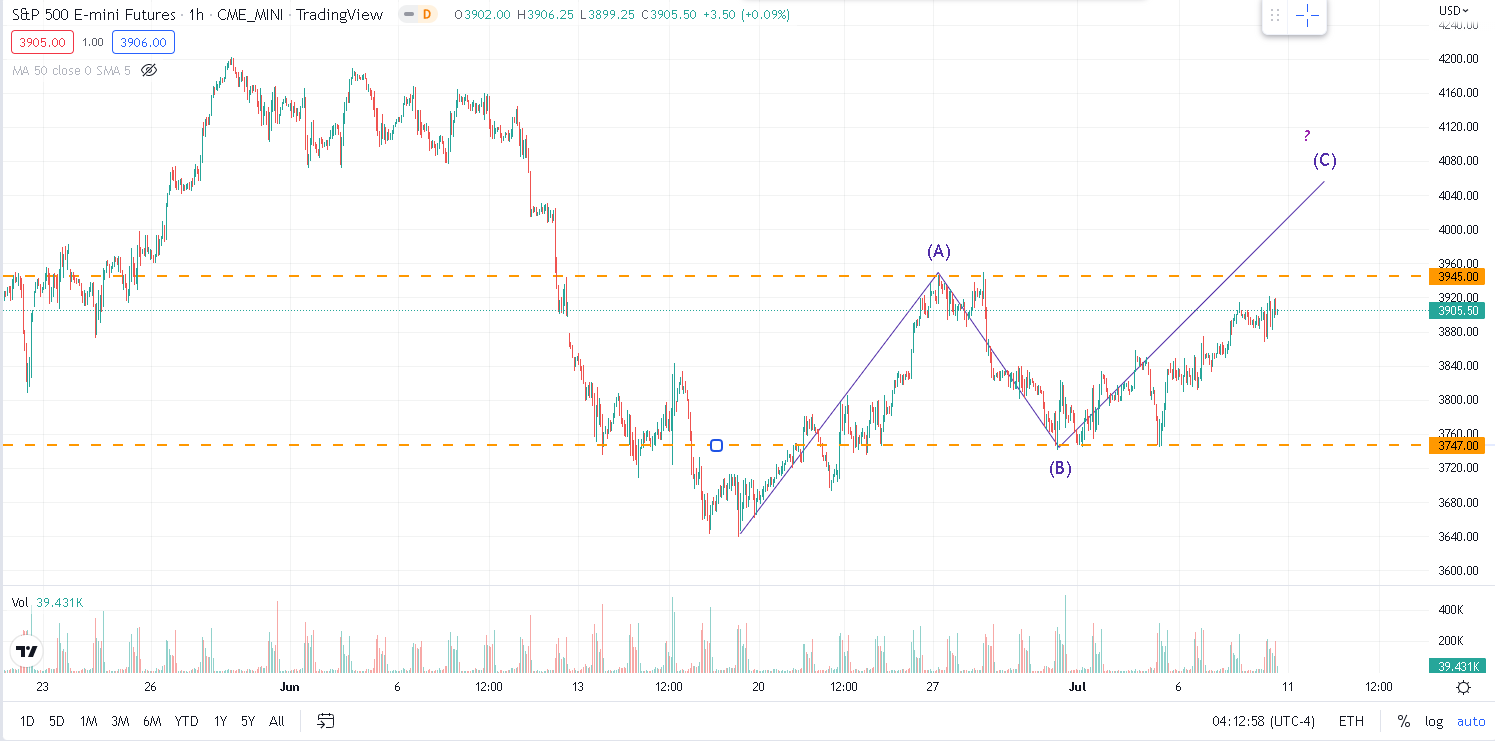
We described last week a possible read of the current market dynamics, centered around a move lower in 5 consecutive waves that was completed around the Jun’22 expiration followed by a possible 3 waves move in the opposite direction of the main trend. We highlighted that the move from 3650 to 3950 from mid Jun’22 to end Jun’22 could constitute the first of those three waves while the move from end of Jun’22 to early July’22 (3950 to 3750) could constitute the second of those. If that is true then we should expect to be in a third wave that could push prices above the prior local high at 3950. On the downside, a break of 3750 would invalidate that scenario and we would have to reevaluate. |
Source: Tradingview.com |
Looking at the above chart, it is clear that both levels identified at 3750 and 3950 are key and have been tested and respected by the market on multiple occasions. Volume and reaction around a level generally gives credit to it and it is important to keep an eye out for those things. As a result, for next week, we will be watching if the market manages to get back towards the 3950 area and how traders react as we approach. |
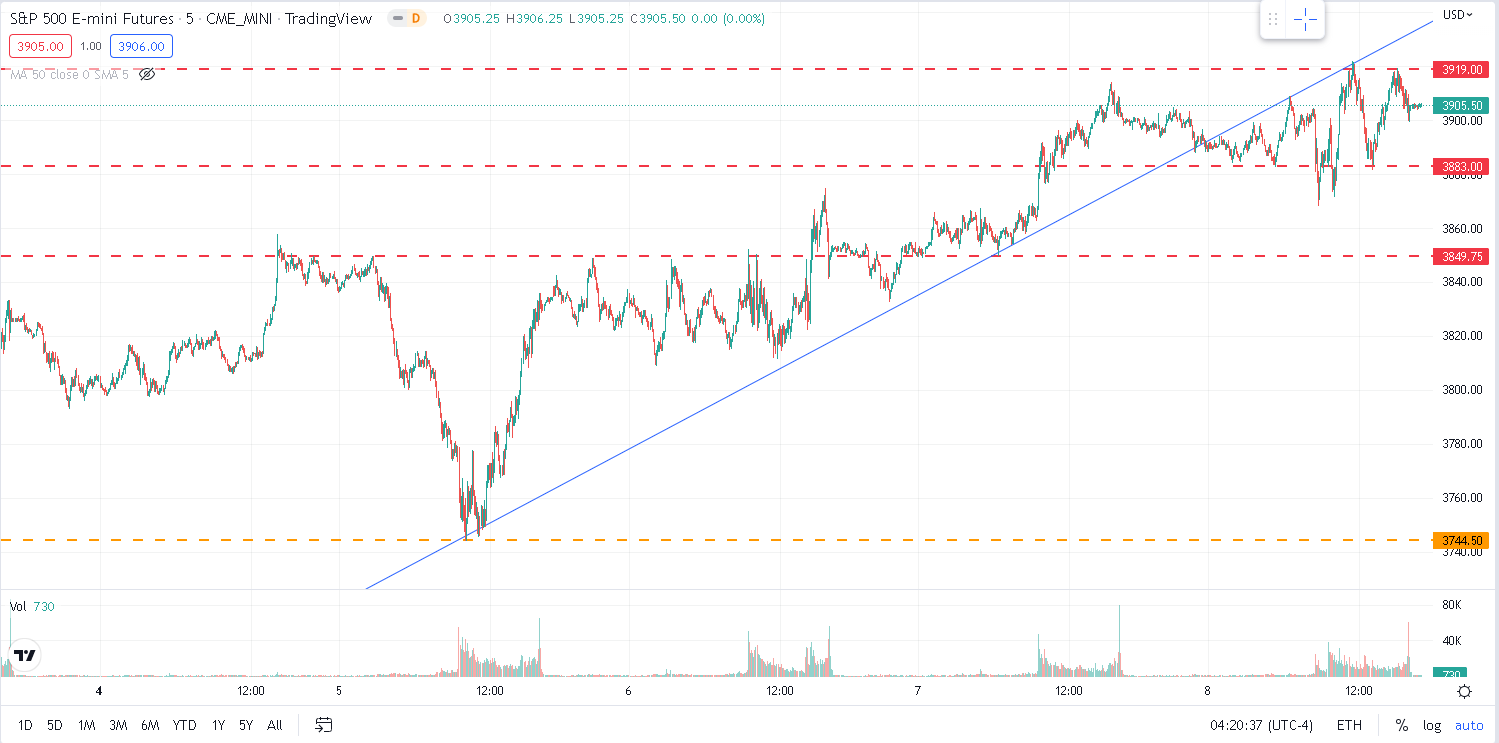
Zooming in on the micro structure of trading over the week on ES contracts, we can see the following important points: |
|
Source: Tradingview.com |
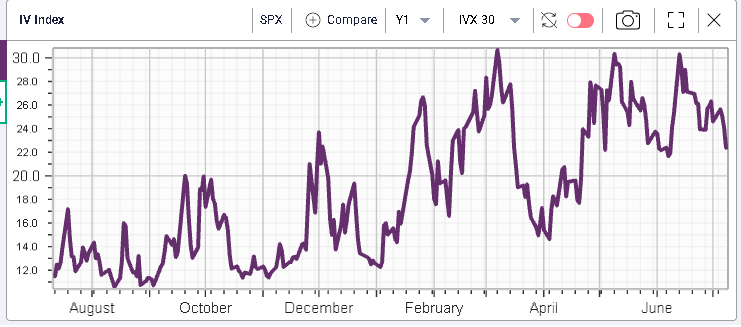
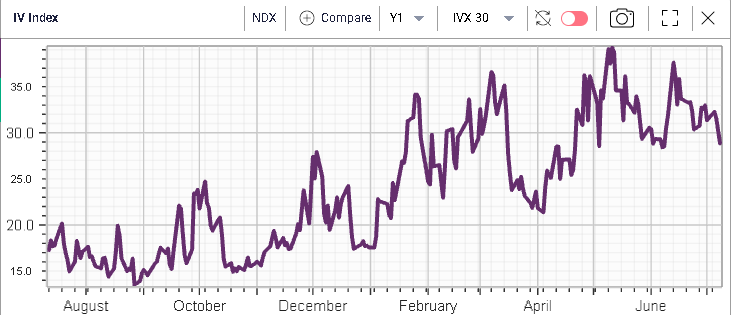
Looking at volatility throughout the week, it continued to move lower with the SPX dropping around 2 points on the week and the NDX 30d IVX closing almost 3 points lower. |
|
|
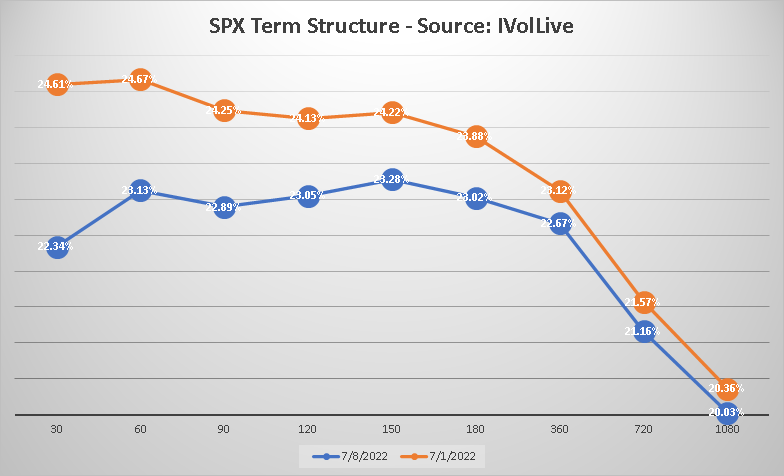
Looking at the change in the term structure of the SPX over the week (see chart below), we can see the implied volatilities have parallel shifted lower led mostly by short-dated implied volatilities. The relationship between 30d and 60d implied volatilities is quite interesting. The two maturities were trading at pretty much the same level on the 1st Jul’22 but have now separated with the 30d IV trading around 0.7% below the 60d implied volatility. |
|
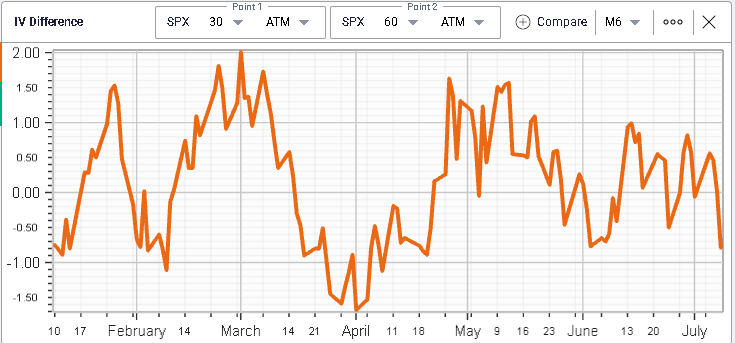
Using the IV Difference chart in IVolLive, we show how the 30/60d IV spread is now back to a low level compared to where it has traded in 2022. |
|
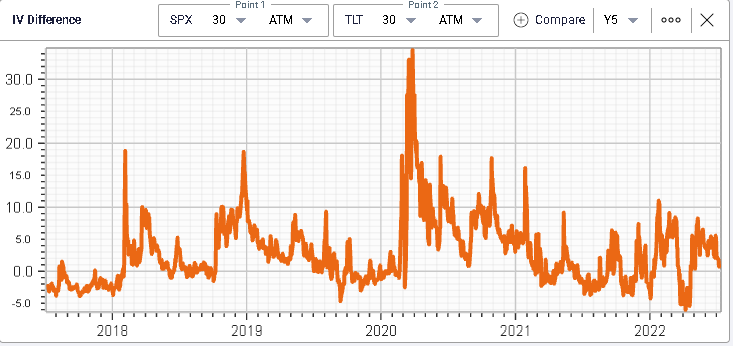
If you are a frequent reader of our market update, you will remember an analysis we did last week on the volatility of the bond market compared with the volatility of the equity market. We saw that the bond market seemed to be pricing in a lot more information than the equity market was. |
This phenomenon is also visible on the below chart highlighting the excess volatility of the SPX over TLT measured over 30 days. |
|
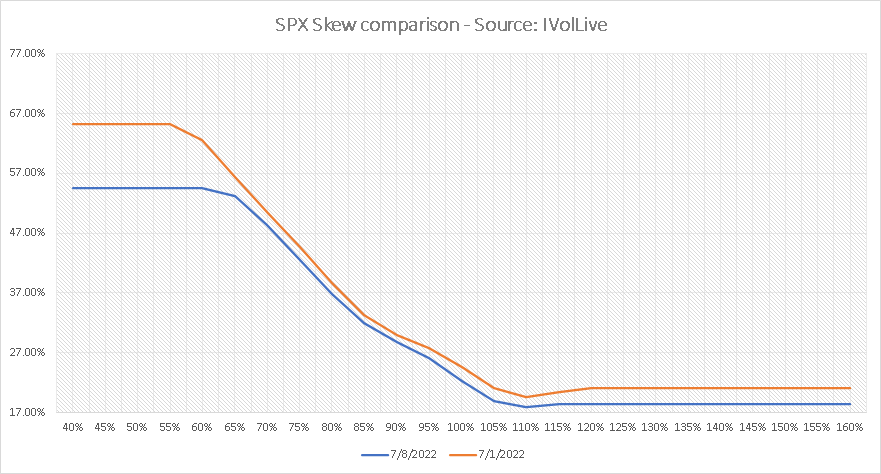
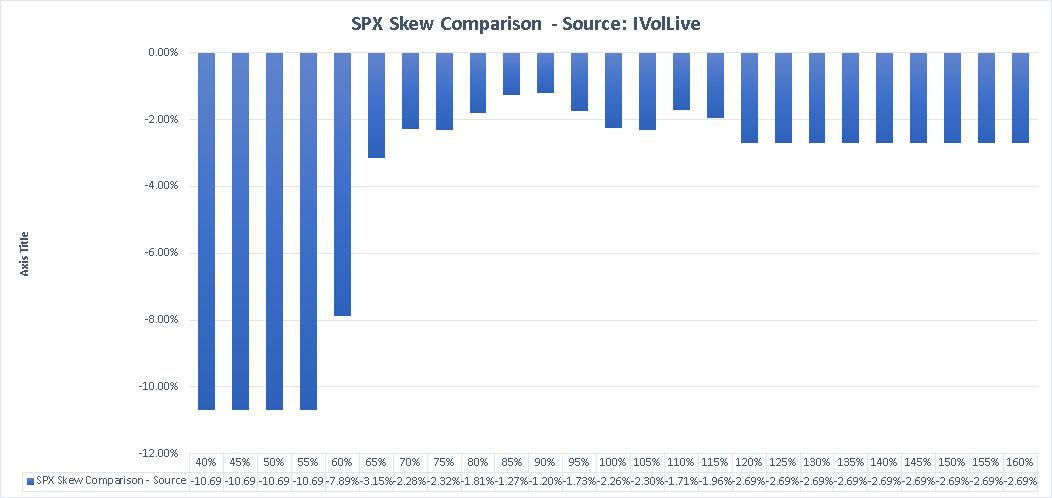
Looking at skew using Ivolatility.com data, we see that the curve shifted lower over the week with calls close to the money dropping more than puts close to the money. |
|
Looking at the actual change in IV, we get the following chart which simply displays the change observed for a specific strike. |
|
Looking at the most active options, it is first interesting to note the large amount of volume happening on very far out of the money options. |
For instance, we note that 18k of the Sep’22 600 puts (yes 600!) traded on Friday. We also saw trades for 12.5k of the August 2000 puts and 12.2k of the September 2500 puts. Further out, the 20th Jan’23 1400 puts traded 12k times. As we get close to the July expiration this Friday, we saw a lot of activity for short dated weekly options. |
Worth mentioning that for the German DAX on Monday, some activity was visible on August puts with 5.6k of the 10600 puts and 5.3k of the 11000 puts trading. On Tuesday another 4k of the August 12000 puts traded. |
From a macro perspective, the next few weeks will be highly important for the market as many releases are now due and will shape trader’s and policymakers’ expectations on the inflation front. Despite that, the equity market makers are now assigning a greater probability that the market remains range bound over the next few weeks. |
Disclaimer - This information is provided for general information and marketing purposes only. The content of the presentation does not constitute investment advice or a recommendation. IVolatility.com and its partners do not guarantee that this information is error free. The data shown in this presentation are not necessarily real time data. IVolatility.com and its partners will not be liable for any loss or damage, including without limitation, any loss of profit, which may arise directly or indirectly from the use or reliance on the information. When trading, you should consider whether you can afford to take the high risk of losing your money. You should not make decisions that are only based on the information provided in this video. Please be aware that information and research based on historical data or performance do not guarantee future performance or results. Past performance is not necessarily indicative of future results, and any person acting on this information does so entirely at their own risk. |